- Ethereum has more downside potential after strong gains in recent months.
- Bitcoin is lagging in the upward movement but much closer to key support levels.
- BTC regains ground against ETH and acts as a safe haven from big selling.
After months of continuous rise, selling finally arrived to the market. The sustained upward trend meant that there was a risk of overheating, and we can see this clearly in Ethereum, which now pays the highest gain among the Top 3 club members.
The dominance charts showed several days ago that Bitcoin had a good chance of doing better than Ether, and this is happening.
The Ethereum dominance chart shows the excessive deviation of the price from the 200-day moving average.
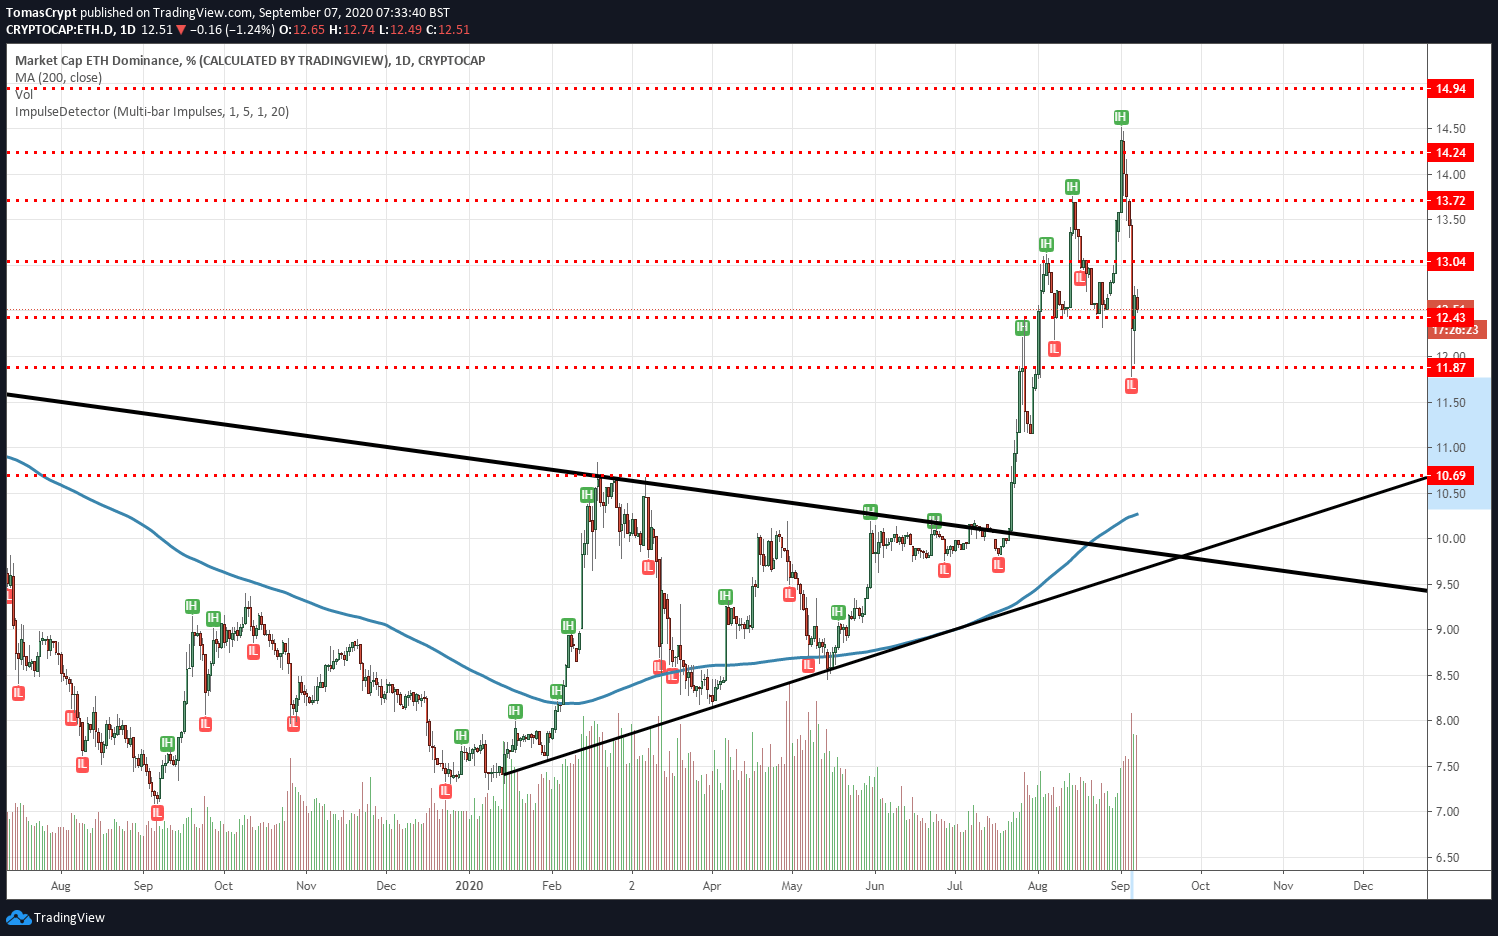
This simple average of the last 200 days is a benchmark in classic technical analysis. The SMA200 acts as an attractor on the price and that sooner or later they must coincide. Well, in the case of the Ether dominance chart, the 200-day moving average is 12.34% below the relative lows.
Let's see where each one is after the falls of the last hours. Below, we see the distance in percentage to the moving average. A positive rate indicates that the influence of the 200 moving average is positive for the asset:
| Asset | Distance to the SMA | Target Price |
|---|---|---|
| BTC Dominance | +4.52% | 64.86 |
| ETH Dominance | -12.34% | 10.26 |
| ETH/BTC | -15.65% | 0.265 |
| BTC/USD | -.7.60% | $9100 |
| ETH/USD | -20.33% | $250 |
| XRP/USD | -6.70% | $0.215 |
Ethereum must now pay its tribute for its stellar performance since the March lows.
ETH/BTC Daily Chart
The ETH/BTC pair is currently trading at 0.338 after dropping to a relative low of 0.03117 last Saturday. The 200-day moving average is moving to the 0.0265 price level. The SMA200 retains its bullish profile, so it can quickly approach the price.
Above the current price, the first resistance level is at 0.0347, then the second at 0.0372 and the third one at 0.040.
Below the current price, the first support level is at 0.0328, then the second at 0.0315 and the third one at 0.0305.
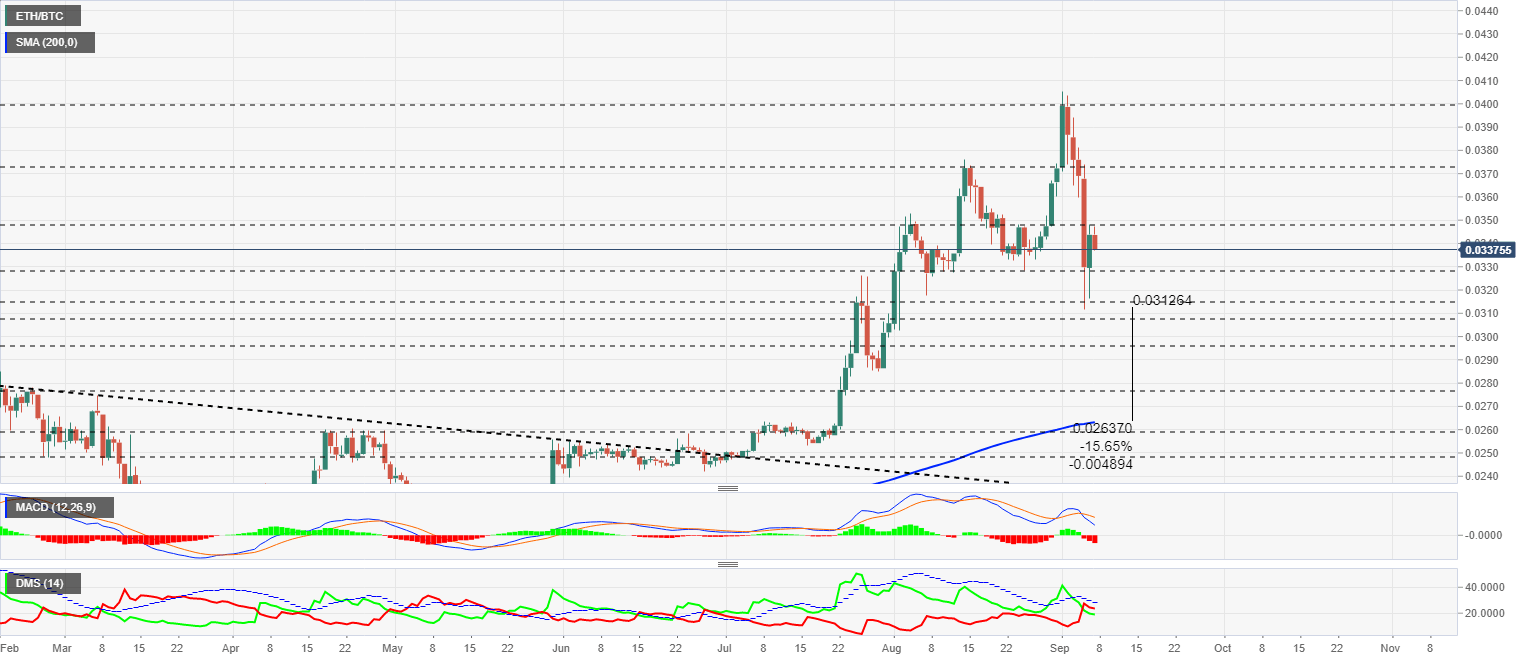
The MACD on the daily chart shows a strong downward acceleration. The slope of the averages that make up this indicator and the distance between them show significant downward potential.
The DMI on the daily chart shows bears with control of the pair. The sell-side has not crossed the ADX line, a technical event that would accelerate the decline in the pair.
BTC/USD Daily Chart
The BTC/USD pair is currently trading at the price level of $10078 and is still at 7.60% of the 200-day moving average. The SMA200 shows a flat profile, so if you have to find the price and the arithmetic average the run will be the price.
Above the current price, the first resistance level is at $10450, then the second at $11400 and the third one at $11900.
Below the current price, the first level of support is at $9500, then the second at $9100 and the third one at $8255.
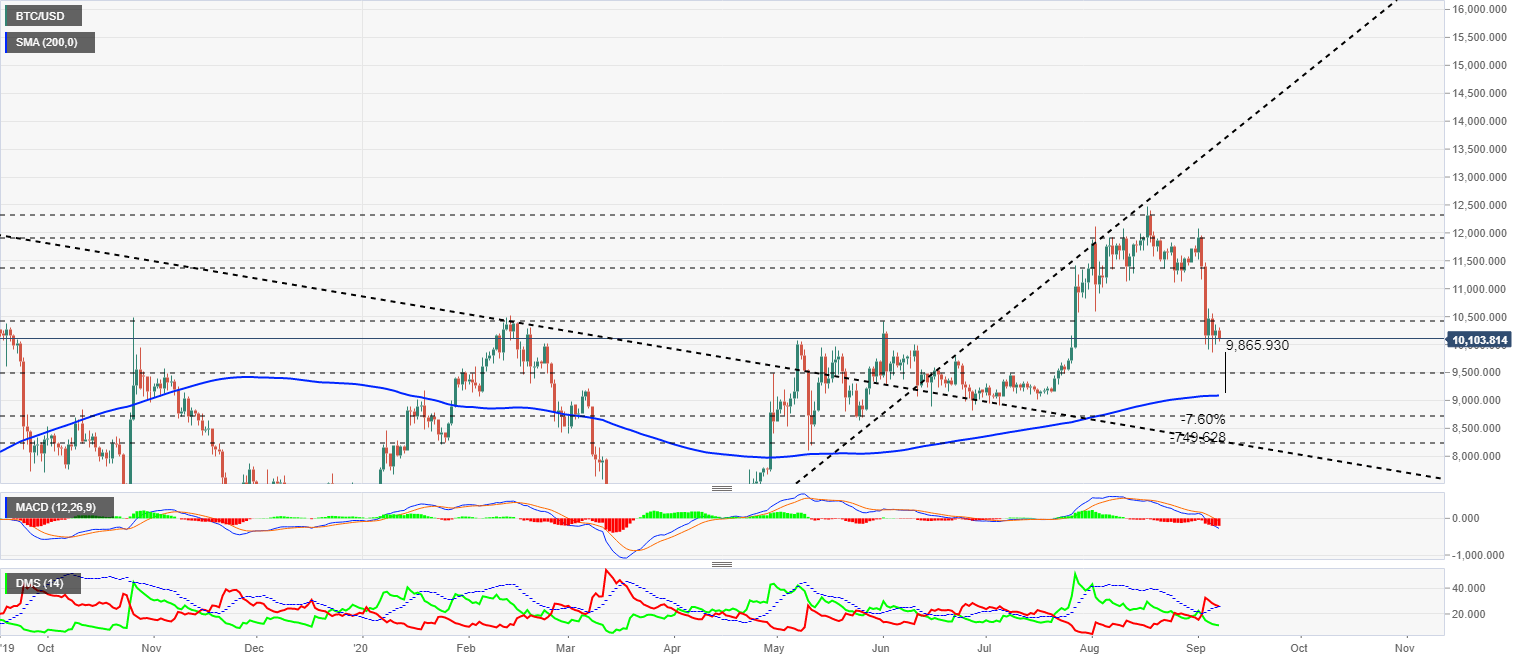
The MACD on the daily chart is entering the negative territory of the indicator and shows significant potential for further downward movement.
The DMI on the daily chart shows bears looking for support on the ADX line. The most likely pattern is for the selling side to regain strength from this level. The bulls do not react and continue their downward path.
ETH/USD Daily Chart
The ETH/USD pair is currently trading at $342 and is dropping again after yesterday's significant recovery.
Above the current price, the first resistance level is at $360, then the second at $387 and the third one at $410.
Below the current price, the first support level is at $315, then the second at $288 and the third one at $270.
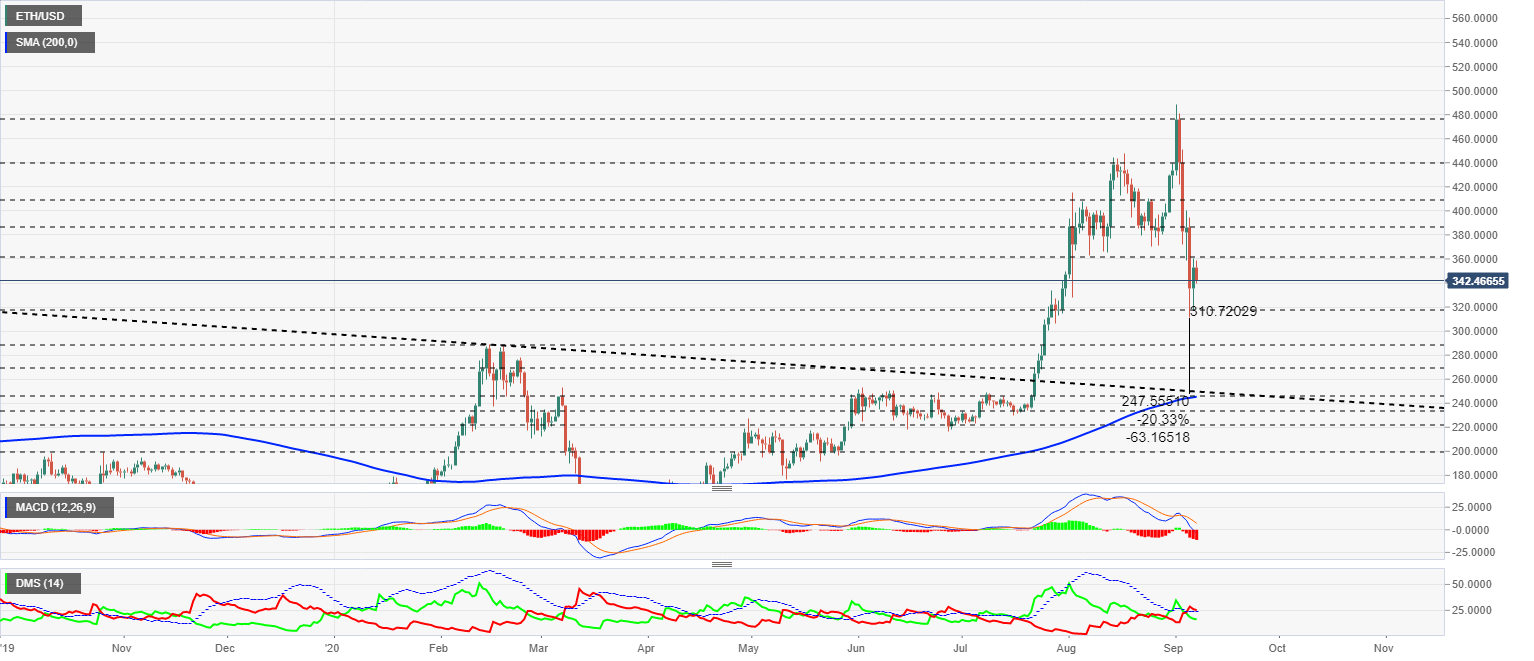
The MACD on the daily chart is at the crossroads of the bearish trend indicator. The profile of the moving averages is very aggressive, which could lead to a sharp rebound in the short term.
The DMI on the daily chart shows bears looking for confirmation on the ADX line. The most common behavioural pattern suggests that bears may increase their strength from this point.
XRP/USD Daily Chart
The XRP/USD pair is currently trading at a price level of $0.2365 and is losing all gains made yesterday. Ripple is very close to the SMA200 and other supports, so it should have no problem maintaining similar levels to the current ones.
Above the current price, the first resistance level is at $0.2545, then the second at $0.263 and the third one at $0.295.
Below the current price, the first support level is at $0.235, then the second at $0.225 and the third one at $0.215.
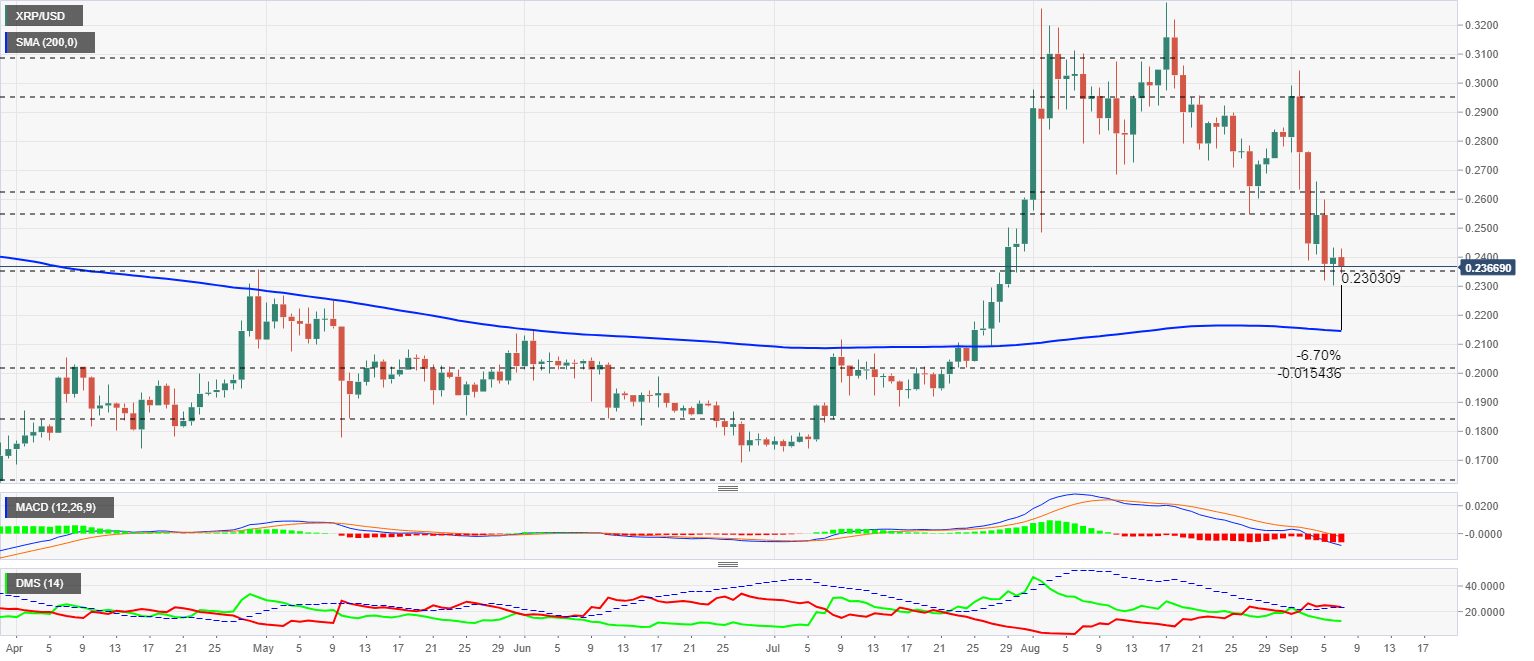
The MACD on the daily chart is moving completely bearish and shows a profile with significant downward potential.
The DMI on the daily chart shows bears looking for support on the ADX line, which offers an upward rebound opportunity that would increase the strength of the sell-side.
Information on these pages contains forward-looking statements that involve risks and uncertainties. Markets and instruments profiled on this page are for informational purposes only and should not in any way come across as a recommendation to buy or sell in these assets. You should do your own thorough research before making any investment decisions. FXStreet does not in any way guarantee that this information is free from mistakes, errors, or material misstatements. It also does not guarantee that this information is of a timely nature. Investing in Open Markets involves a great deal of risk, including the loss of all or a portion of your investment, as well as emotional distress. All risks, losses and costs associated with investing, including total loss of principal, are your responsibility. The views and opinions expressed in this article are those of the authors and do not necessarily reflect the official policy or position of FXStreet nor its advertisers. The author will not be held responsible for information that is found at the end of links posted on this page.
If not otherwise explicitly mentioned in the body of the article, at the time of writing, the author has no position in any stock mentioned in this article and no business relationship with any company mentioned. The author has not received compensation for writing this article, other than from FXStreet.
FXStreet and the author do not provide personalized recommendations. The author makes no representations as to the accuracy, completeness, or suitability of this information. FXStreet and the author will not be liable for any errors, omissions or any losses, injuries or damages arising from this information and its display or use. Errors and omissions excepted.
The author and FXStreet are not registered investment advisors and nothing in this article is intended to be investment advice.
Recommended Content
Editors’ Picks

Bitcoin Weekly Forecast: BTC nosedives below $95,000 as spot ETFs record highest daily outflow since launch
Bitcoin price continues to edge down, trading below $95,000 on Friday after declining more than 9% this week. Bitcoin US spot ETFs recorded the highest single-day outflow on Thursday since their launch in January.

Bitcoin crashes to $96,000, altcoins bleed: Top trades for sidelined buyers
Bitcoin (BTC) slipped under the $100,000 milestone and touched the $96,000 level briefly on Friday, a sharp decline that has also hit hard prices of other altcoins and particularly meme coins.

Solana Price Forecast: SOL’s technical outlook and on-chain metrics hint at a double-digit correction
Solana (SOL) price trades in red below $194 on Friday after declining more than 13% this week. The recent downturn has led to $38 million in total liquidations, with over $33 million coming from long positions.

SEC approves Hashdex and Franklin Templeton's combined Bitcoin and Ethereum crypto index ETFs
The SEC approved Hashdex's proposal for a crypto index ETF. The ETF currently features Bitcoin and Ethereum, with possible additions in the future. The agency also approved Franklin Templeton's amendment to its Cboe BZX for a crypto index ETF.

Bitcoin: 2025 outlook brightens on expectations of US pro-crypto policy
Bitcoin (BTC) price has surged more than 140% in 2024, reaching the $100K milestone in early December. The rally was driven by the launch of Bitcoin Spot Exchange Traded Funds (ETFs) in January and the reduced supply following the fourth halving event in April.

Best Forex Brokers with Low Spreads
VERIFIED Low spreads are crucial for reducing trading costs. Explore top Forex brokers offering competitive spreads and high leverage. Compare options for EUR/USD, GBP/USD, USD/JPY, and Gold.