- Bitcoin price falls sharply during the second week of October.
- Ethereum price hints at more decline in the coming days.
- Ripple's XRP price could produce an uptrend rally before more downslide occurs.
The crypto market descends in freefall fashion. At the current time, jumping into the market for a bounce could lead to painful losses. Key levels have been identified to estimate where the cryptocurrency decline may flatline
Bitcoin price has space to fall
Bitcoin price is currently trading at $19,100. The bears have breached the 21-day Simple Moving Average (SMA) to start the second week of October. Losing support from the key indicator suggests the current 8% decline is only the start of what's to come.
Bitcoin price has fallen into extremely oversold territory on the Relative Strength Index (RSI). The indicator suggests there will be bounces for countertrend scalpers, but the pumps will likely be short-lived. A pullback into the recently breached moving averages near the $19,300 zone has recently occurred, and the bears produced a strong rejection. If market conditions persist, the $19,000 support level will collapse in the coming days.
Traders may want to consider staying with the downtrend until further notice. BTC price could continue to fall, with key targets at $18,700 and the summer lows at $17,500.
The safest invalidation of the bearish outlook is a break above the September high at $22,800. If the bulls can reconquer this barrier, an additional rally could occur and propose an attempt to take out liquidity above the August high at $25,214. Such a move would result in a 30% increase from the current Bitcoin price.
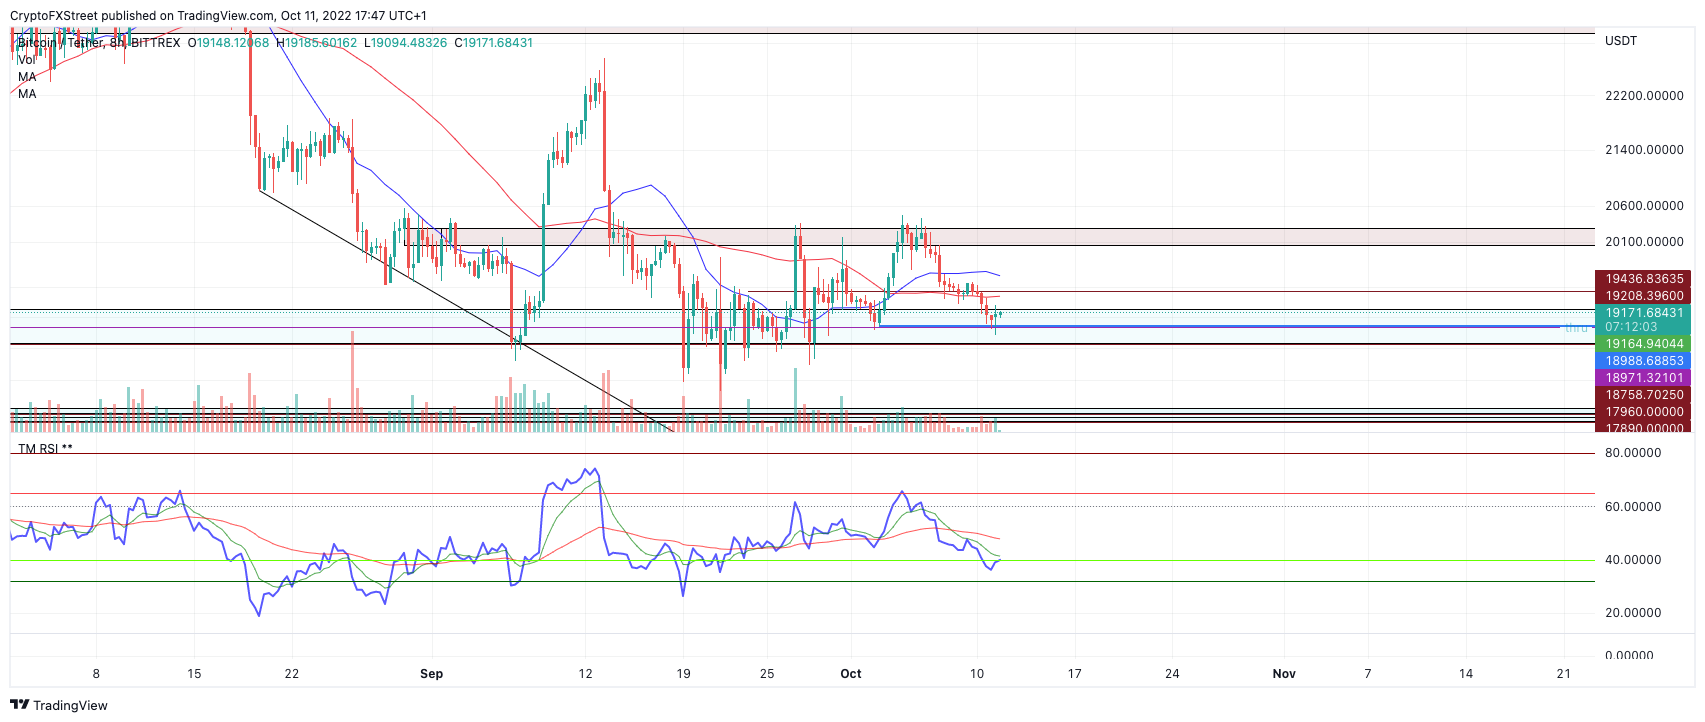
BTC/USD 8-Hour Chart
In the following video, our analysts deep dive into the price action of Bitcoin, analyzing key levels of interest in the market. -FXStreet Team
Ethereum price falls hard
Ethereum price has fallen 5% since the weekend, bringing the entire market value down 8% since the start of October. On Monday, the bears produced the penny-from-Eiffel-style decline, giving little chance for trapped bulls to relieve their losing positions. Like Bitcoin, the decentralized smart contract was also rejected from the 8-day Exponential Moving Average (EMA).
Ethereum price currently auctions at $1,279. The RSI has also fallen into extremely oversold conditions signaling bearish strength. However, the decline does come under relatively low volume compared to the previous one. Still, the steep nature of the downmove suggests the bears are only halfway near bounce-worthy levels. If market conditions persist, a fall towards $1,220 will occur in the coming days.
This thesis remains bearish so long as the recently established swing low at $1,336 stays unbreached. If the bulls break this level, an additional pump toward $1,362 is likely to occur. Such a move would result in a 7% increase from the current Ethereum price.
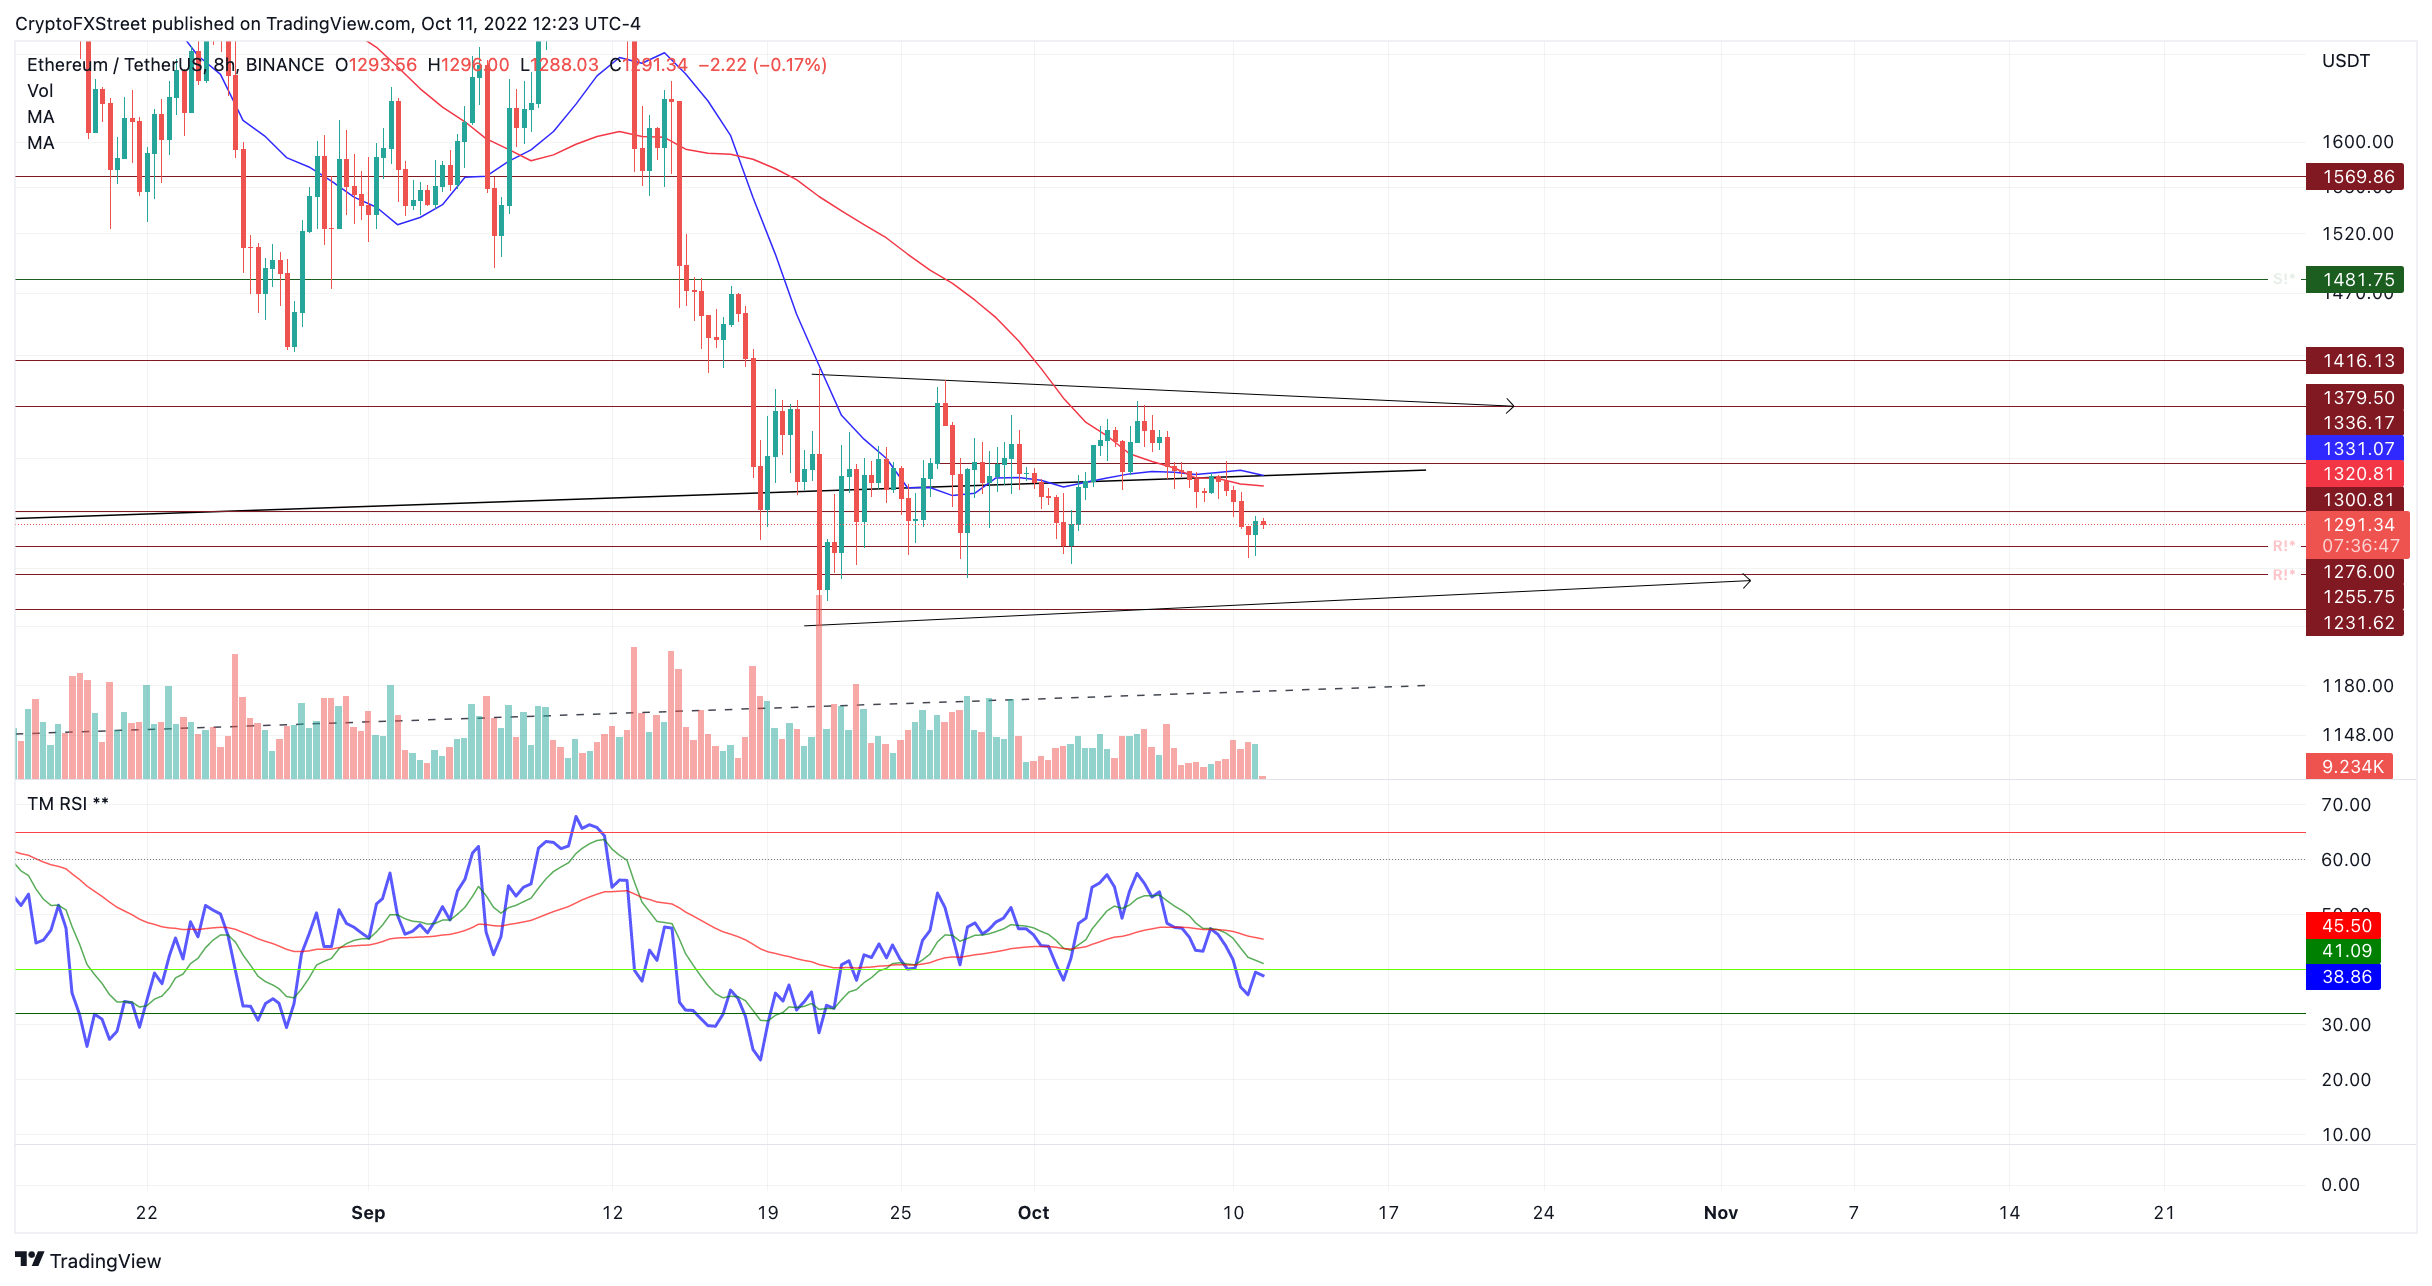
ETH/USDT 8-Hour Min Chart
In the following video, our analysts deep dive into the price action of Ethereum, analyzing key levels of interest in the market. -FXStreet Team
Ripple price falls back to $0.51
Ripple's XRP price is down 10% since rallying to $0.54 over the weekend. The steep decline shows a slight uptick in volume but still is less than the previous uptrend rally. This suggests the bulls are losing steam but may have one more move upward to produce in the coming days.
XRP price currently auctions at $0.49. The digital remittance token has found support from the 21-day SMA and is coiling just underneath the 8-day EMA. The RSI is now back above supportive territory after falling into oversold conditions. There is a hidden bullish divergence signal that shows the current $0.48 swing low as more oversold than the October 3 swing low at $0.44. The $0.04 difference in RSI could create a favorable range for day traders to the scalp. Ultimately, placing a short at the current time would be highly risky for said reasons.
Traders should be on the lookout for a pump back to $0.51 in the coming days. An influx of volume coming into the market without breaching new highs could create favorable conditions for sidelined bears to enter the market. Invalidation of the bullish thesis targeting $0.51 relies on a break of the $0.44 swing low. Conversely, the bearish trade idea demands the swing high at $0.56 remains untagged.
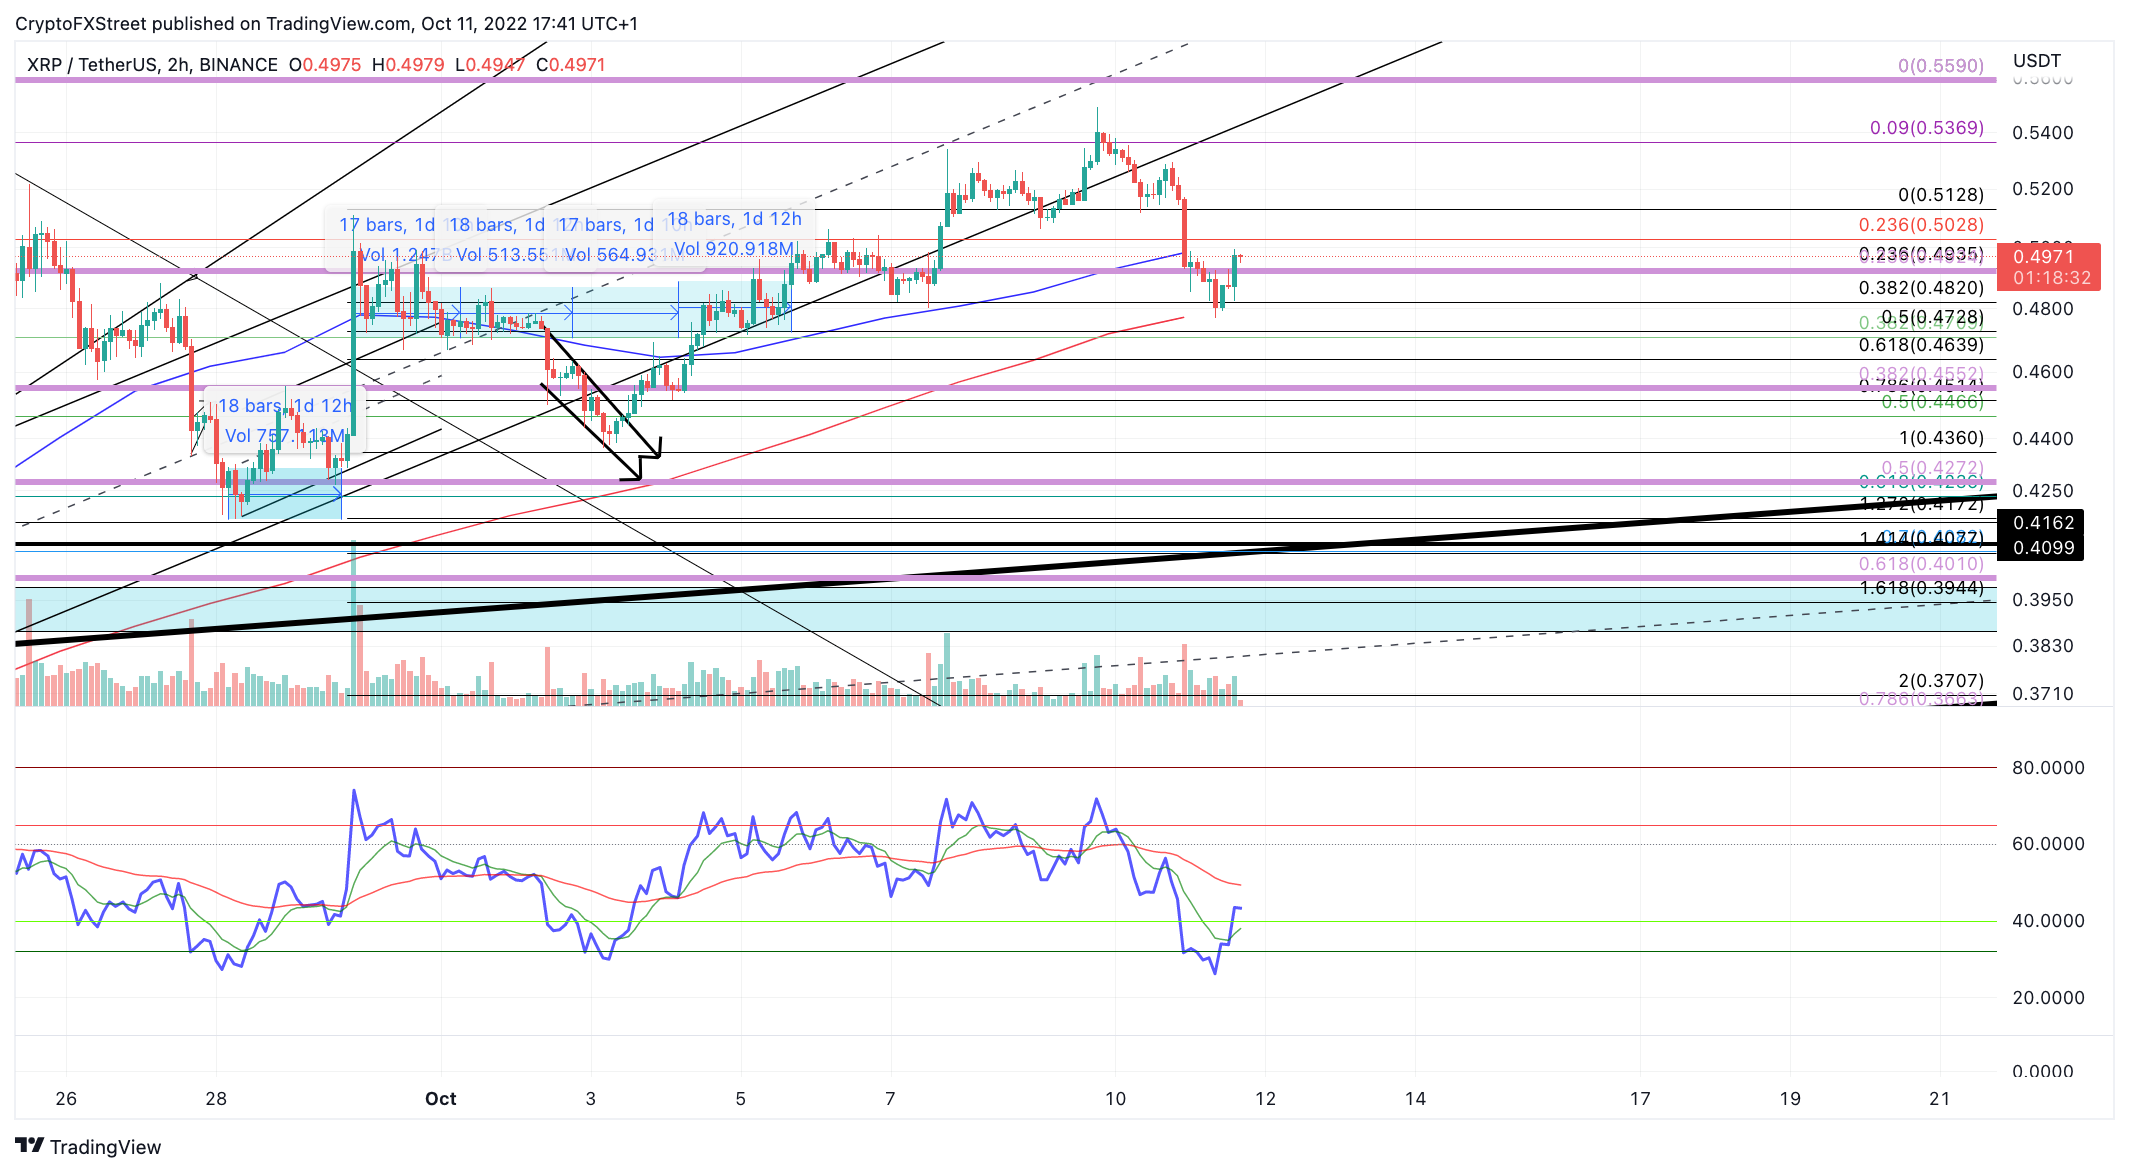
XRP/ USDT 2-Hour Chart
In the following video, our analysts deep dive into the price action of Ripple, analyzing key levels of interest in the market. -FXStreet Team
Information on these pages contains forward-looking statements that involve risks and uncertainties. Markets and instruments profiled on this page are for informational purposes only and should not in any way come across as a recommendation to buy or sell in these assets. You should do your own thorough research before making any investment decisions. FXStreet does not in any way guarantee that this information is free from mistakes, errors, or material misstatements. It also does not guarantee that this information is of a timely nature. Investing in Open Markets involves a great deal of risk, including the loss of all or a portion of your investment, as well as emotional distress. All risks, losses and costs associated with investing, including total loss of principal, are your responsibility. The views and opinions expressed in this article are those of the authors and do not necessarily reflect the official policy or position of FXStreet nor its advertisers. The author will not be held responsible for information that is found at the end of links posted on this page.
Recommended Content
Editors’ Picks

Crypto Gainers WIF, SPX, HYPE: Meme coins soar with Bitcoin’s recovery to $106K
Crypto market bounces back as Bitcoin (BTC) reclaims the $106,000 level at press time on Tuesday, resulting in a refreshed rally in top meme coins such as Dogwifhat (WIF) and SPX6900 (SPX), and Pepe (PEPE).

Meta shareholders turn down Bitcoin treasury reserve proposal as its stock soar on AI plans
Meta (META) shareholders opposed a proposal to adopt Bitcoin as a treasury asset, with more than 95% voting against the idea, according to a filing with the Securities & Exchange Commission (SEC).

Ripple price forecast: XRP price could hit $1.76 this week amid potential 20% correction
Ripple (XRP) faces legal uncertainty in its battle with the United States Securities and Exchange Commission, and the XRP price continues to slide. At the time of writing, XRP is trading at $2.1540, down 1.20% in the day.

Bitcoin: BTC dips as profit-taking surges, but institutional demand holds strong
Bitcoin (BTC) is stabilizing around $106,000 on Friday, following three consecutive days of correction that have resulted in a near 3% decline so far this week. The correction in BTC prices was further supported by the profit-taking activity of its holders, which has reached a three-month high.