Top 3 Price Prediction Bitcoin, Ethereum, Ripple: Stellar shines, ETH/BTC bracing for a fall
- Mass industry adoption of blockchain technology continues to Increase.
- The crypto market enters a sideways/downward cycle and is likely to begin August at discount prices.
- ETH/BTC could fall more than 5% in the next month.

The market entered a scenario of the relative strength of Bitcoin versus Ethereum on Thursday. The war for dominance took a turn – and Bitcoin grabbed the initiative to avoid moving away from current levels, which threatened to keep the King's market share above 60%.
The immediate effect was widespread declines but with a particular impact on the Altcoin segment.
At the opening of the European session, Ethereum continues to show weakness and a ride to the $220 level, and then $200 will already seem inevitable. The Altcoin market is now rebounding and showing the market's interest in buying these second-tier assets.
Stellar-Lumens was the exception after the Stellar Foundation announced that Samsung would be integrating Stellar-Lumens technology into its Samsung Key Store.
With this integration, developers will be able to work on the XLM network to create decentralized solutions.
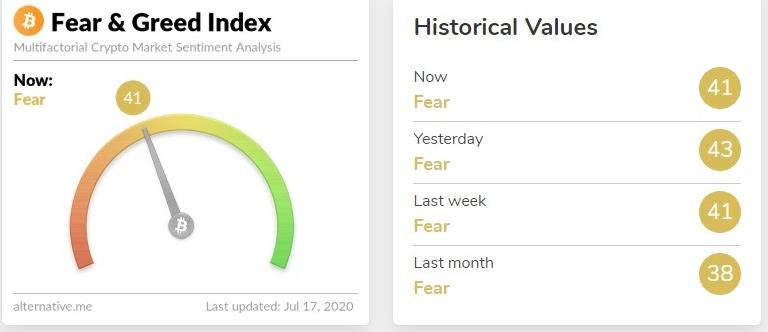
The market sentiment seems to understand the scenario and maintains previous levels despite the perennial pessimism it always shows. The indicator prepared by the Alternative.me site remains at level 41 today, two less than yesterday but in similar ranges to those of last week.
ETH/BTC Daily Chart
ETH/BTC is currently trading at 0.02555 and is at risk of losing the 0.026 as support. The 200-day Simple Moving Average is losing momentum and is now on its way to 0.024. The price target is 0.024, if projected over time, it would create a possible encounter with the spot price around the middle of August. This price target means a drop of 5.4% in ETH/BTC.
Above the current price, the first resistance level is at 0.0276, then the second at 0.0242 and the third one at 0.0295.
Below the current price, the first support level is at 0.02526, then the second at 0.02482 and the third one at 0.0245.
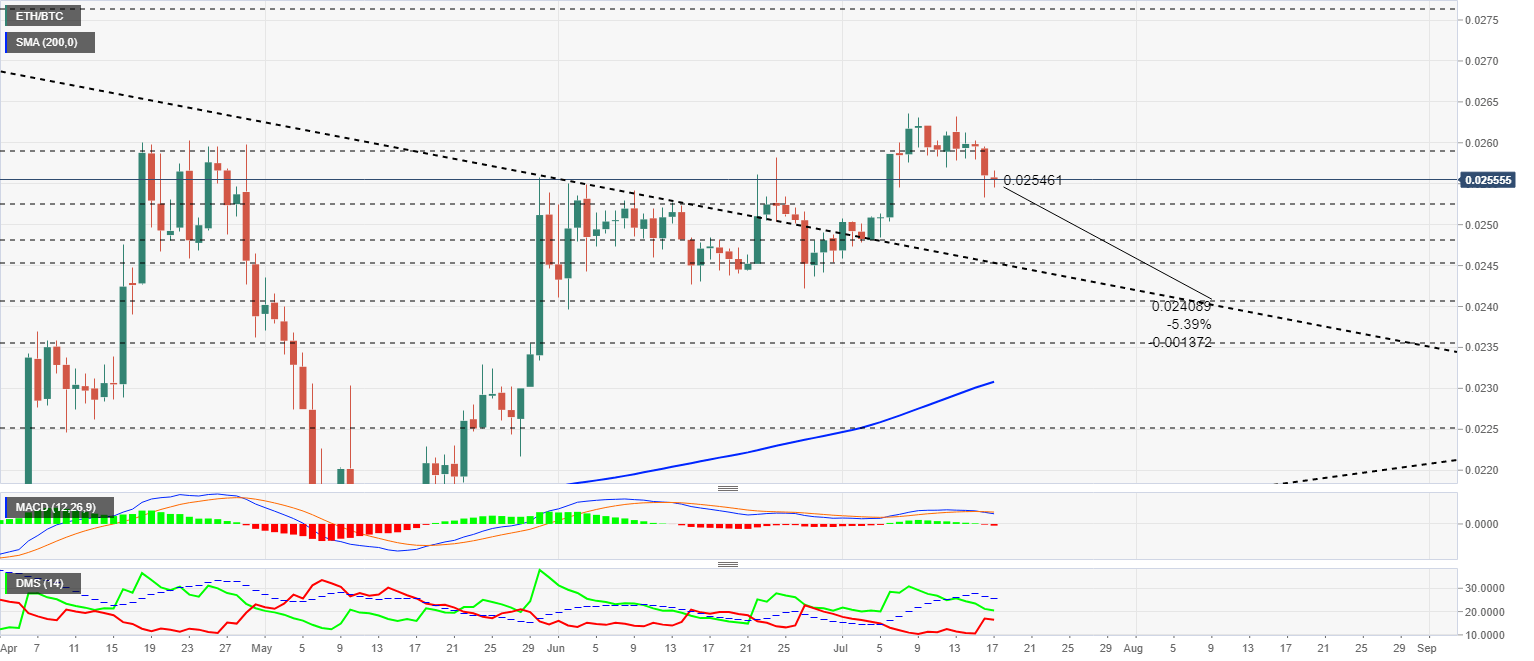
The MACD on the daily chart confirms the bearish cross, although it is considerably early and not aggressively bearish. The current structure is conducive to changes in direction and possibly an attempt to undo the bearish cross.
The DMI on the daily chart shows bulls with a small advantage over bears, although a meeting between the two sides of the market is inevitable. This structure also favors intraday direction changes.
BTC/USD Daily Chart
BTC/USD is currently trading at $9,113. Bitcoin – despite taking control of the internal war for dominance – also pays its price for instability in the cryptocurrency market. The 200-day SMA is heading towards the $8,750 zone and would reinforce that price range, where there is already support for price congestion.
Above the current price, the first resistance level is at $9,500, then the second at $9,860 and the third one at $10,400.
Below the current price, the first support level is at $8,750, then the second at $8,575 and the third one at $8,400.
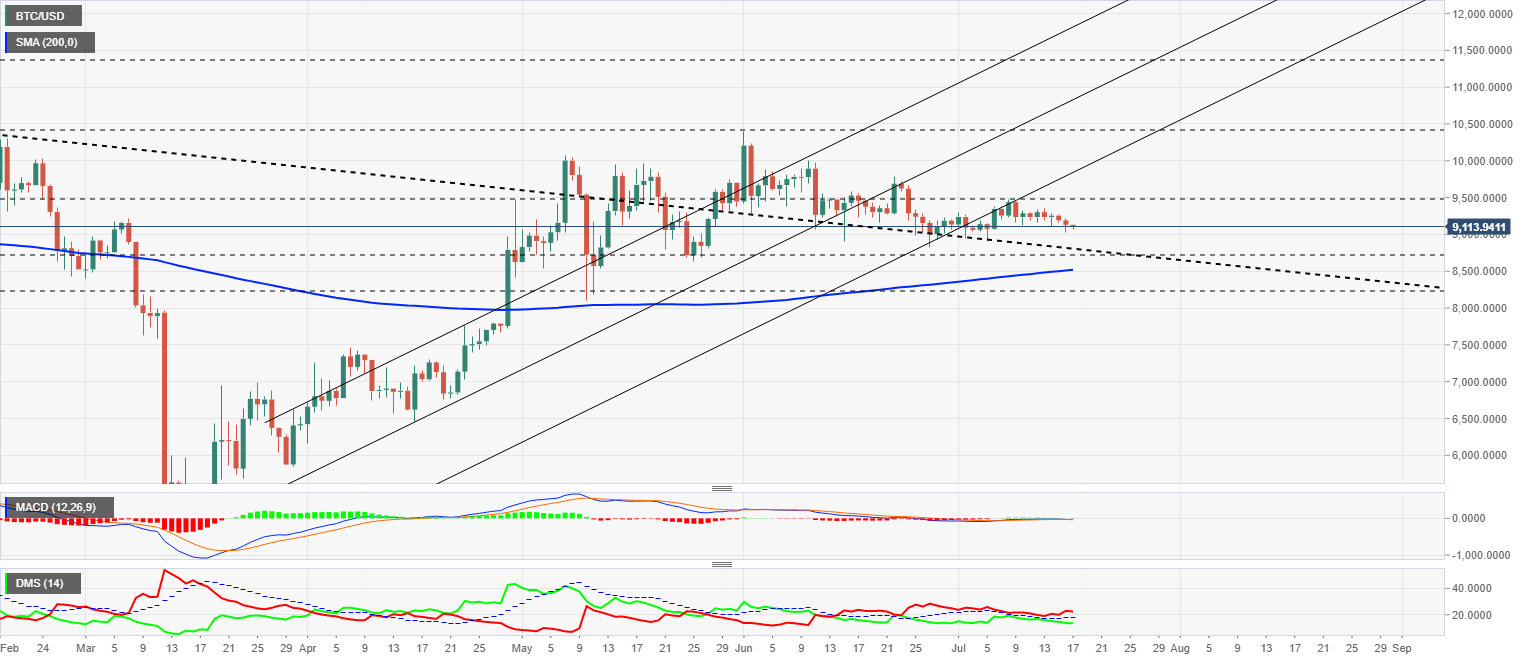
The MACD on the daily chart is losing all momentum, and there is no sign of strength in either direction. The current structure of the MACD indicator usually develops in the form of a violent movement that shakes the technical indicators and provides guidance and strength.
The DMI on the daily chart shows bears controlling BTC/USD with plenty of authority. The position of the D- above the ADX, keeps the bearish pattern active and the bears show no interest in taking over from the BTC/USD pair.
ETH/USD Daily Chart
ETH/USD is currently trading at $233 and remains at the price congestion support level. The 200-day simple moving average is losing some of its upward momentum and could stagnate at the $200 level.
Above the current price, the first resistance level is at $245, then the second at $260 and the third one at $270.
Below the current price, the first support level is at $220, then the second at $200 and the third one at $185.
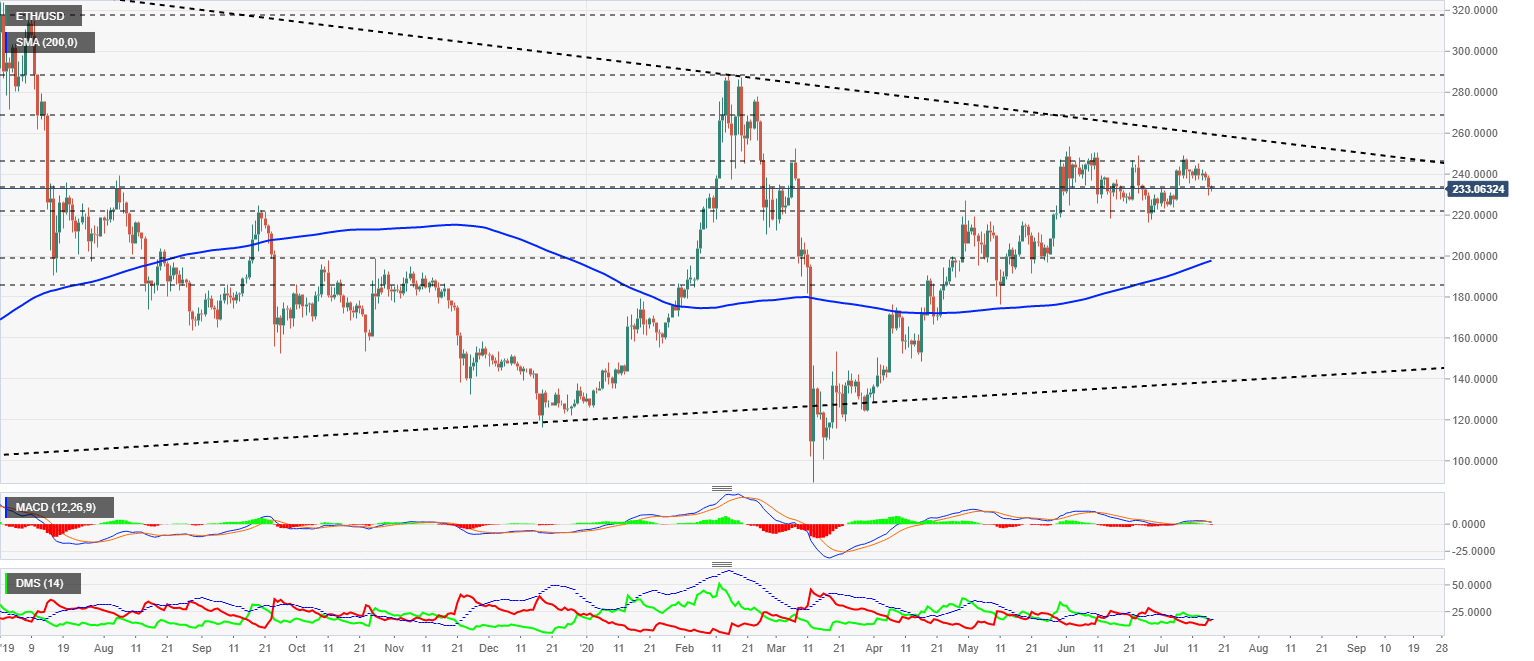
The MACD on the daily chart confirms the bearish cross while it is already above the zero levels of the indicator. The arrival of the MACD at the neutral level could provide support and halt the downward movement for a while.
The DMI on the daily chart shows the bulls and bears are facing a leadership position in the ETH/USD pair. Both sides of the market are above the ADX line, a factor that will quickly reinforce the winning side of the current cross.
XRP/USD Daily Chart
XRP/USD is currently trading at $0.1924 as it continues to deepen in the current bearish scenario. The 200-day SMA presents an utterly flat profile at $0.21, which brings a degree of optimism to the short-term development of the Ripple price.
Above the current price, the first resistance level is at $0.1985, then the second at $0.2015 and the third one at $0.21.
Below the current price, the first level of support is at $0.184, then the second at $0.175 and the third one at $0.163.
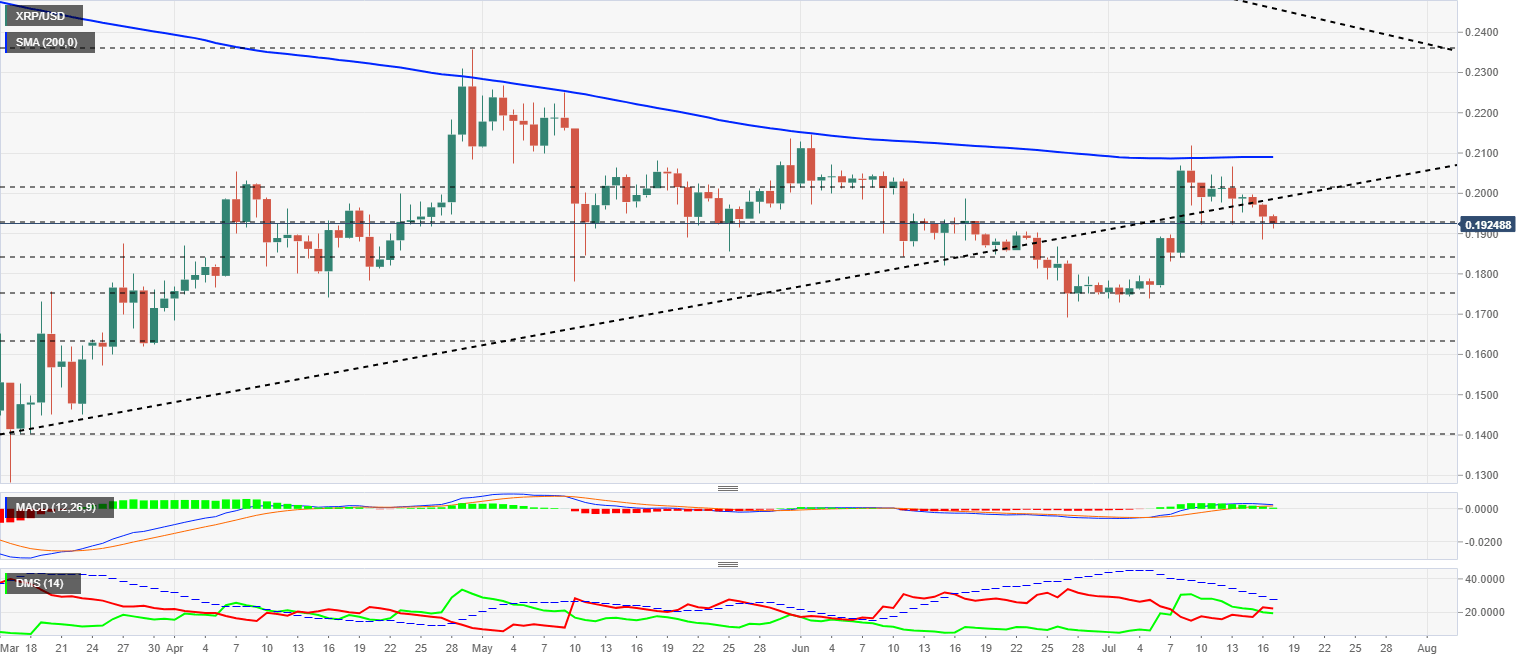
The MACD on the daily chart shows a flat profile that could move down to seek support at the zero levels of the indicator.
The DMI on the daily chart shows the bears leading the pair but without a lead against the bulls. Both sides of the market are moving below the ADX line, a structure that prevents large price movements.
Author

Tomas Salles
FXStreet
Tomàs Sallés was born in Barcelona in 1972, he is a certified technical analyst after having completing specialized courses in Spain and Switzerland.


