Top 3 Price Prediction Bitcoin, Ethereum, Ripple: Rough Q2 for BTC to headline Tesla earnings, while ETH may drop 30%
- Bitcoin price momentum continues to fade on the intra-day charts, projecting a break to the downside at any time.
- Ethereum price is now entangled with the tactically important 50-day simple moving average (SMA).
- XRP price trades with no intention, forms new channel along $0.65 with major technical obstacles above.

Bitcoin price has been unable to fulfill expectations of a meaningful rally after triggering a multi-month head-and-shoulders pattern. Meanwhile, Ethereum price shows exhaustion and may be near a significant decline. XRP price remains unchanged, offering few clues as to directional intentions.
Tesla to feel the effects of a challenging quarter for Bitcoin
Bitcoin price closed the 2Q down over 40%, marking the worst quarter since 4Q2018. The impact of the substantial loss will extend beyond the retail and institutional investors, hitting publicly traded companies like Tesla, which took on a $1.5 billion Bitcoin position earlier this year.
Tesla announced their initial investment in Bitcoin in February when the cryptocurrency was trading in the range of $32,000-$33,000.
It is anticipated that Tesla will announce in their quarterly report to investors that the impairment cost associated with the Bitcoin position will be between a $25 million and $100 million loss.
According to CNBC technology reporter Kate Rooney, the impairment charge will happen due to existing accounting practices.
Tesla holds crypto as an intangible asset, and because of the accounting rules, when Bitcoin’s value drops below a certain amount, companies have to mark that down in their financial statements.
Moreover, Tesla cannot mark up the price of Bitcoin until the company executes a sale of the position.
Despite the Bitcoin investment being at a loss, Elon Musk has reiterated that the company has no plans of selling the position in the foreseeable future.
Bitcoin price searches for a committed bid, but still in hibernation
Bitcoin price has failed to engineer a compelling rally from the June 22 correction low of $28,800, despite the formation of a weekly hammer candlestick pattern and the accompanying bullish momentum divergence highlighted on the daily BTC Relative Strength Index (RSI).
Bitcoin price bounce has plotted a rising wedge pattern with the most recent leg higher showing no impulsiveness or sustainability, creating a new descending trend line that may provoke a BTC dip towards the psychologically important $30,000.
A close below the rising wedge’s lower trend line and the 50 six-hour SMA at $34,308 will be the first confirmation that Bitcoin price is readying to revisit the correction lows. A decline below $32,703 will be the final confirmation.
With momentum waning and the declining 50-day SMA at $36,000 pressing down on Bitcoin price, the probabilities indicate that the risk is to the downside in the short term.
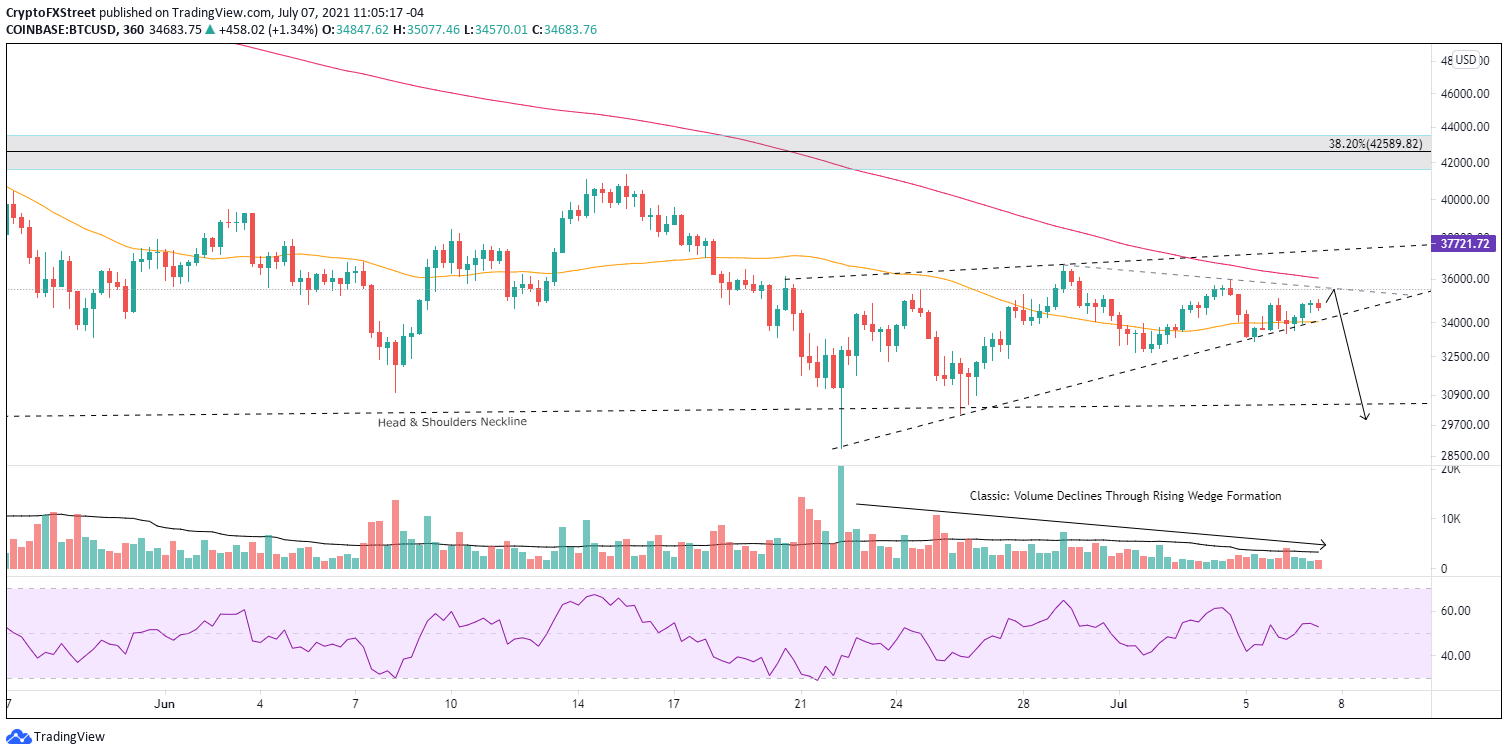
BTC/USD 6-hour chart
A close above the 200 six-hour SMA at $36,057 would negate the bearish projection and position Bitcoin price for a test of the rising wedge’s upper trend line, currently at $37,370. However, BTC will still need to engage formidable resistance at the Anchored VWAP from October 21, 2020 at $37,724 before the flagship cryptocurrency can reach the critical resistance at $42,500.
Here, FXStreet's analysts evaluate where BTC could be heading next as it seems bound for a correction before higher highs.
Ethereum price strikes key resistance as charts press for caution
Ethereum price, like Bitcoin, has plotted a rising wedge pattern from the June 22 low of $1,700 within the context of a larger descending triangle pattern beginning on May 20. In this case, the rising wedge is a continuation pattern as it slopes up against the prevailing ETH downtrend. It projects bearish price outcomes. Those outcomes may be around the corner as the smart contracts giant wrestles with the 200 six-hour SMA (similar to the 50-day SMA).
Note on the six-hour ETH chart below that the most recent high did not touch the wedge’s upper trend line, confirming a decline in momentum, and the current rally high has also fallen short of the upper trend line. At the same time, the RSI shows a bearish momentum divergence with Ethereum price.
If today’s high marks the end of the rally, the measured move of the rising wedge pattern is almost 30%, suggesting a test of the June 22 low $1,700.
A close below the wedge’s lower trend line currently at $2,307 will signal that the pattern is resolving to the downside, and a trade below $2,160 will provide the confirmation.
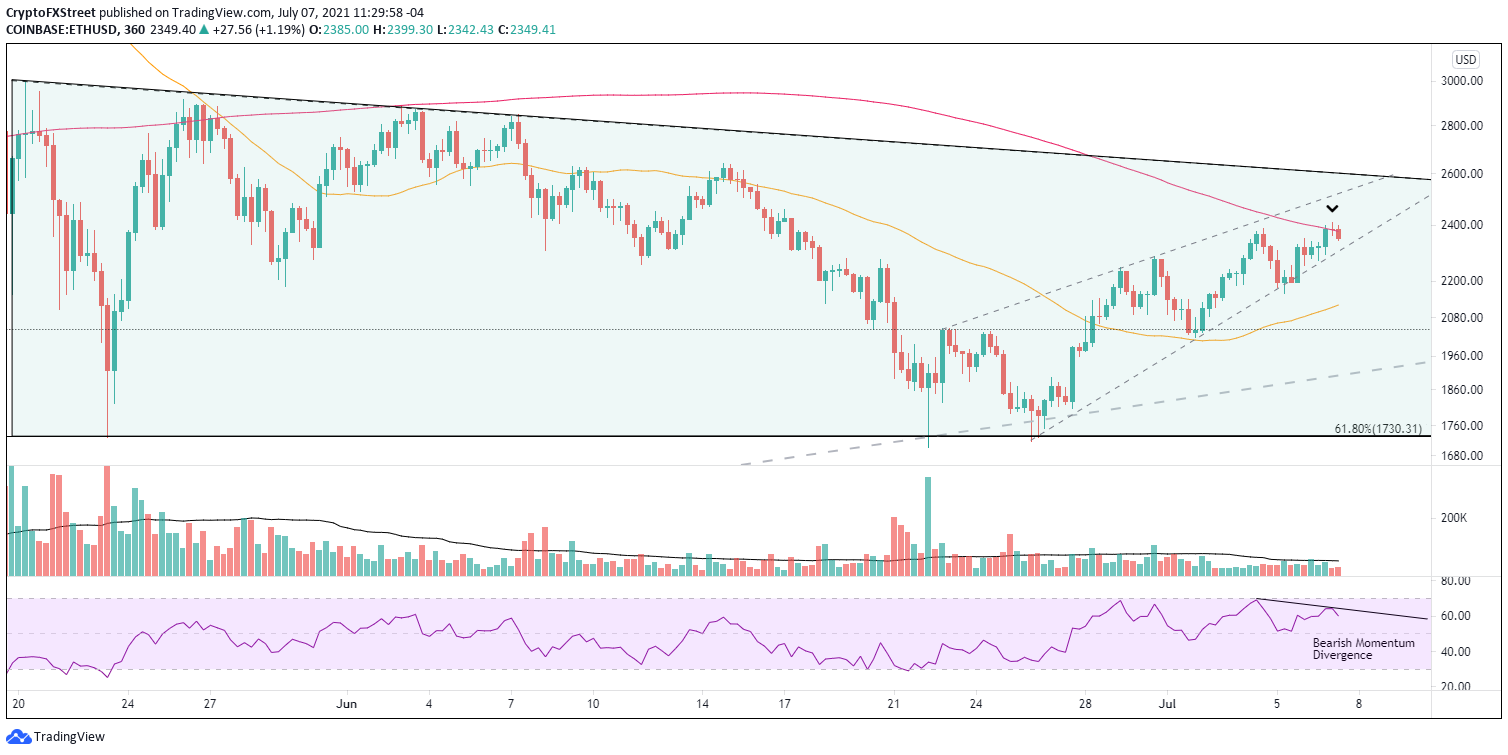
ETH/USD 6-hour chart
However, Ethereum price may continue in the rising wedge pattern, shaking off the resistance from the 200 six-hour SMA at $2,377 and reaching the upper trend line of the larger descending triangle.
Here, FXStreet's analysts evaluate where ETH could be heading next as it seems bound for a correction before higher highs.
XRP price testing the most-patient of investors
After a promising bounce of 45% from the June low of $0.512, XRP has resolved to the downside from a rising wedge pattern and located support at the union of the 50 six-hour SMA at $0.657 and the May 23 low of $0.652.
The measured move of the rising wedge pattern is approximately 30%, or a price target of $0.477. As a result, XRP price will bust through the 78.6% retracement level at $0.555 and the June 22 low of $0.512 in the process. It would be a 28% decline from the current price.
A daily close below $0.632 will trigger the new leg lower that may find temporary support at the 78.6% retracement. If the selling pressure persists beyond the June low of $0.512, there are no visible Ripple support levels until $0.360.
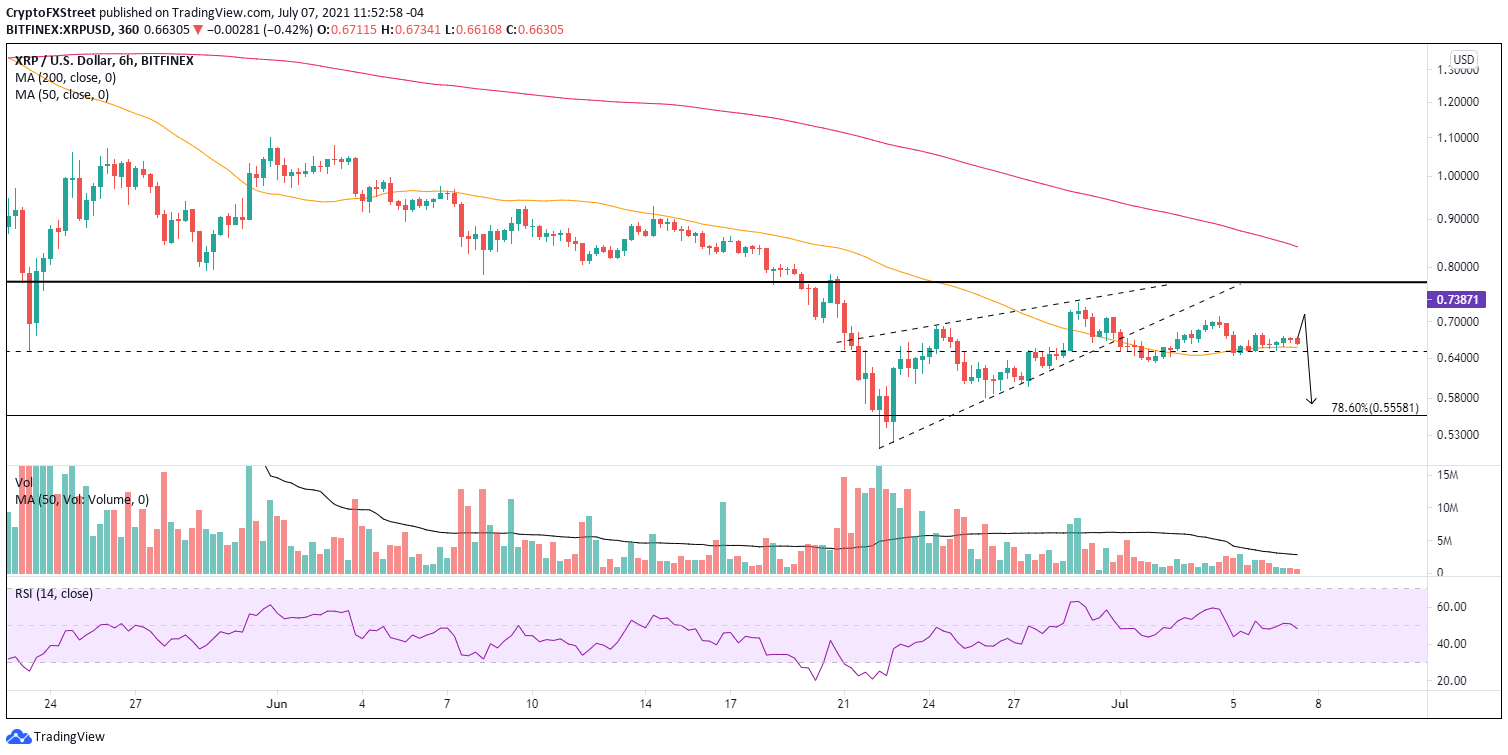
XRP/USD 6-hour chart
XRP price is not actionable from the long side until it logs a daily close above $0.760.
For now, the risk remains to the downside for XRP price.
Here, FXStreet's analysts evaluate where Ripple could be heading next as it seems bound for a correction.
Author

Sheldon McIntyre, CMT
Independent Analyst
Sheldon has 24 years of investment experience holding various positions in companies based in the United States and Chile. His core competencies include BRIC and G-10 equity markets, swing and position trading and technical analysis.


