Top 3 Price Prediction Bitcoin, Ethereum, Ripple: Preparing for the markets next move
- Bitcoin bounces 5% after a 10% decline over the weekend.
- Ethereum shows bulls losing underlying strength.
- XRP price consolidates into a range that could resolve in an explosive move.

The crypto market has produced a countertrend bounce after a persistent weekend decline. The two-week-long consolidation broke to the downside over the weekend, which has projected targets much lower than the current price. Key levels have been defined to determine the Top 3 crypto's next potential moves.
Bitcoin price fights back
Bitcoin price broke out to the downside after nearly two weeks of consolidating in the $17,000 range. The breakout produced a monthly low of $15,476. Now, the peer-to-peer digital currency has retaliated against the bearish onslaught as the bulls have recovered 5% of losses on Tuesday, November 22. Still, a pennant formation, which surrounded the BTC price throughout the 2-week consolidation, has projected targets between $13,500 and $14,000. Thus, the downtrend may continue.
Bitcoin price currently auctions at $16,161. The 5% hike was catalyzed by a bullish divergence reported on several altcoins during the New York session on November 21. The bulls now face significant resistance near the 8-day exponential moving average at $17,000. A retest of the barrier could provoke a much stronger sell-off.,
Invalidation of the bearish idea is a breach above the swing highs within the previous consolidation at $17,200. If the level is tagged, the bulls could produce a countertrend spike back to the 21-day simple moving average at $17,900. The Bitcoin price will rise by 10% if the invalidation scenario occurs.
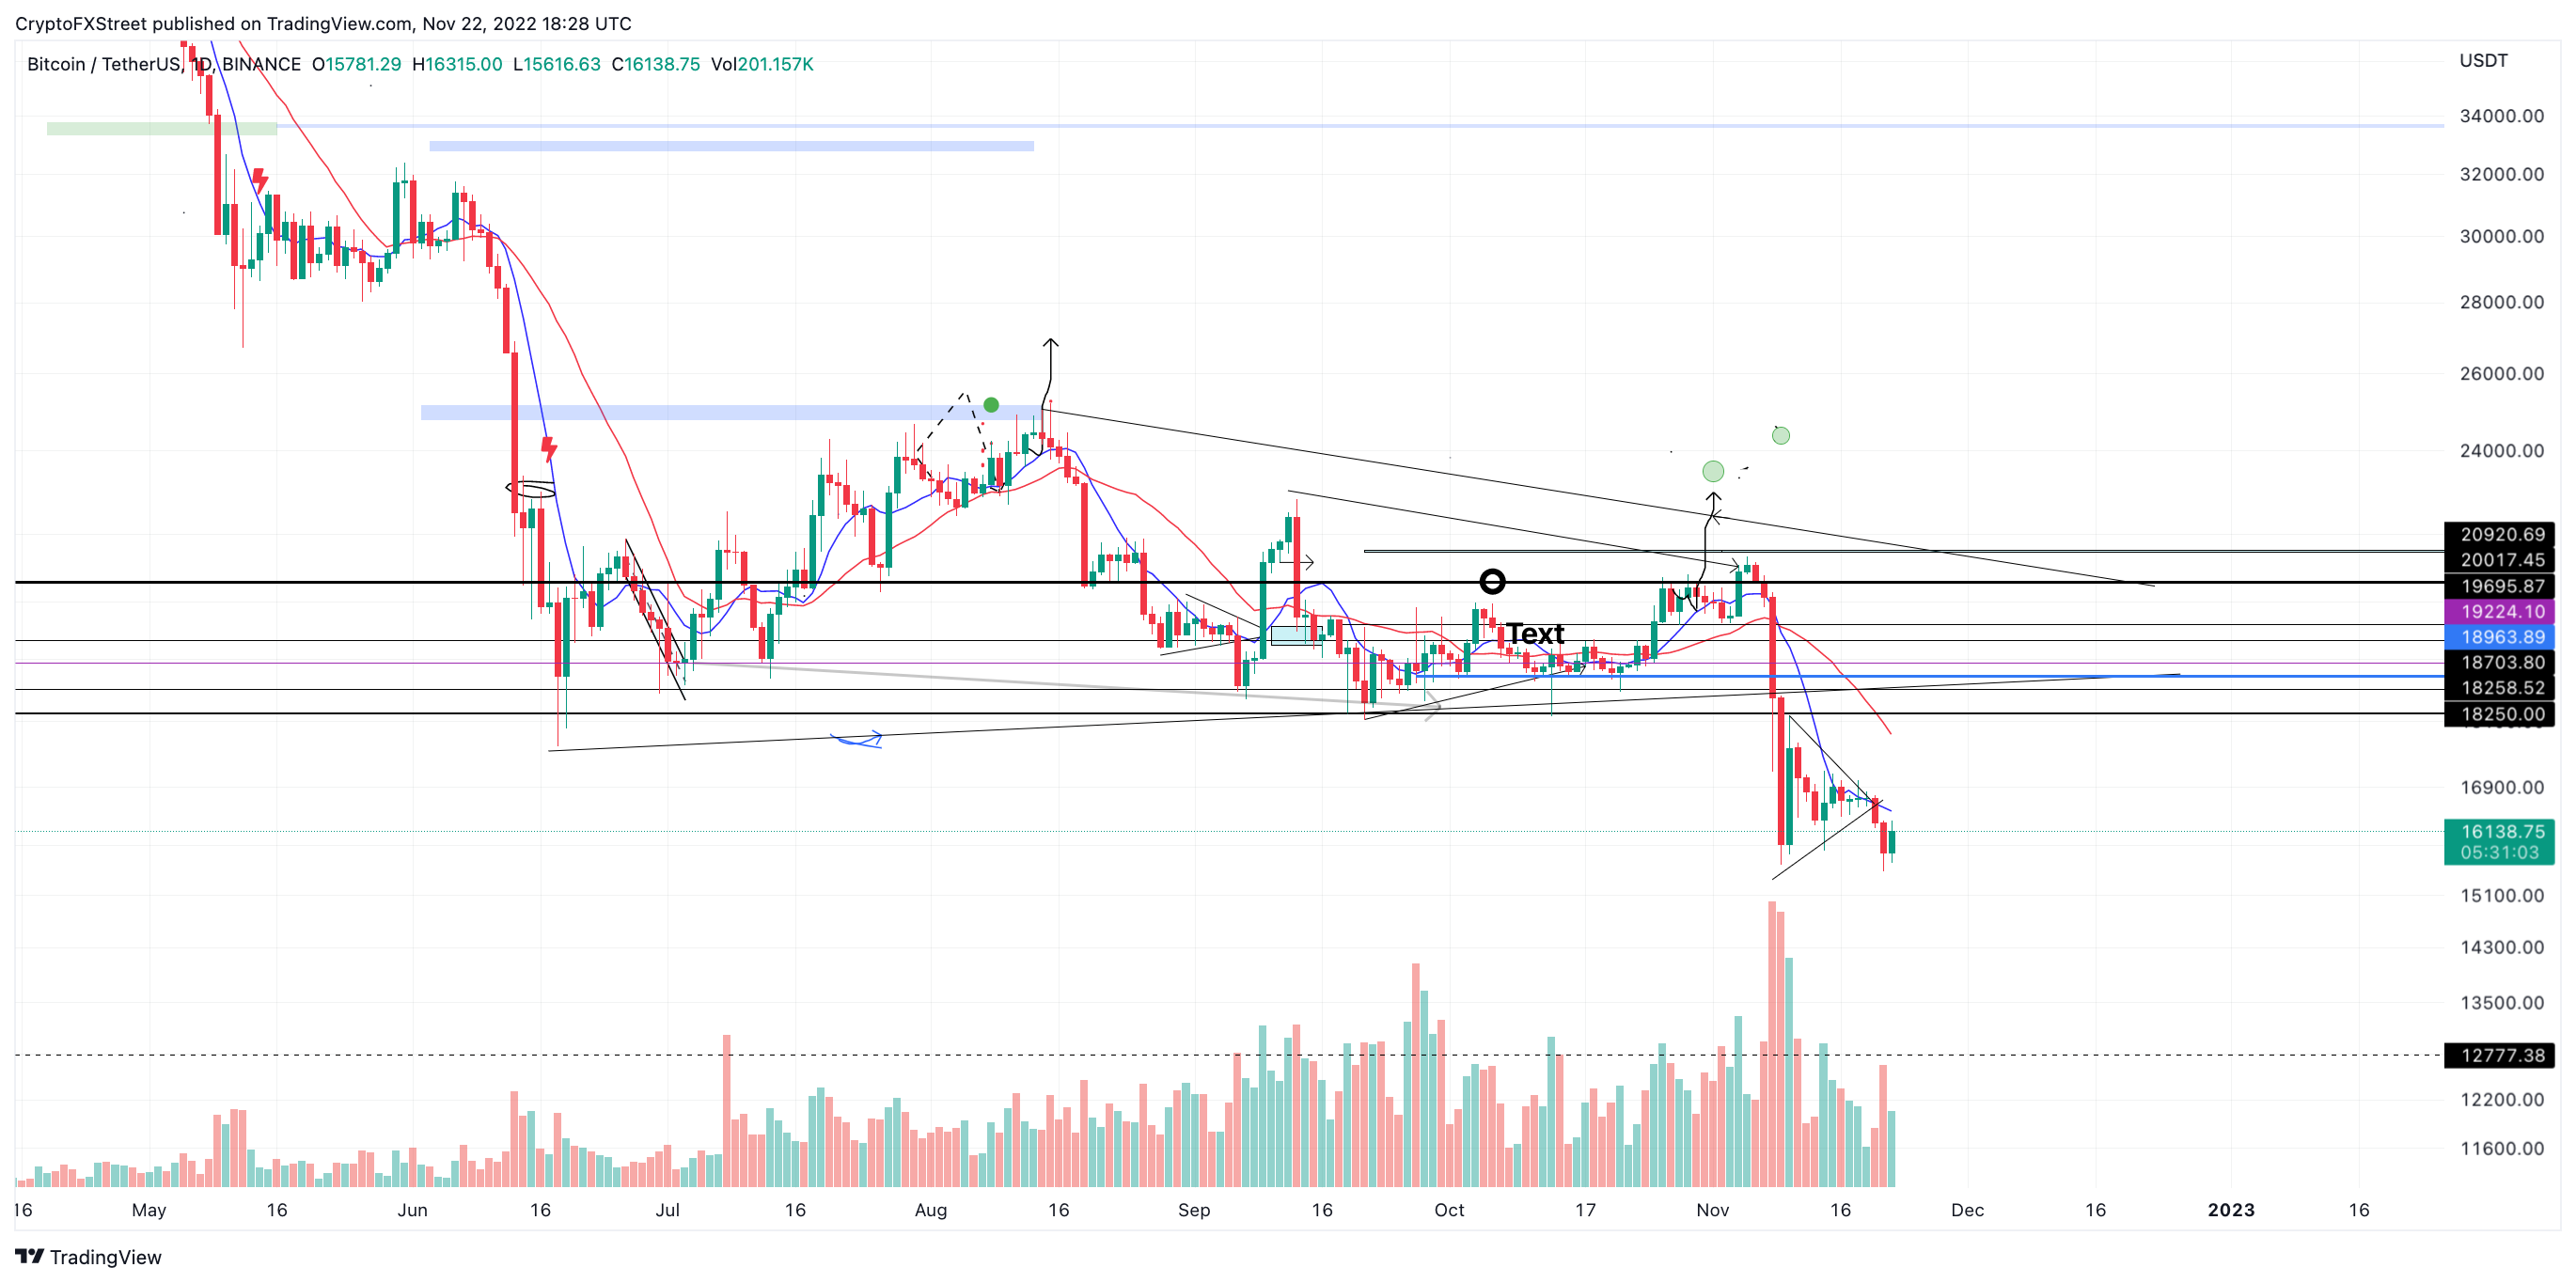
BTC/USDT 1-day chart
In the following video, our analysts deep dive into the price action of Bitcoin, analyzing key levels of interest in the market. -FXStreet Team
Ethereum price losing grounds
Ethereum price has seen better days as the bears have produced a 10% decline since the weekend. At the current time, the bulls are trying to produce a countertrend bounce, but the attempt could be exhausting their underlying strength. The Volume Profile Indicator confounds this narrative as fewer transactions have taken place in recent days compared to the previous sell-off during November that momentarily breached the $1,000 barrier. If market conditions persist, the bears could induce a definitive move to sustain Ethereum price below $1,000.
Ethereum price currently auctions at $1,119. Bears in the market will likely aim for the summer liquidity at $1,000 and potentially $939. If sidelined bulls do not step in at these zones, a free-fall decline targeting summer lows at $880 would be imminent. Invalidation of the downtrend idea would be a breach above $1,276.
On the contrary, a countertrend spike into the previous congestion zone at $1,276 would be an ideal target zone for short-term bulls. The bulls need to hurdle the 8-day exponential moving average of $1,192 to justify any bullish trade ideas.
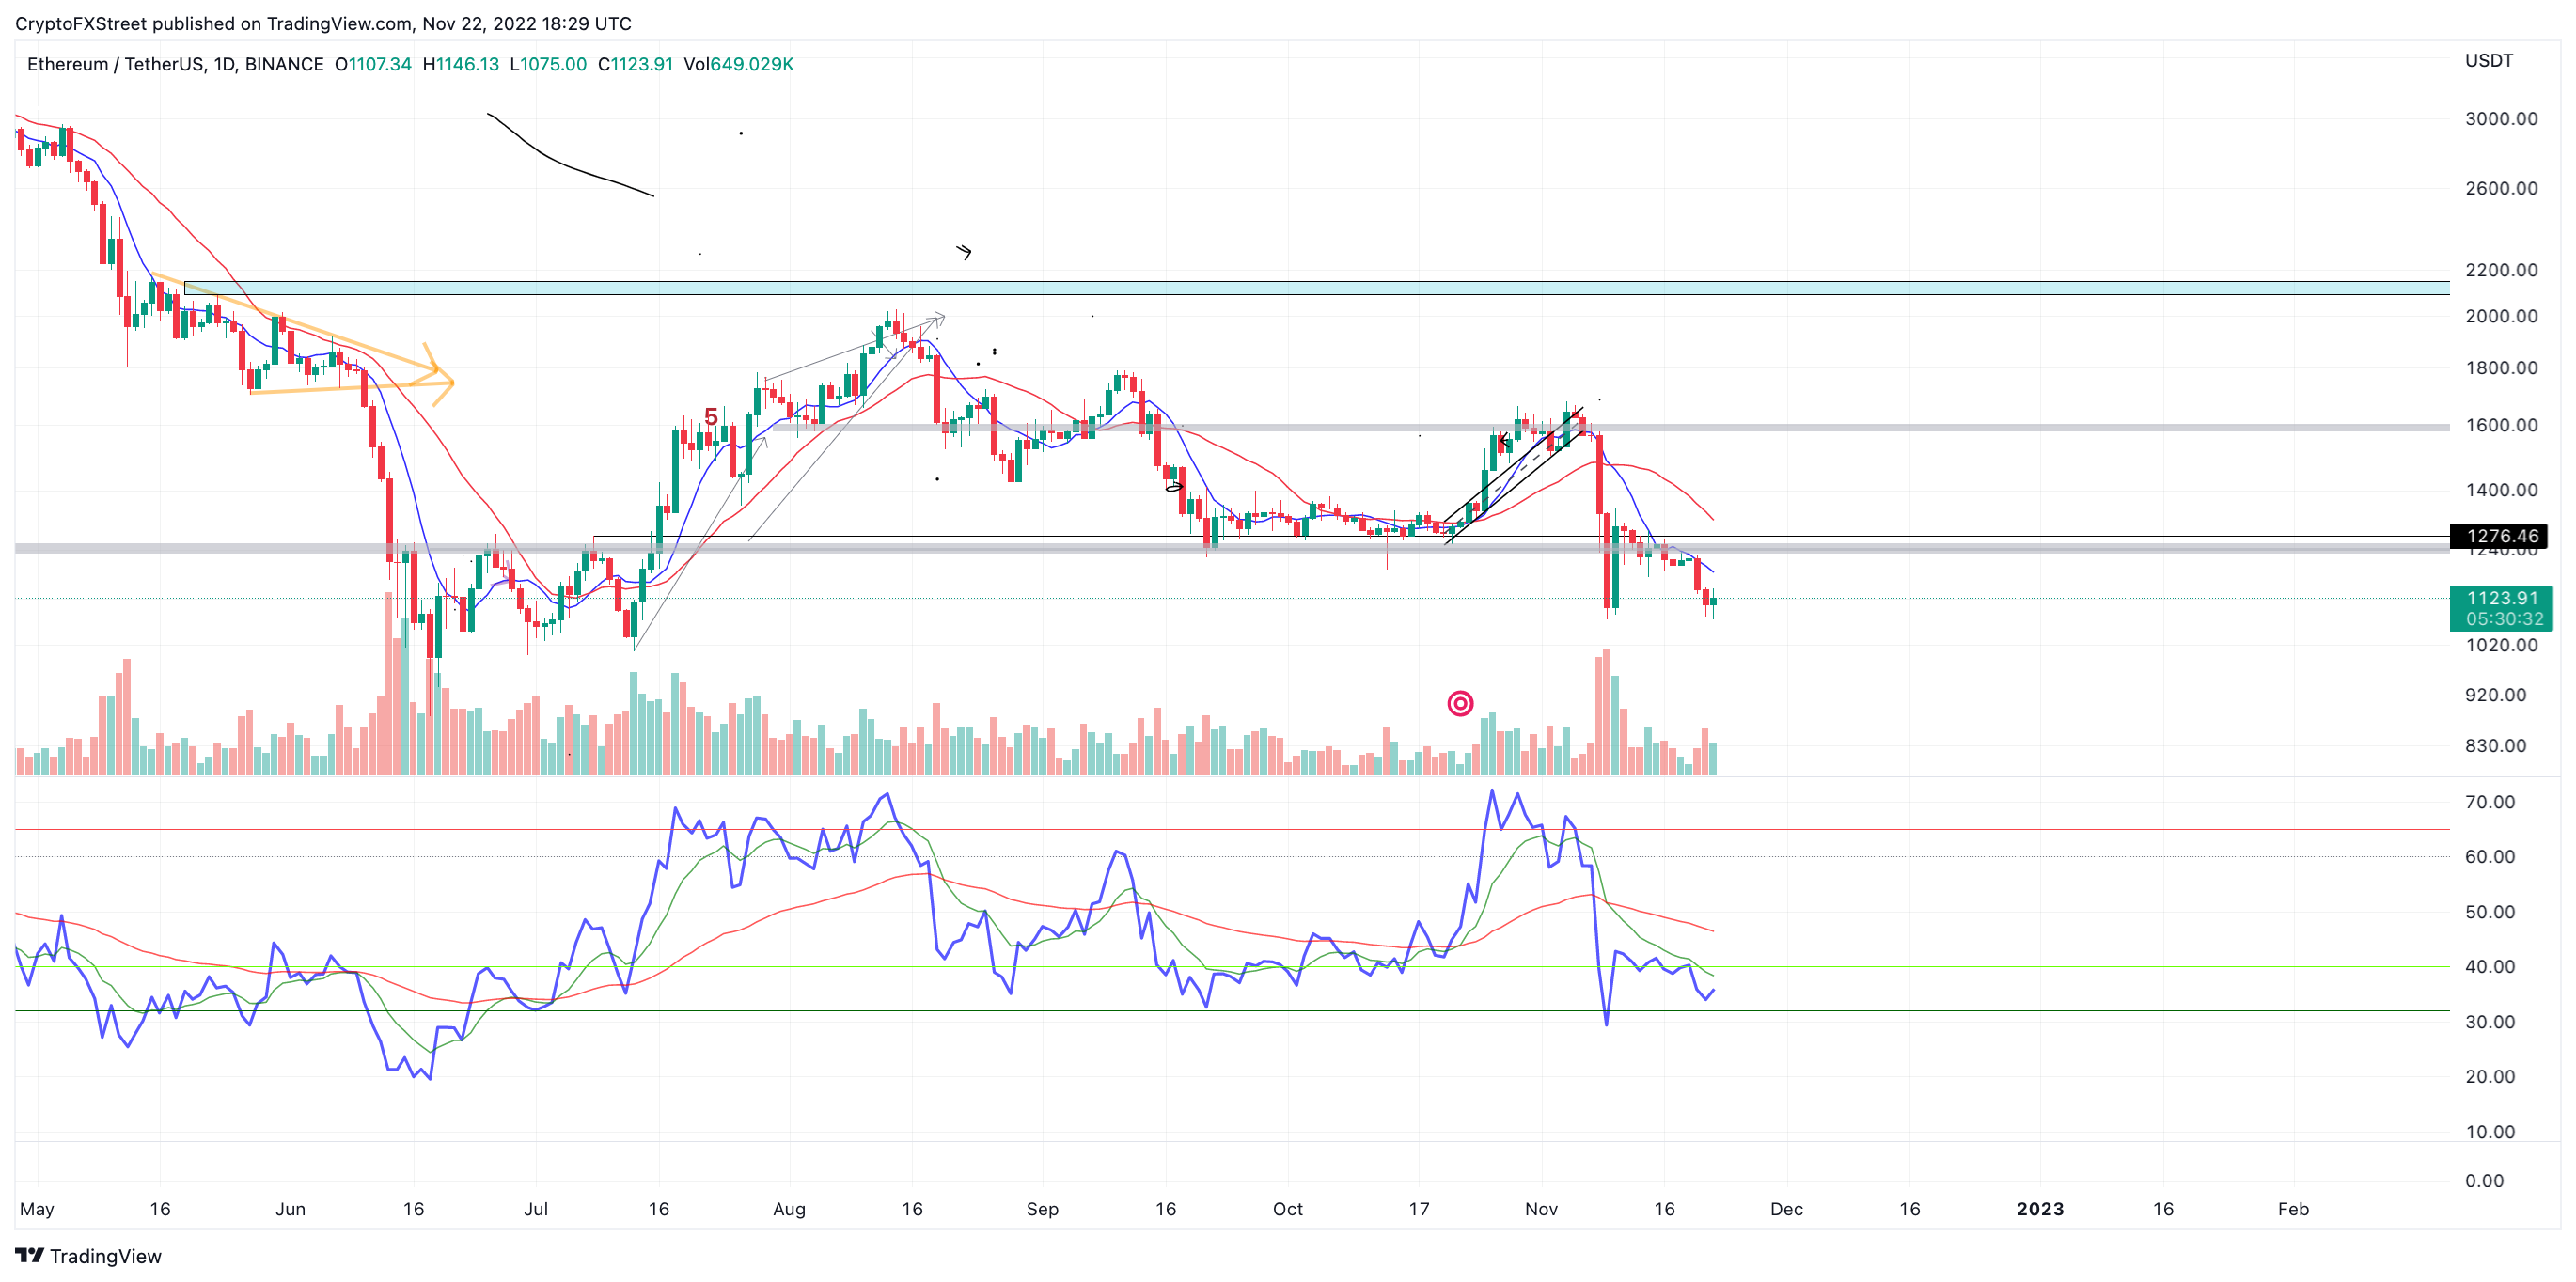
ETH/USDT 1-day chart
In the following video, our analysts dive deep into the price action of Ethereum, analyzing key market interest levels. -FXStreet Team
XRP price range bound before an explosion
XRP price has succumbed to the bearish stronghold, much like Bitcoin and Ethereum. The digital remittance token has now formed a range between $0.34 and $0.39. The technicals show lower highs and higher lows progressively throughout the month. The newfound congestion zone is likely to resolve in an explosive move. If the move is bearish, the XRP price will likely trade sub-$0.30 in 2023.
XRP currently auctions at $0.37. The bulls are attempting the first attempt to hurdle the 8-day exponential moving average (EMA) after the rejection that prompted the weekend's 10% decline. As the price ascends, sidelined bears may want to keep an eye on the Relative Strength Index (RSI). The indicator shows the current price near previous highs, which suggests a bearish divergence will soon be established and could justify traders to open a bearish position.
The bearish targets would be November's monthly low at $0.3160 and potentially the summer lows at $0.298. Invalidation of the bearish thesis is a breach above the swing high at $0.40. If the bulls can breach the barrier, a rally toward the previously broken support zone at $0.44 could occur. Such a move would result in a 20% rise from the current price.
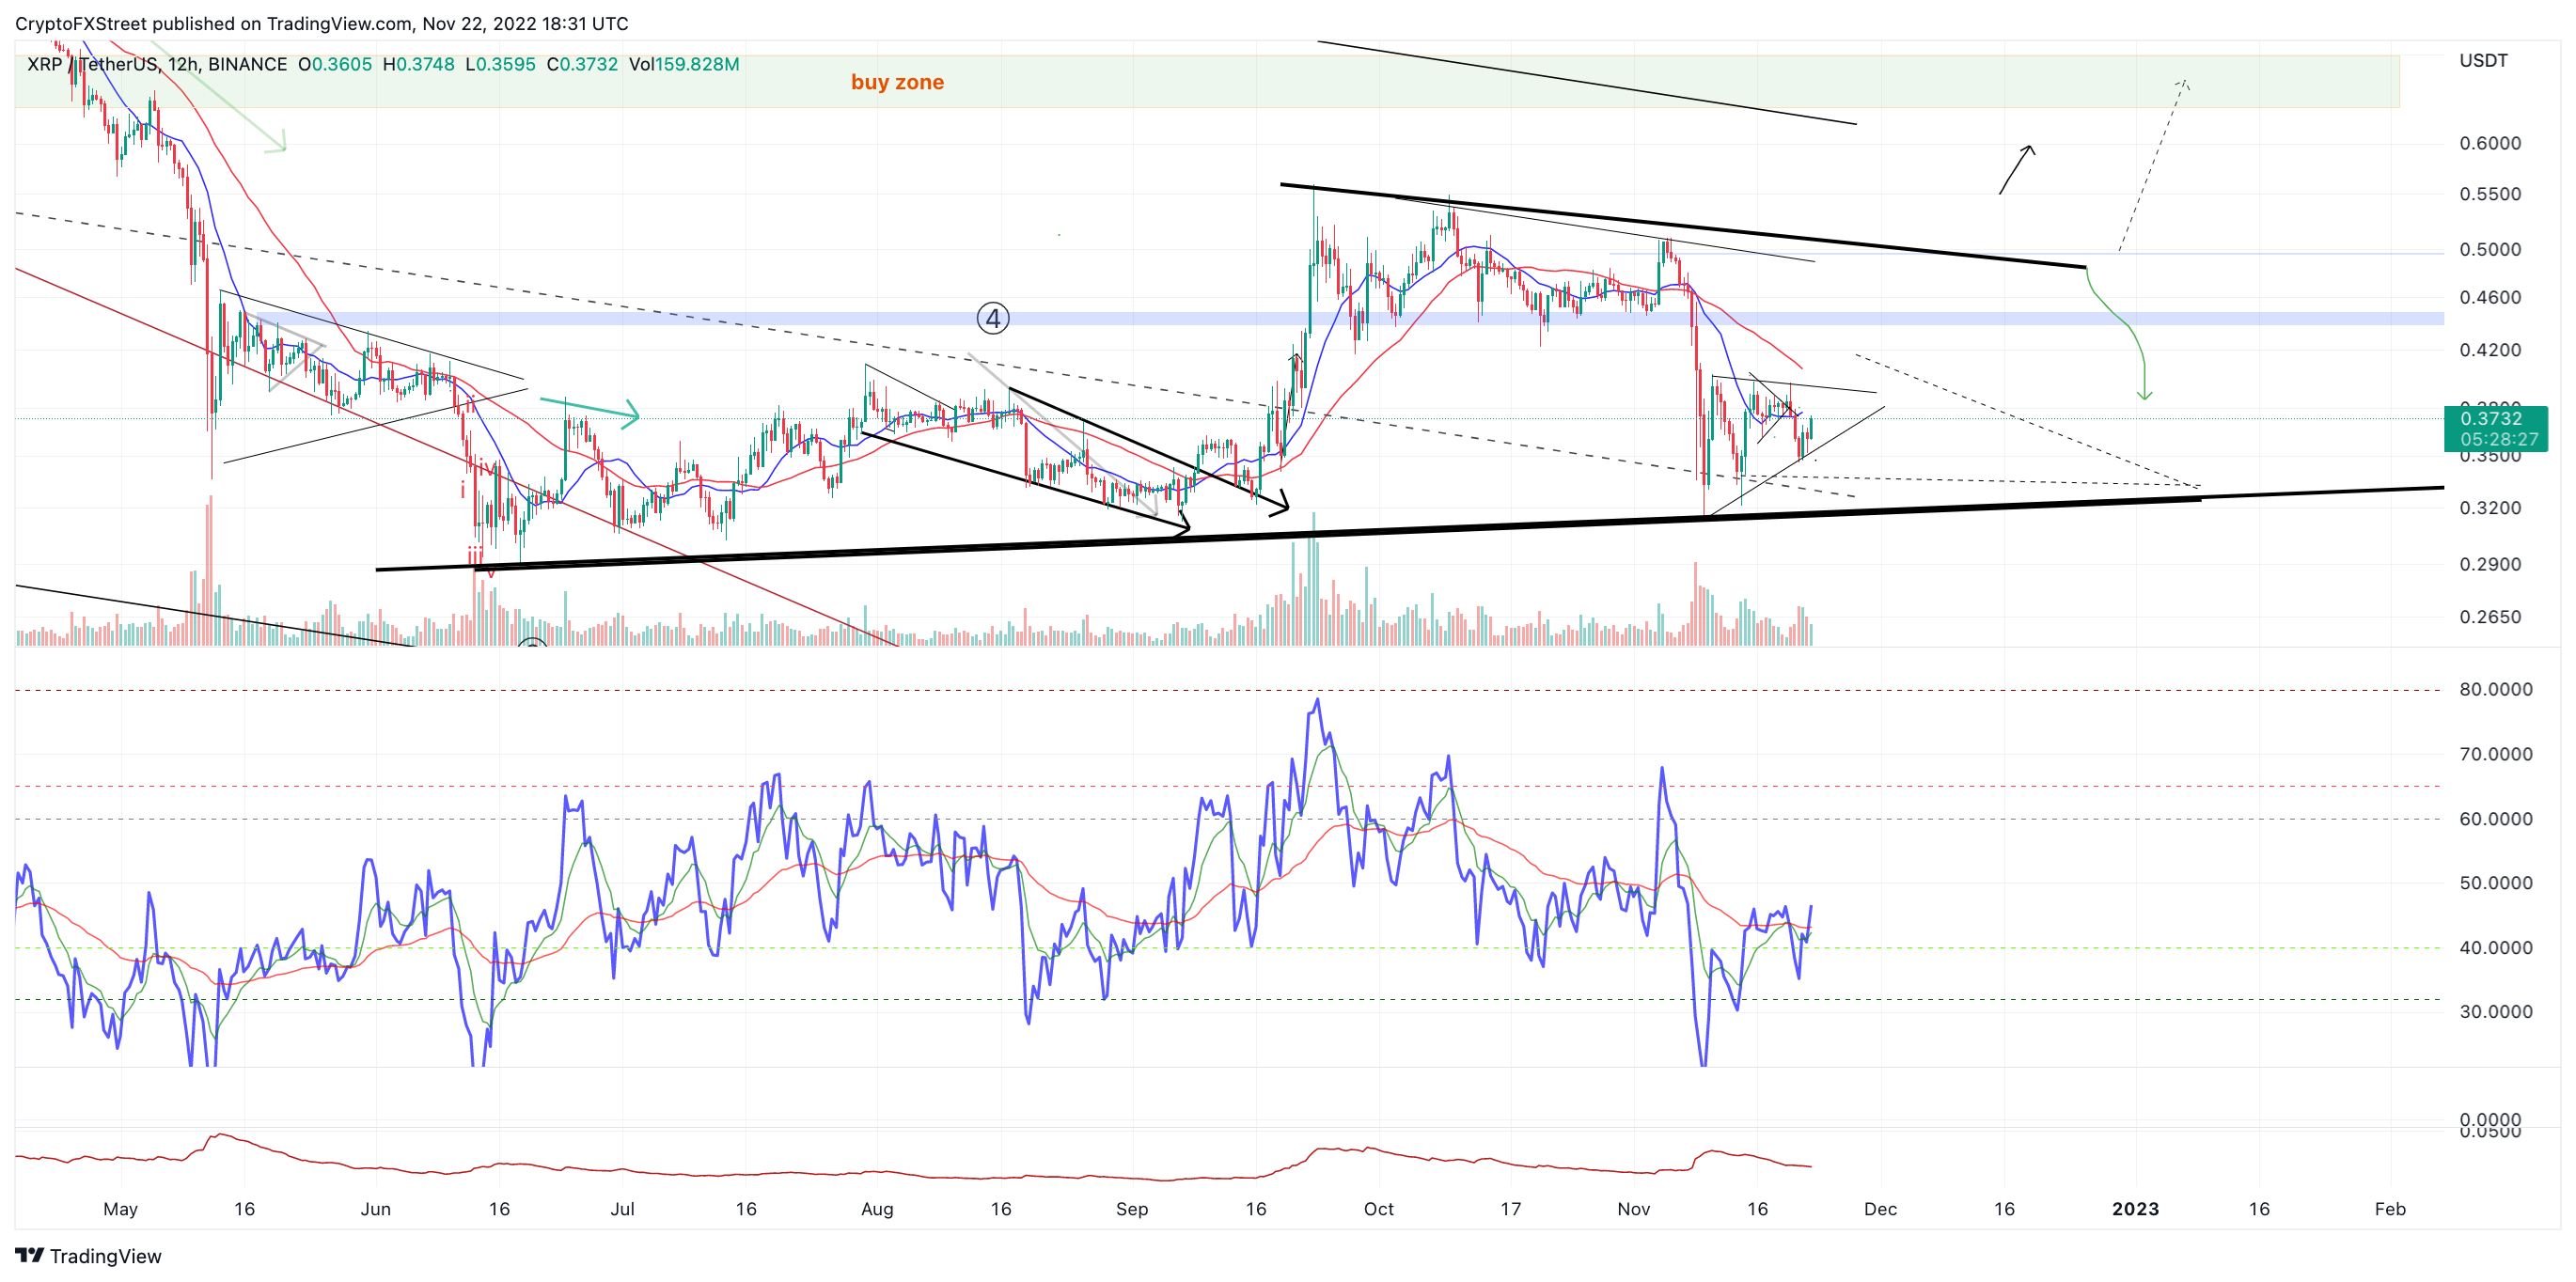
XRP/USDT 12-Hour chart
In the following video, our analysts dive deep into the price action of Ripple, analyzing key market interest levels. -FXStreet Team
Author

Tony M.
FXStreet Contributor
Tony Montpeirous began investing in cryptocurrencies in 2017. His trading style incorporates Elliot Wave, Auction Market Theory, Fibonacci and price action as the cornerstone of his technical analysis.


