Ethereum Price Prediction: RSI extreme oversold levels should provide support to ETH
- Ethereum price drops to $1,100 and triggers extreme oversold RSI levels.
- Bitcoin price has crashed 15% since breaching a shorter bear flag pattern.
- Ripple price sheds 16% as it breaks out of a bearish pennant, forecasting a $0.221 target.

UPDATE: Ethereum price prediction continues to be a high-risk activity as the second-biggest cryptocurrency continues to fall. ETH price dropped to $1,100 during the Asian trading session on Tuesday and has since bounced back to levels around $1,200 in the European session. The fast pace at which Ethereum price was dropping during the weekend and Monday on a mixture of market-wide risk-off moves and intrinsic issues tide to the problems with Celsius and the Staked Ethereum (stETH) de-peg seems to have faded a bit. In the current crypto market bloodbath, pointing at an alternative scenario is a very risky proposition, but having stated that, a bullish retracement on ETH could be due in the near term as the Relative Strength Index is at oversold levels not seen since 2019, when the main altcoin traded at $120. According to Tony Montpeirous, crypto analyst at FXStreet, ETH price would need to breach $1,570 for bulls to come back with some confidence.
GM
— Charlie (@btc_charlie) June 12, 2022
Just took a look at the $ETH chart... pic.twitter.com/l1qzWtOnR2
Bitcoin price has crashed quite a bit over the weekend, taking Ethereum, Ripple and other altcoins with it. The cause of this brutal market downswing seems to be two-fold - fears around the solvency of the Celsius Network and the CPI announcement.
Celsius is a crypto-based lender and major holder of Staked Ethereum (stETH), which is Ethereum staked on the Lido platform, which is a 1:1 backed peg of ETH. Due to sudden redemptions, the peg between stETH and ETH has started to decouple significantly.
The imbalance is now causing a bank run on Celsius Network. While this is one background factor destabilizing markets, the other is the CPI inflation (Consumer Price Index) announcement on June 10, which is triggering a crash over the weekend and causing markets to cascade.
... $stETH @ 5% discount. Liquidation domino at <0.90 pic.twitter.com/mPy33tvH0h
— Butta.eth (@Butta_eth) June 10, 2022
Earlier today, Celsius Network announced that it will be pausing all withdrawals, swaps, and transfers between accounts. This announcement has caused many to speculate about what this might really mean for Celsius.
Cobie, the host of the UpOnly podcast tweeted,
I guess now you have to hope that they’re not bankrupt but they just put too much of customer funds into illiquid/locked places — eg on beacon chain
— Cobie (@cobie) June 13, 2022
Then maybe they can wait it out and pay users back
But if they lost everything then gg I guess
Bitcoin price manifests the worst
Bitcoin price has crashed 17% since June 10 after opening at $30,0082. This downswing has pushed BTC to breach the smaller bear flag pattern, which forecasts a 30% crash to $20,560. Interestingly, the same chart also shows that the larger bear flag projects a similar target of $20,002.
While the crash seems to have paused, investors need to be cautious as a continuation could plummet BTC lower.
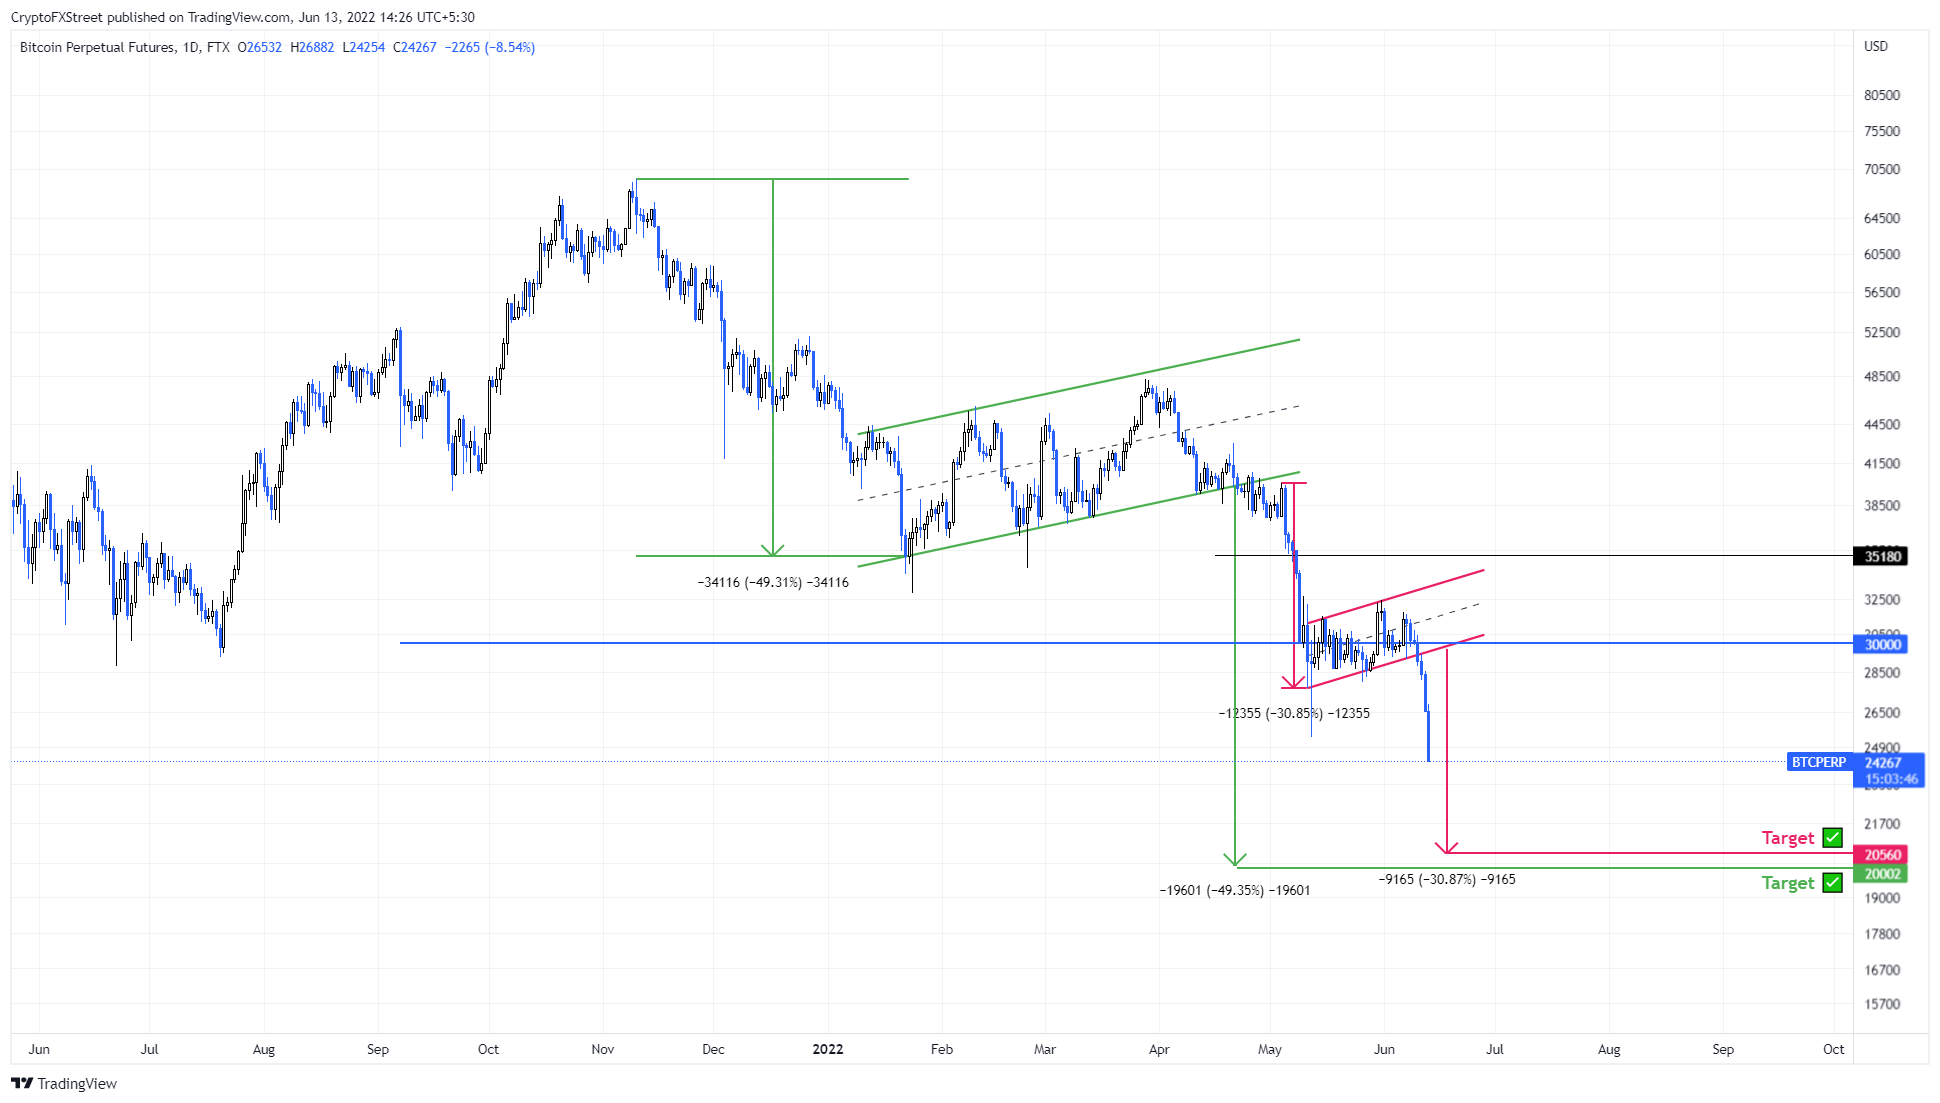
BTC/USD 1-day chart
Although unlikely, if Bitcoin price produces a daily candlestick close above the $52,000 level, it will create a higher high from a macro perspective and invalidate the bearish thesis. In such a case, Bitcoin price could climb higher to $60,000.
Ethereum price reaches its target
Ethereum price set a bear flag in late April and breached the lower trend line on May 4. Since then, ETH has crashed 52% to reach the forecasted target at $1,305. As the altcoin trades around this level, investors need to be patient with buying the dip or opening long positions.
This crash has breached the $1,401 weekly support level and flipped it into a resistance barrier. A continuation of the downtrend that breaks down the $1,305 level could trigger a 20% nosedive to the immediate foothold present at $1,050.
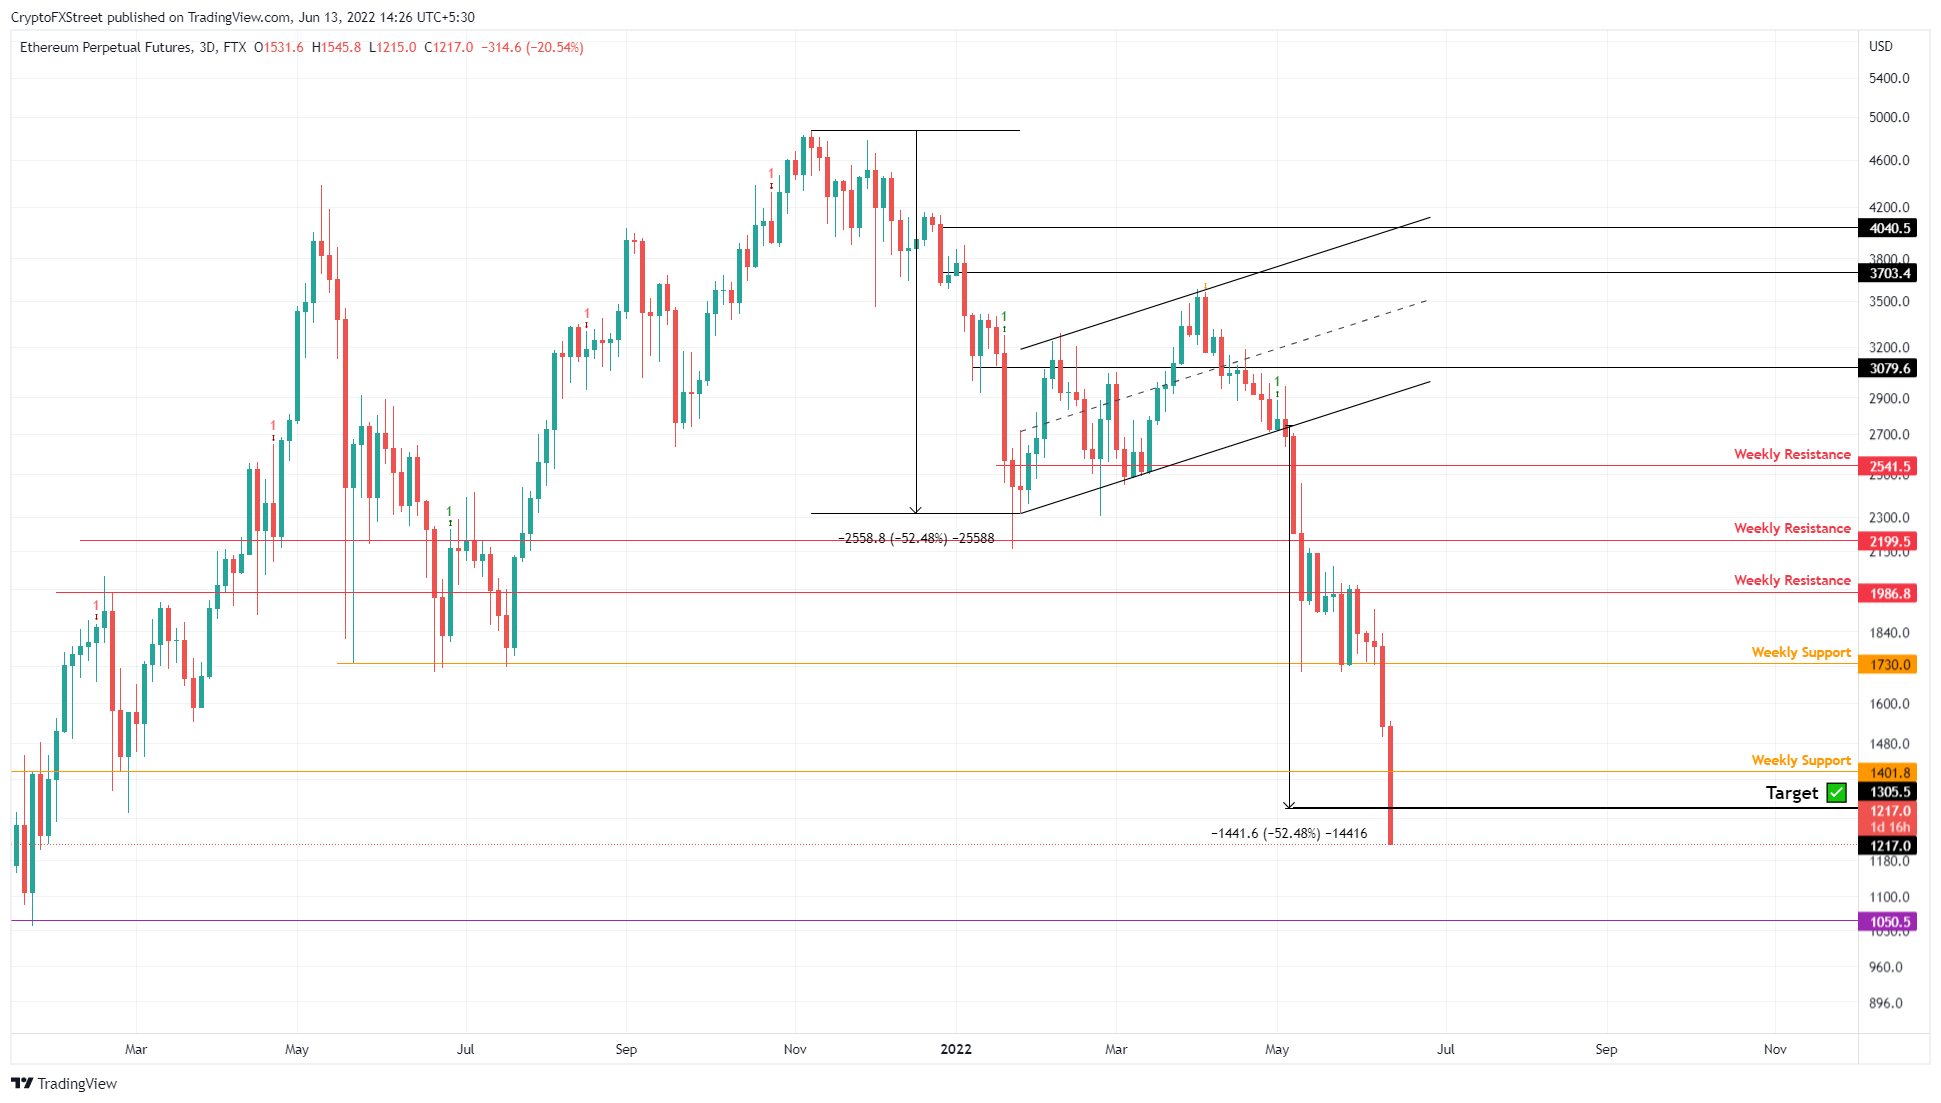
ETH/USD 1-day chart
If buyers step in and purchase ETH at a discounted price, however, there is a chance for recovery. A quick flip of the $1,401 hurdle into a support level will indicate a resurgence of bullish momentum. This development could see Ethereum price attempt a rally to $1,730.
Ripple price has a long way to go
Ripple price breached a bearish pennant, another bearish continuation pattern on June 10. This development caused the XRP price to crash 16% in the three subsequent daily candlesticks. As the remittance token trades at $0.325, the risk of a further crash lingers.
This technical formation forecasts a 42% crash to $0.221, and considering the current position, Ripple price could see a 32% drop. However, this move will not be a sudden crash due to the $0.250 and $0.302 support levels.
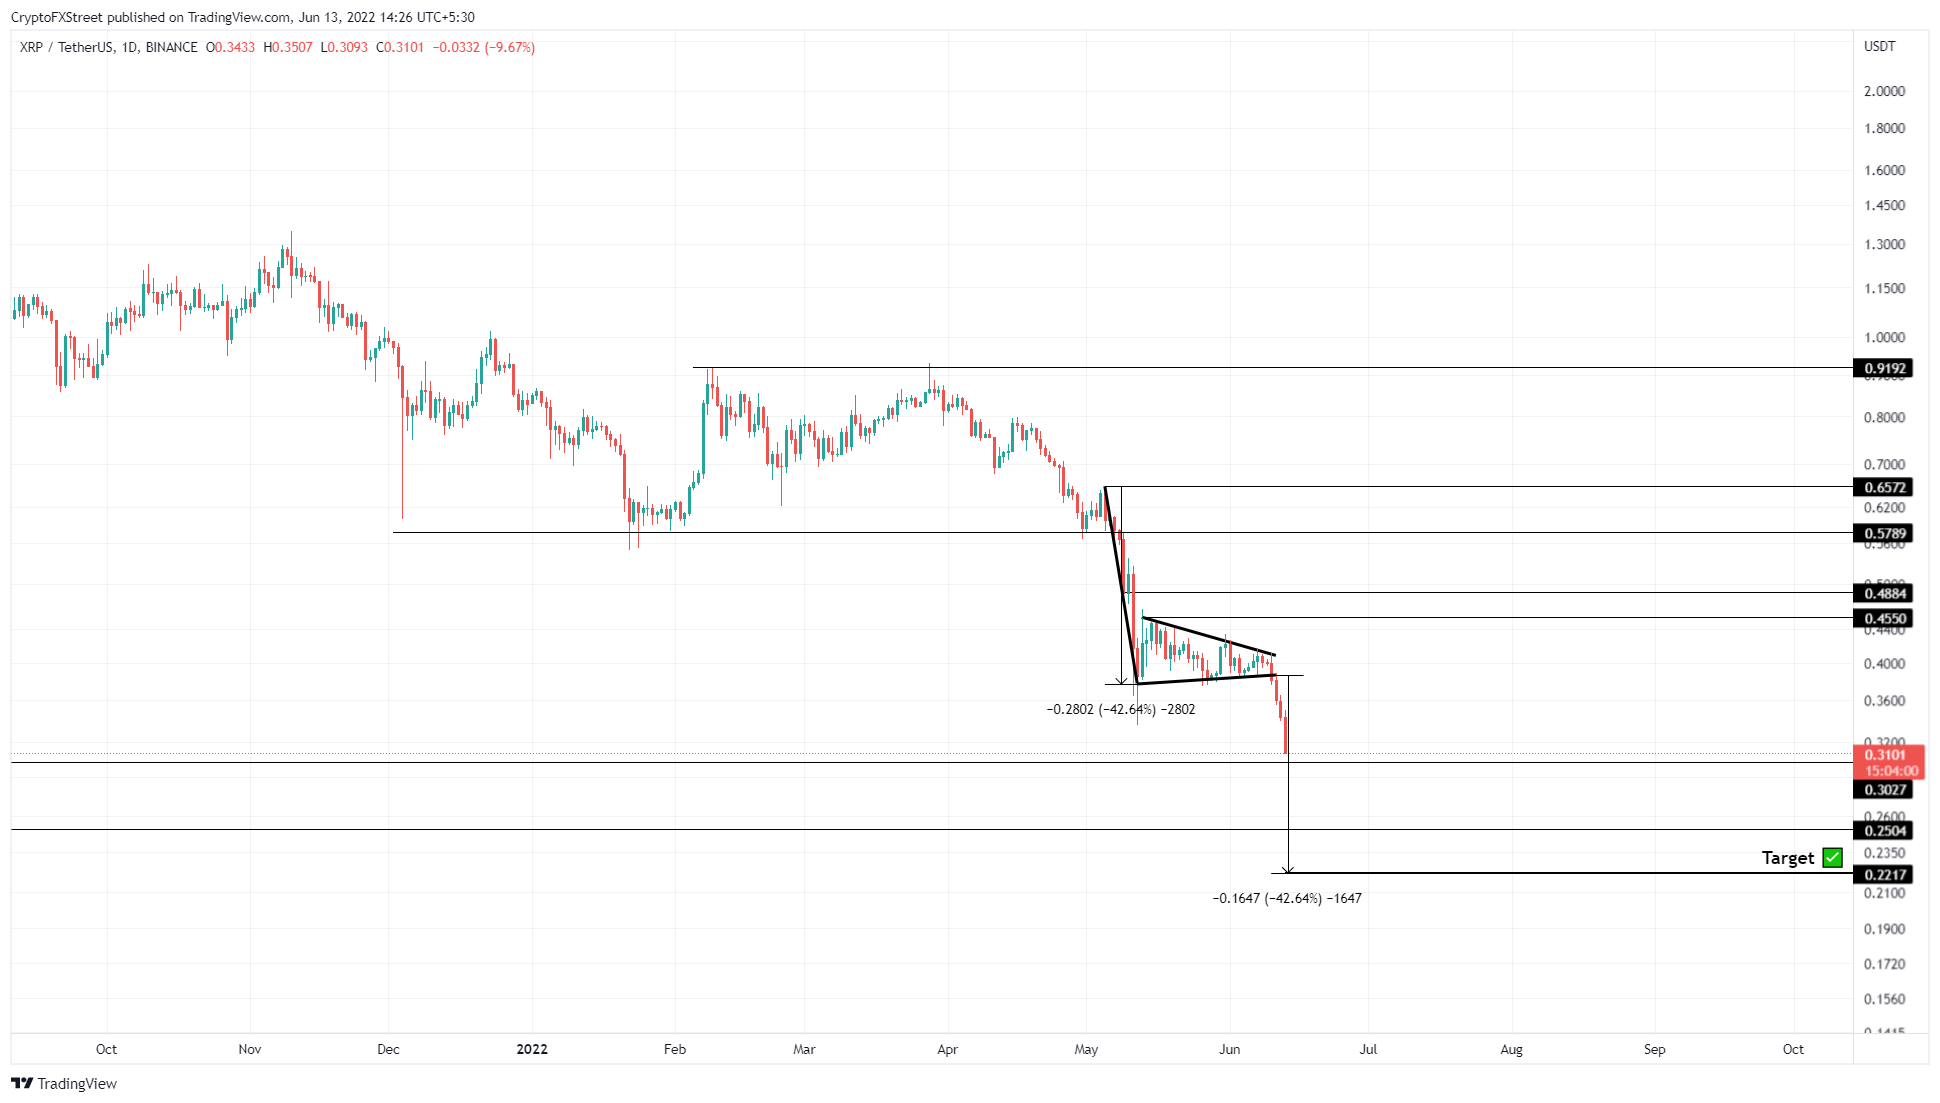
XRP/USD 1-day chart
While things are looking relatively less bearish for Ripple price, a recovery above $0.578 will be necessary for bulls to breathe a sigh of relief. A daily candlestick close above $0.657 will invalidate the bearish thesis by creating a higher high.
Author

Akash Girimath
FXStreet
Akash Girimath is a Mechanical Engineer interested in the chaos of the financial markets. Trying to make sense of this convoluted yet fascinating space, he switched his engineering job to become a crypto reporter and analyst.


