- Bitcoin price has dipped into the weekly FVG, indicating that a short-term bottom might be near.
- Ethereum price approaches a reversal level after a 17% crash in four weeks.
- Ripple price is also waiting on BTC’s consent for a rebound rally.
Bitcoin (BTC) price shows a lack of buying participants after crashing nearly 17% over four weeks. Due to the dearth of bullish momentum, there seems to be no recovery rally in sight. However, there seems to be a slow yet steady plan for a bounce, which if confirmed, could trigger a mini-rally for altcoins, including Ethereum (ETH) and Ripple (XRP) as well.
Bitcoin price is close to initiating a recovery
Bitcoin (BTC) price entered the weekly Bearish Breaker, extending from $29,247 to $41,273, which triggered a spike in selling pressure. As a result, BTC slid 16.50% between April 10 and May 8 into the weekly Fair Value Gap (FVG), which extends from $22,591 to $26,591.
For more details on Breakers and FVG, read this: Where will the 2023 crypto bull rally top? – ICT
While the bullish outlook for Bitcoin price has not become apparent yet, there are signs that traders can look for to spot an early trend reversal. The Relative Strength Index (RSI) could slide a little lower to bounce off the mean level. The Awesome Oscillator (AO) shows a decline in bullish momentum but is very close to seeing a reset at the zero-line.
With this momentum reset in mind, investors should pay attention to the $25,205 and $24,300 support levels to accumulate BTC. A clear outlook in momentum shift can be observed on the daily chart. In the likely case that buyers make a comeback, Bitcoin price will eye a retest of the bearish breaker’s midpoint at $35,260.
In total, this move would constitute a 40% to 45% gain for investors based on their accumulation levels.
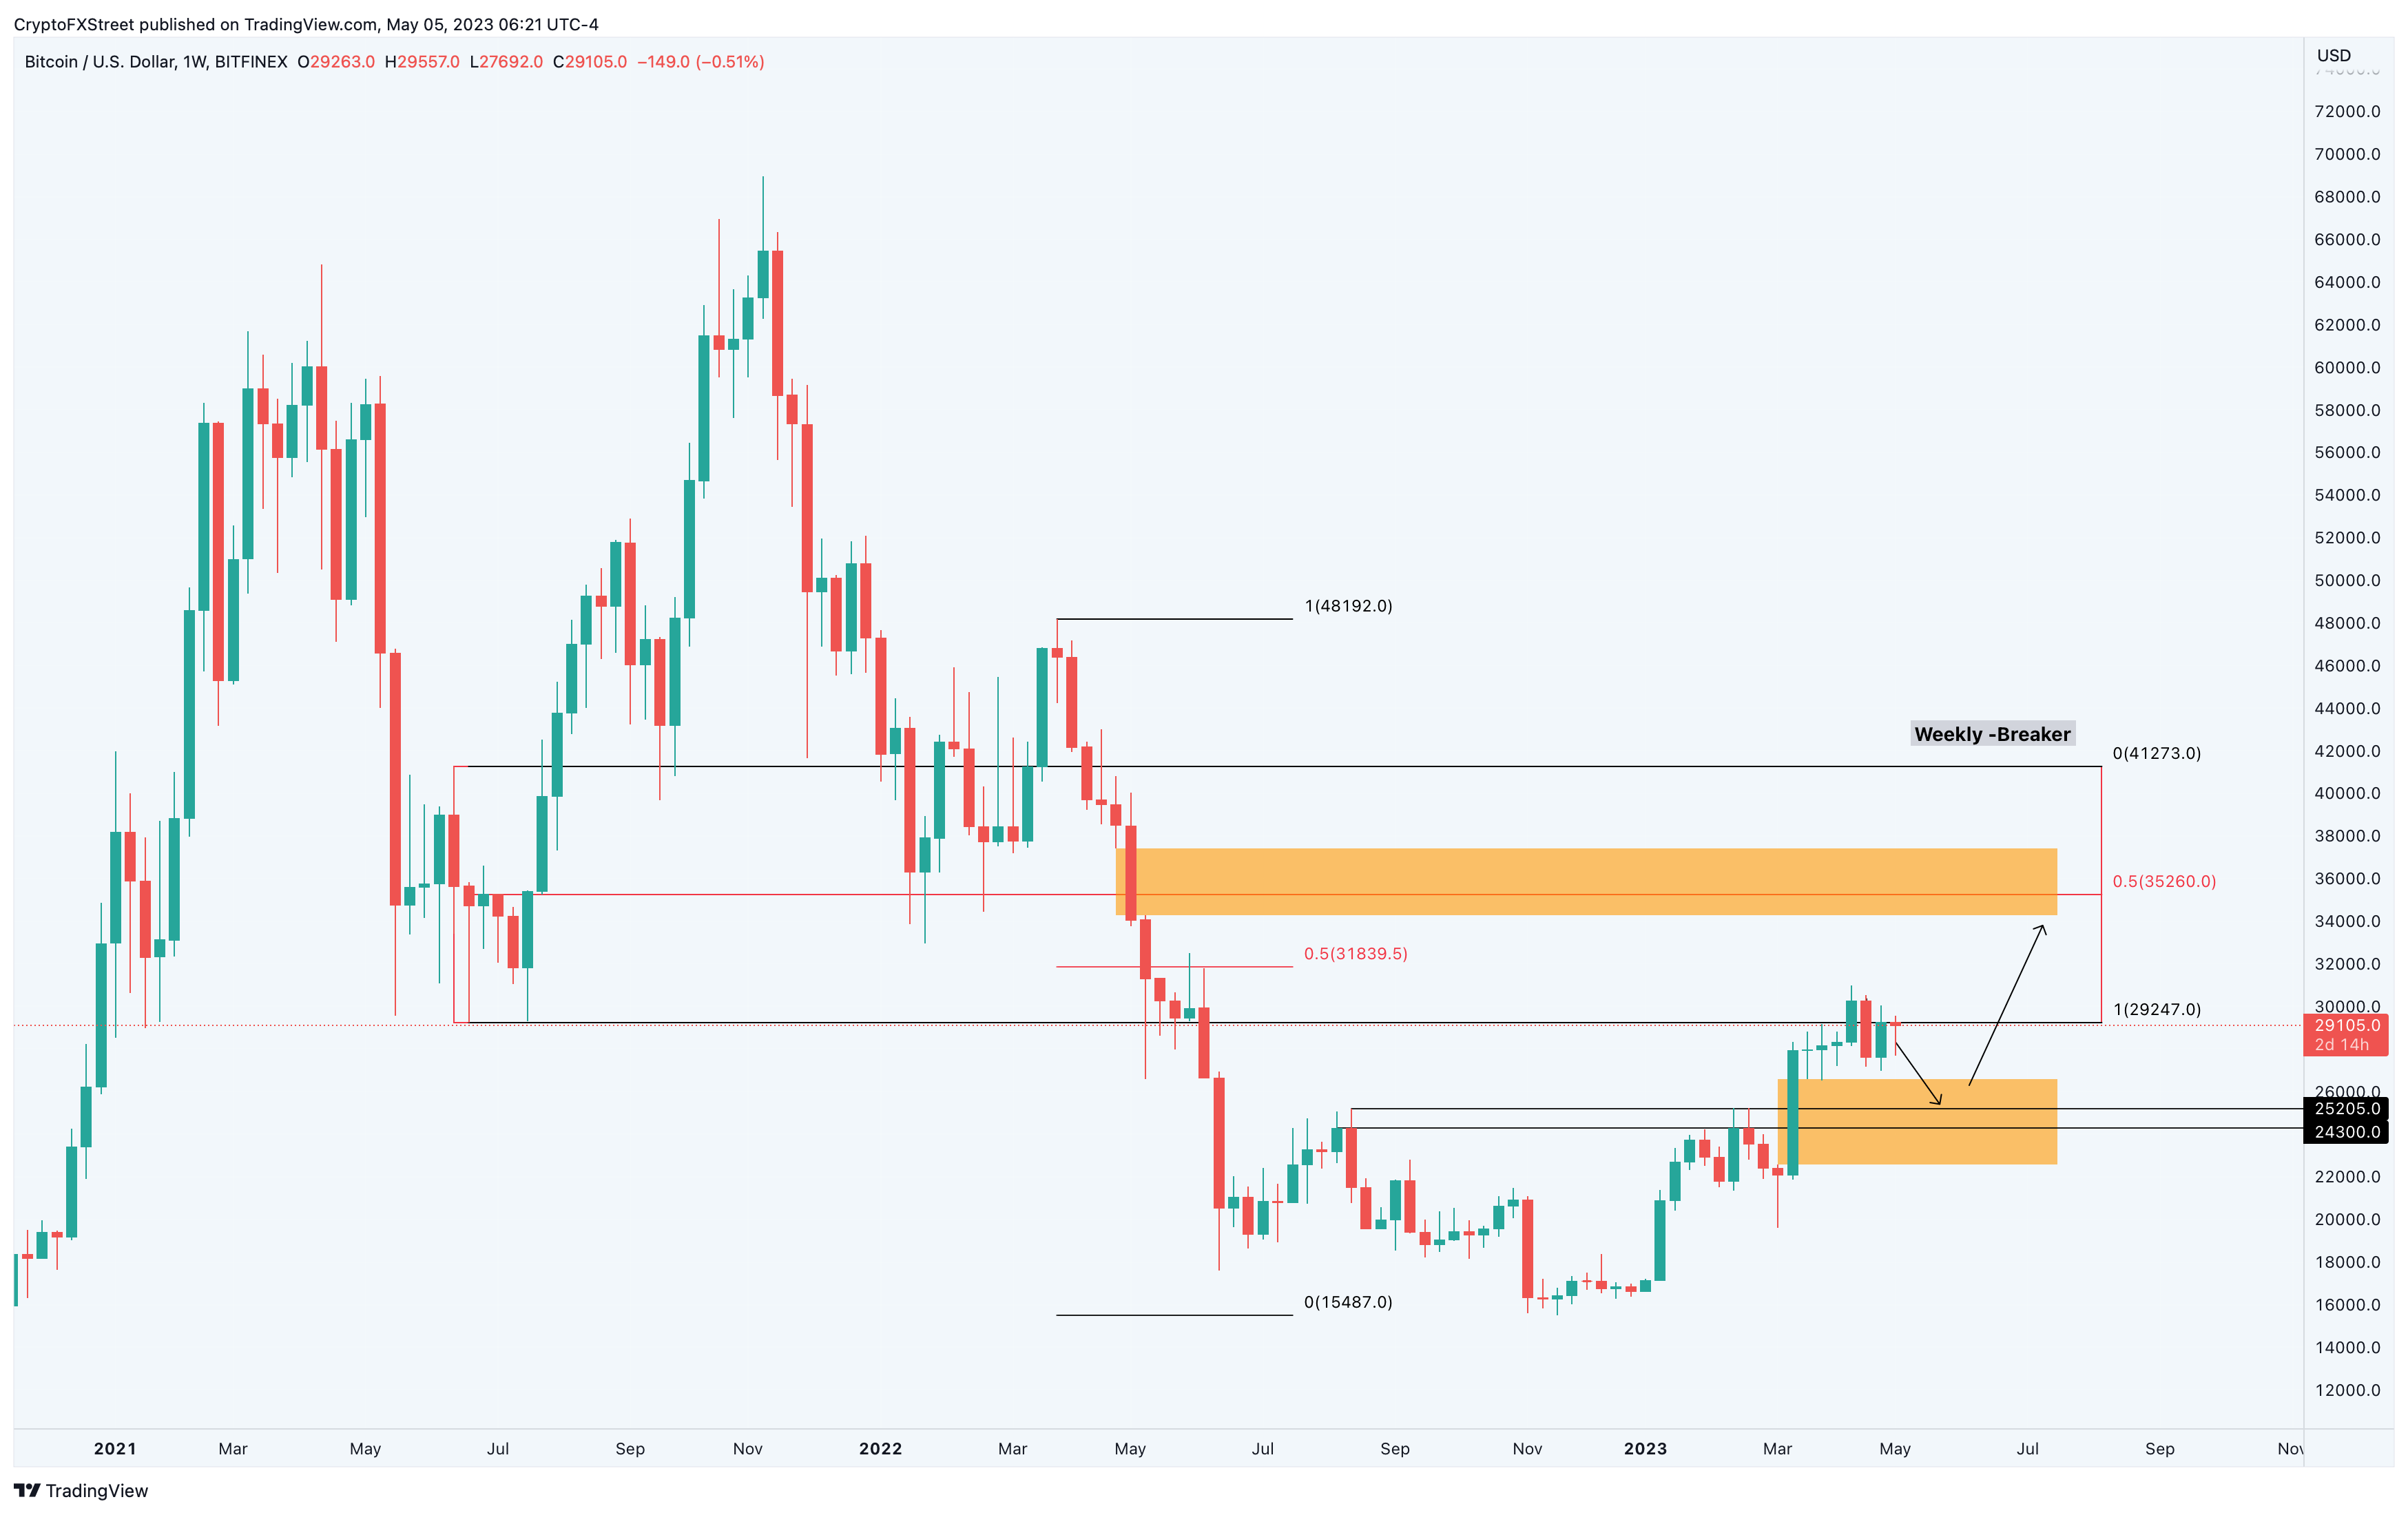
BTC/USD 1-week chart
Investors should note that the bullish outlook detailed above needs to be spotted and then confirmed. However, if neither of the above is noted, Bitcoin price could continue to plummet. In such a case, BTC might find support at $17,605, which is the selling climax of the June 13 weekly candlestick.
Ethereum price recovery awaits BTC’s signal
Ethereum (ETH) price set up a prolonged bearish divergence sell signal on the daily chart between January 14 to May 13. This setup resulted in a 17% crash in four weeks that pushed ETH to $1,735.
Although Ethereum price failed to retest the $1,705 support level, it slipped below the $1,817 structure. While a recovery seems to be already in place, investors need to wait for Bitcoin to show its hand before jumping on altcoins like ETH.
Investors can look at the $1,705 support level for accumulation, but in a dire case, a dip into the daily FVG, extending from $1,478 to $1,563, seems plausible. If Bitcoin price kick-starts its recovery, Ethereum price might also eye a recovery rally and a retest of $2,028.
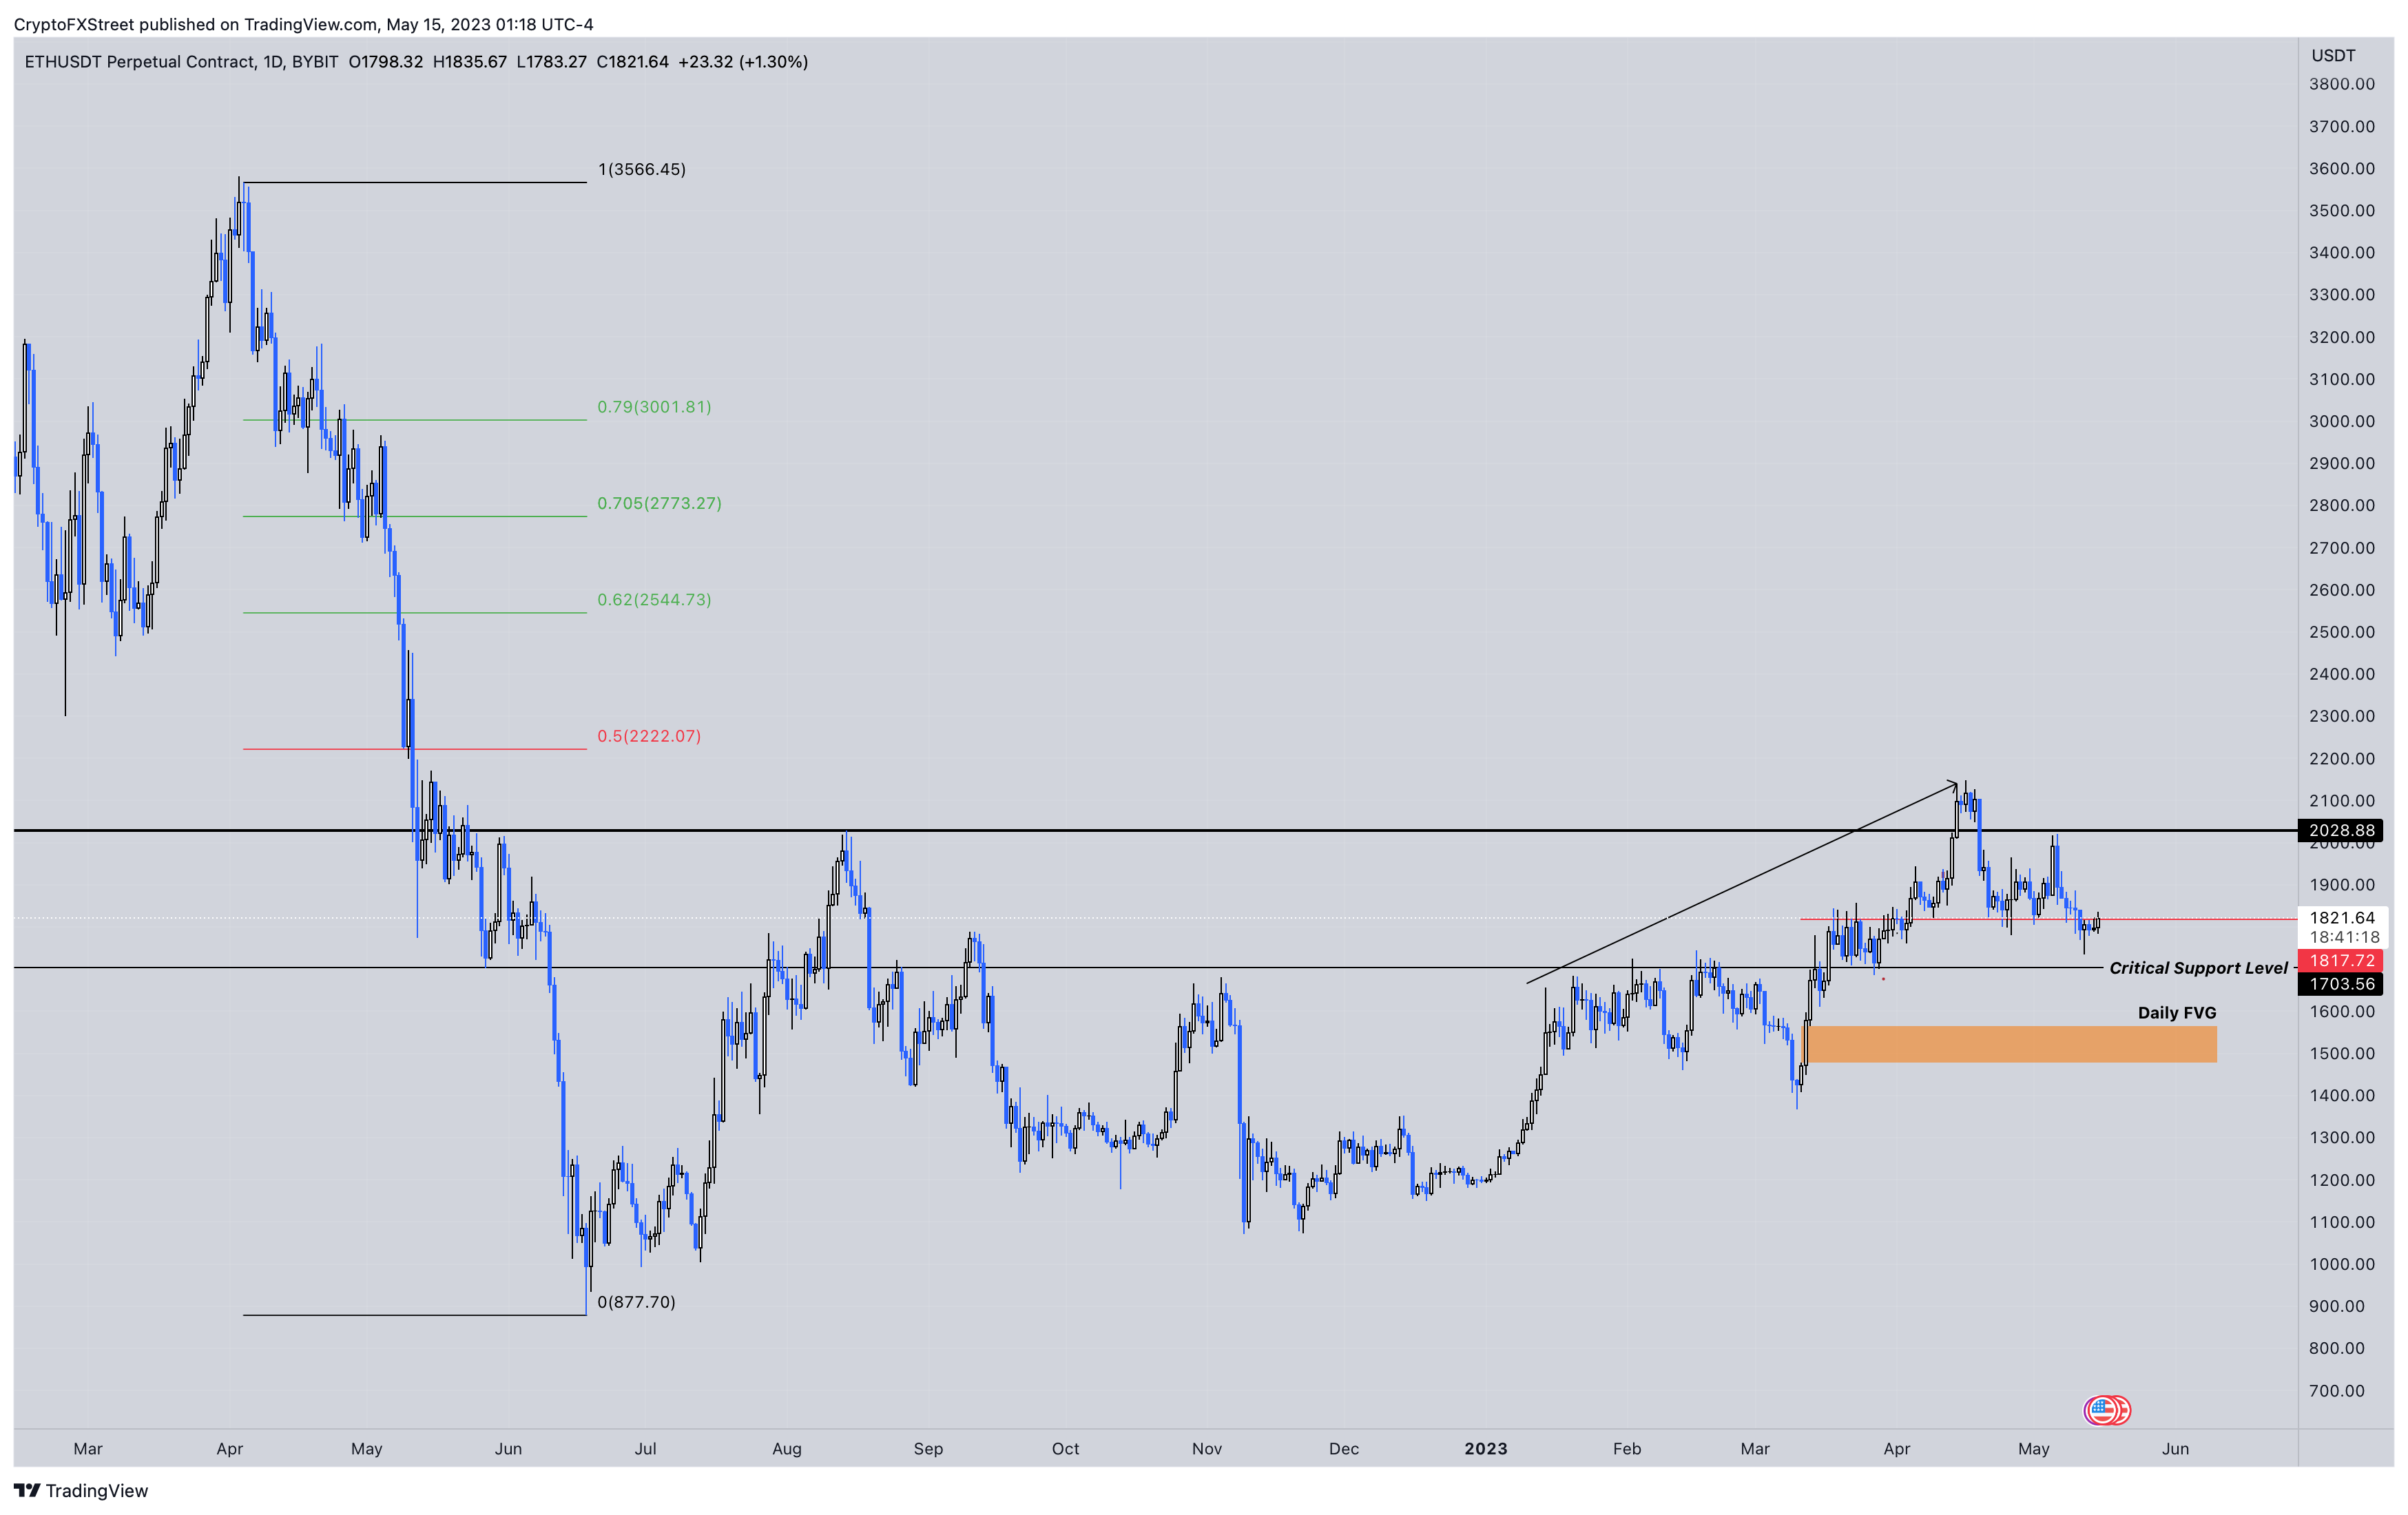
ETH/USD 1-day chart
A daily candlestick close below $1,478 will invalidate the FVG and the bullish thesis for Ethereum price. In such a case, ETH could slide down to $1,249.
Ripple price fails again
Ripple price has been trying to overcome the $0.532 resistance level for nearly a year. The recent retests on March 29 and April 19 were the latest failed attempts. As a result, XRP price has slid 20% and is currently trading at $0.422.
A bounce off this stable support level is likely to trigger a rally in Ripple price. The targets of this recovery rally include $0.609 and $0.765, provided the remittance token can flip the $0.532 resistance level into a support level.
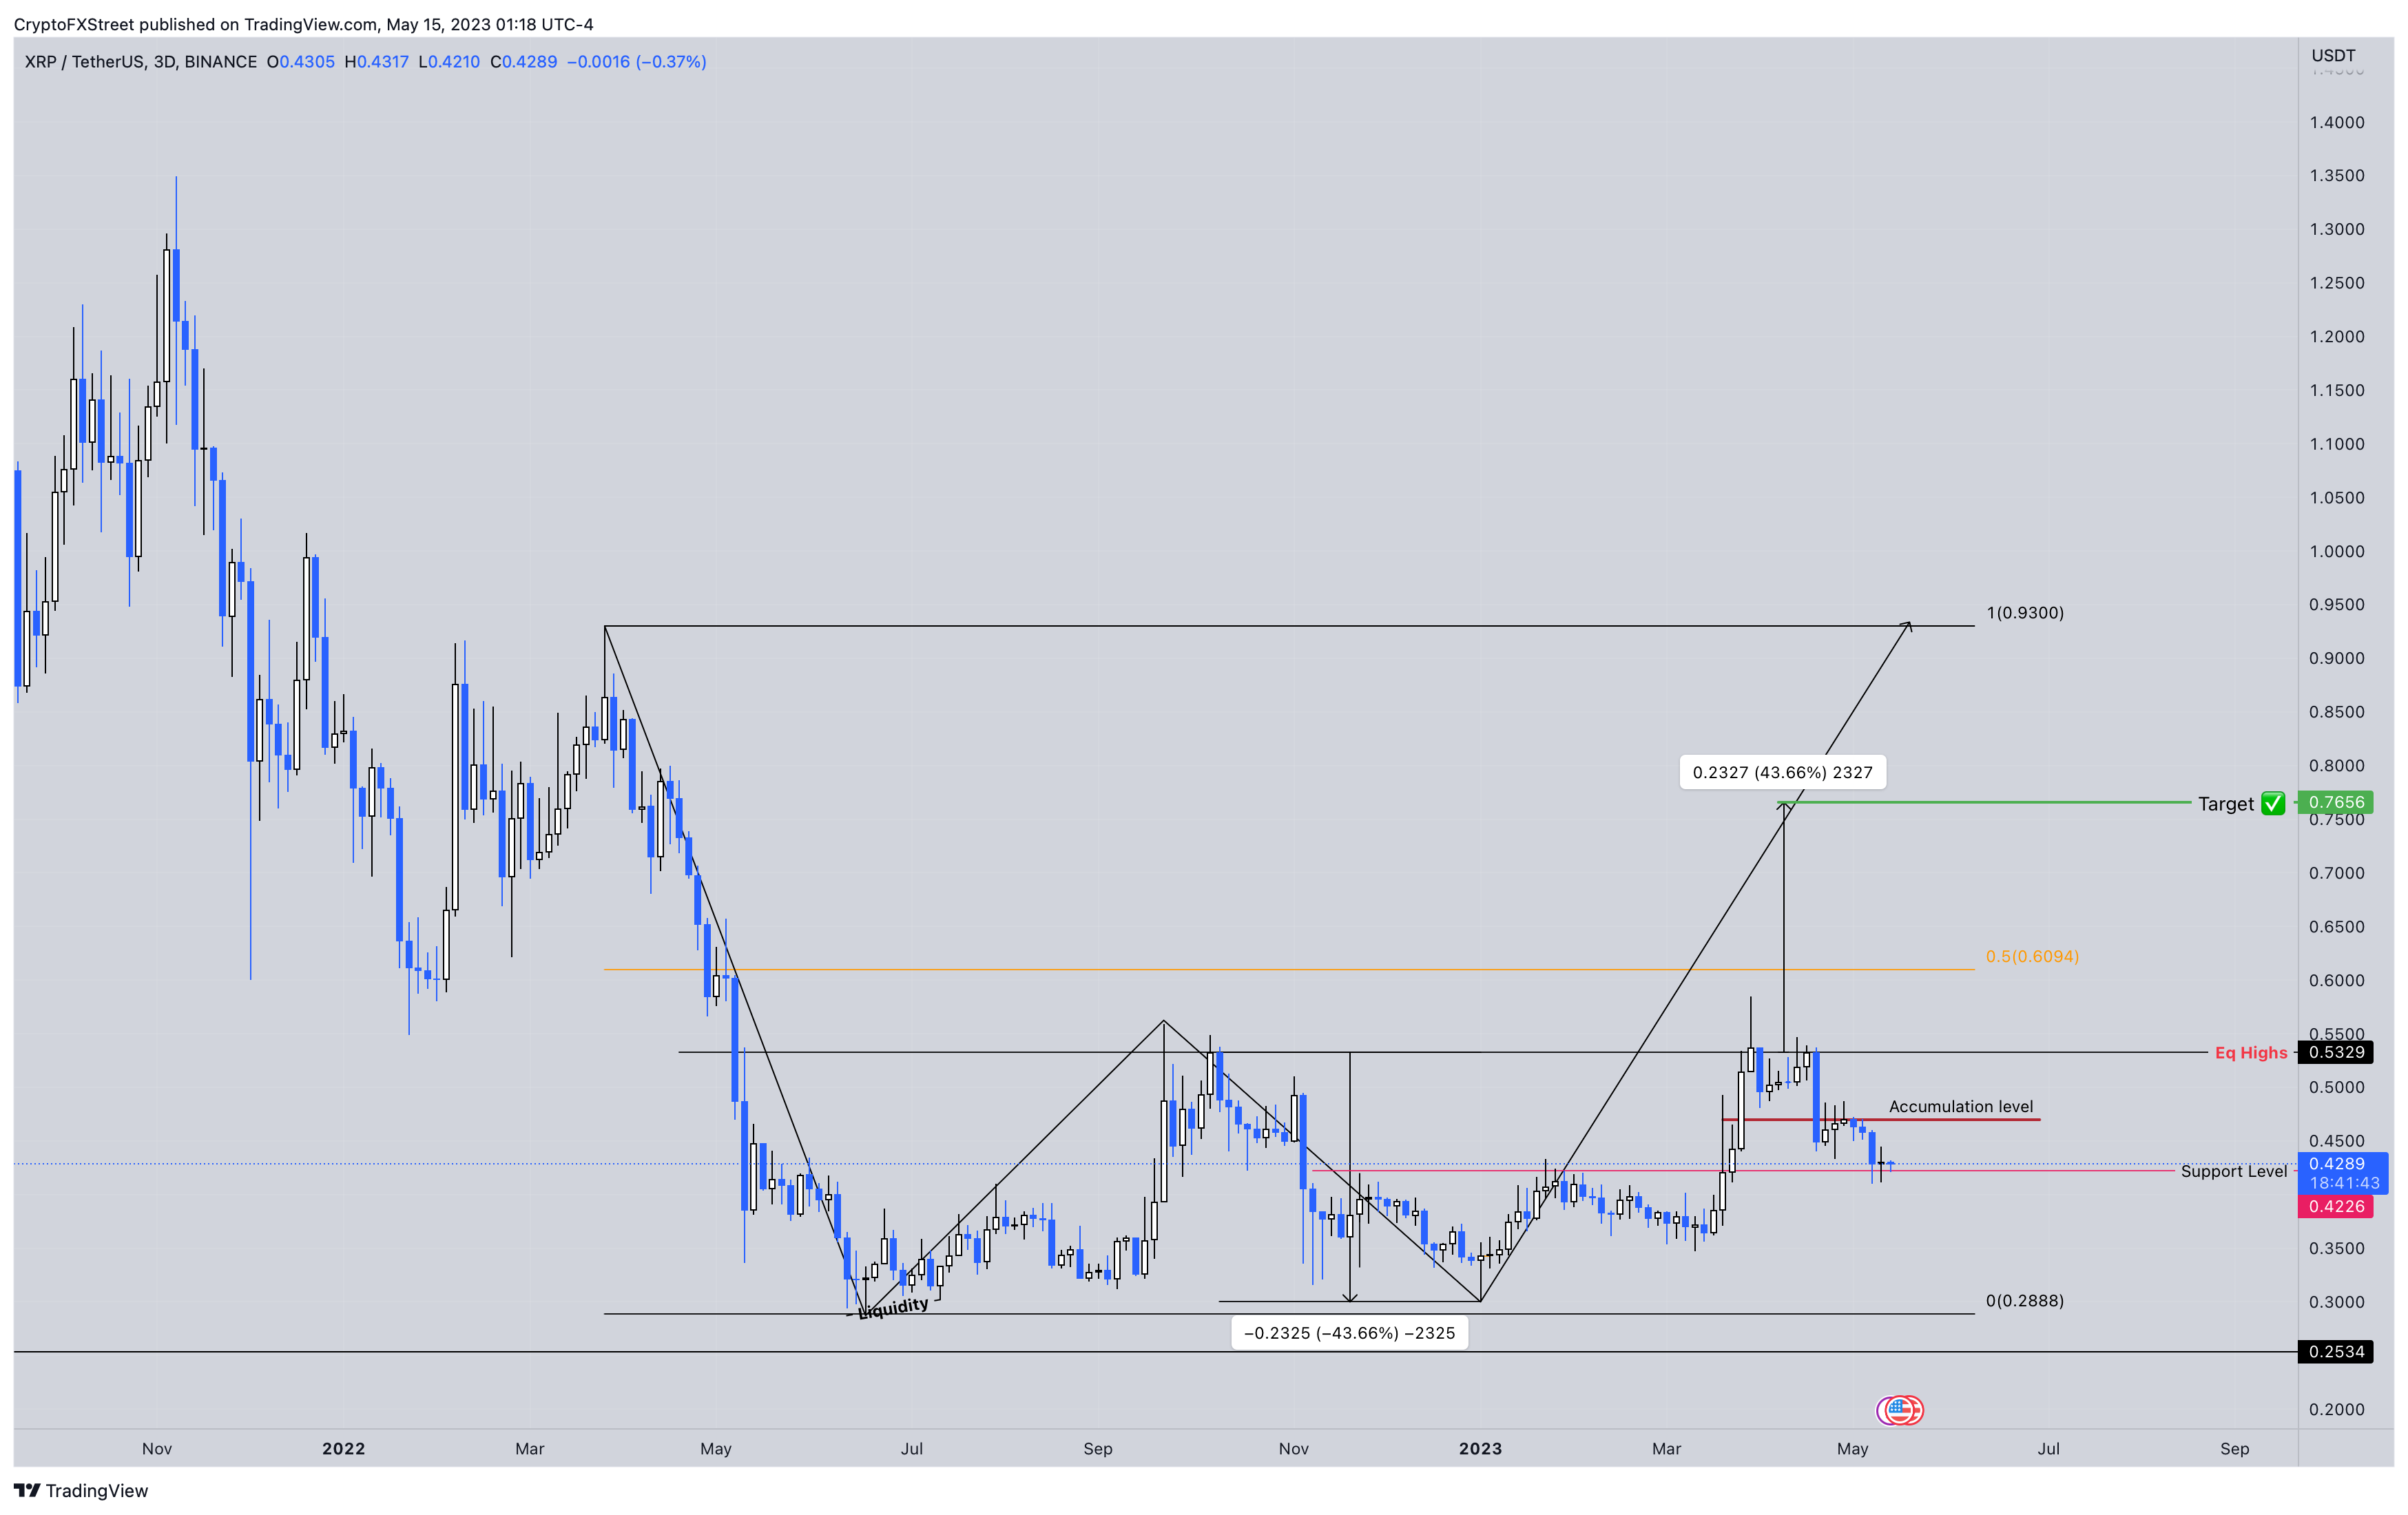
XRP/USD 3-day chart
While the outlook for Ripple price is extremely optimistic, it is contingent on Bitcoin’s recovery rally. Failure in BTC to runup could result in XRP price flipping the $0.422 support level into a resistance barrier. Such a move would invalidate the bullish thesis and potentially trigger a retest of the range low at $0.288.
Information on these pages contains forward-looking statements that involve risks and uncertainties. Markets and instruments profiled on this page are for informational purposes only and should not in any way come across as a recommendation to buy or sell in these assets. You should do your own thorough research before making any investment decisions. FXStreet does not in any way guarantee that this information is free from mistakes, errors, or material misstatements. It also does not guarantee that this information is of a timely nature. Investing in Open Markets involves a great deal of risk, including the loss of all or a portion of your investment, as well as emotional distress. All risks, losses and costs associated with investing, including total loss of principal, are your responsibility. The views and opinions expressed in this article are those of the authors and do not necessarily reflect the official policy or position of FXStreet nor its advertisers. The author will not be held responsible for information that is found at the end of links posted on this page.
If not otherwise explicitly mentioned in the body of the article, at the time of writing, the author has no position in any stock mentioned in this article and no business relationship with any company mentioned. The author has not received compensation for writing this article, other than from FXStreet.
FXStreet and the author do not provide personalized recommendations. The author makes no representations as to the accuracy, completeness, or suitability of this information. FXStreet and the author will not be liable for any errors, omissions or any losses, injuries or damages arising from this information and its display or use. Errors and omissions excepted.
The author and FXStreet are not registered investment advisors and nothing in this article is intended to be investment advice.
Recommended Content
Editors’ Picks

Dogecoin and Bitcoin Cash Price Prediction: Funding rates decrease indicate weakness in DOGE and BCH
Dogecoin and Bitcoin Cash registered 3% and 8% losses on Tuesday following increased selling pressure from the futures market. The decline comes amid large-cap cryptos like Bitcoin, Ether and XRP, holding still with slight gains.

XRP could sustain rally amid growing ETF and SEC vote prospects
Ripple flaunted a bullish outlook, trading at $2.1505 on Tuesday. Investor risk appetite has continued to grow since the middle of last week, propping XRP for a sustainable upward move triggered by the swift decision by US President Donald Trump to suspend reciprocal tariffs for 90 days.

VeChain Price Forecast: VET bulls aim for a double-digit rally
VeChain price hovers around $0.023 on Tuesday after breaking above a falling wedge pattern the previous day; a breakout of this pattern favors the bulls. Bybit announced on Monday that VET would be listed on its exchange. Moreover, the technical outlook suggests rallying ahead, targeting double-digit gains.
Dogecoin, Shiba Inu and Fartcoin price prediction if Bitcoin crosses $100K this week
The meme coin market fell sharply on Monday, shedding 4.8% in market capitalization to settle at $49.25 billion, according to data compiled from CoinGecko. The sell-off coincided with increased volatility across broader crypto markets while investors rotated funds into Bitcoin briefly tested $85,000.

Bitcoin Weekly Forecast: Market uncertainty lingers, Trump’s 90-day tariff pause sparks modest recovery
Bitcoin (BTC) price extends recovery to around $82,500 on Friday after dumping to a new year-to-date low of $74,508 to start the week. Market uncertainty remains high, leading to a massive shakeout, with total liquidations hitting $2.18 billion across crypto markets.

The Best brokers to trade EUR/USD
SPONSORED Discover the top brokers for trading EUR/USD in 2025. Our list features brokers with competitive spreads, fast execution, and powerful platforms. Whether you're a beginner or an expert, find the right partner to navigate the dynamic Forex market.