- Sentiment level nears euphoria adds bearish potential to the crypto market.
- Ethereum tests $400 in the Asian session, fails at European opening.
- Ripple falls decisively and returns doubts to the XRP/USD pair.
The crypto market continues to push upwards despite strong overbuying and over-optimism in the market. Today the Ethereum gives an unexpected change of direction and accumulates a 5% gain against Bitcoin in only two sessions.
Ether's upward movement puts on the table a bullish terminal pattern that could take the market to levels far above the current ones.
Trading in these market conditions is not as safe as the current price levels admit significant price corrections as being highly probable. If on the contrary, the crypto board decides to move up, the rise can be vertical and leave the current price levels as an anecdote.
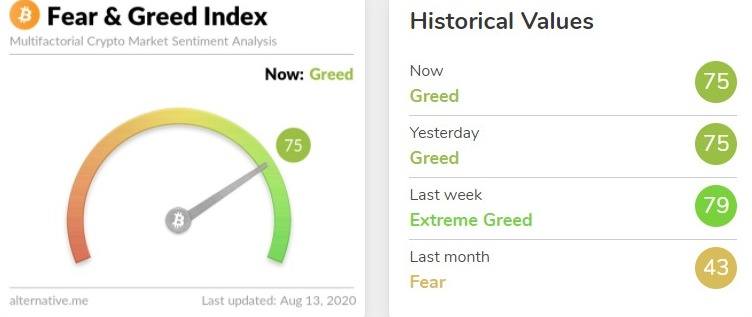
Market sentiment is unchanged from yesterday and remains at level 75, one point below the extreme optimism level. This level of complacency remains very high and dangerous.
Clues to such a puzzle may come from the side of the dominance charts.
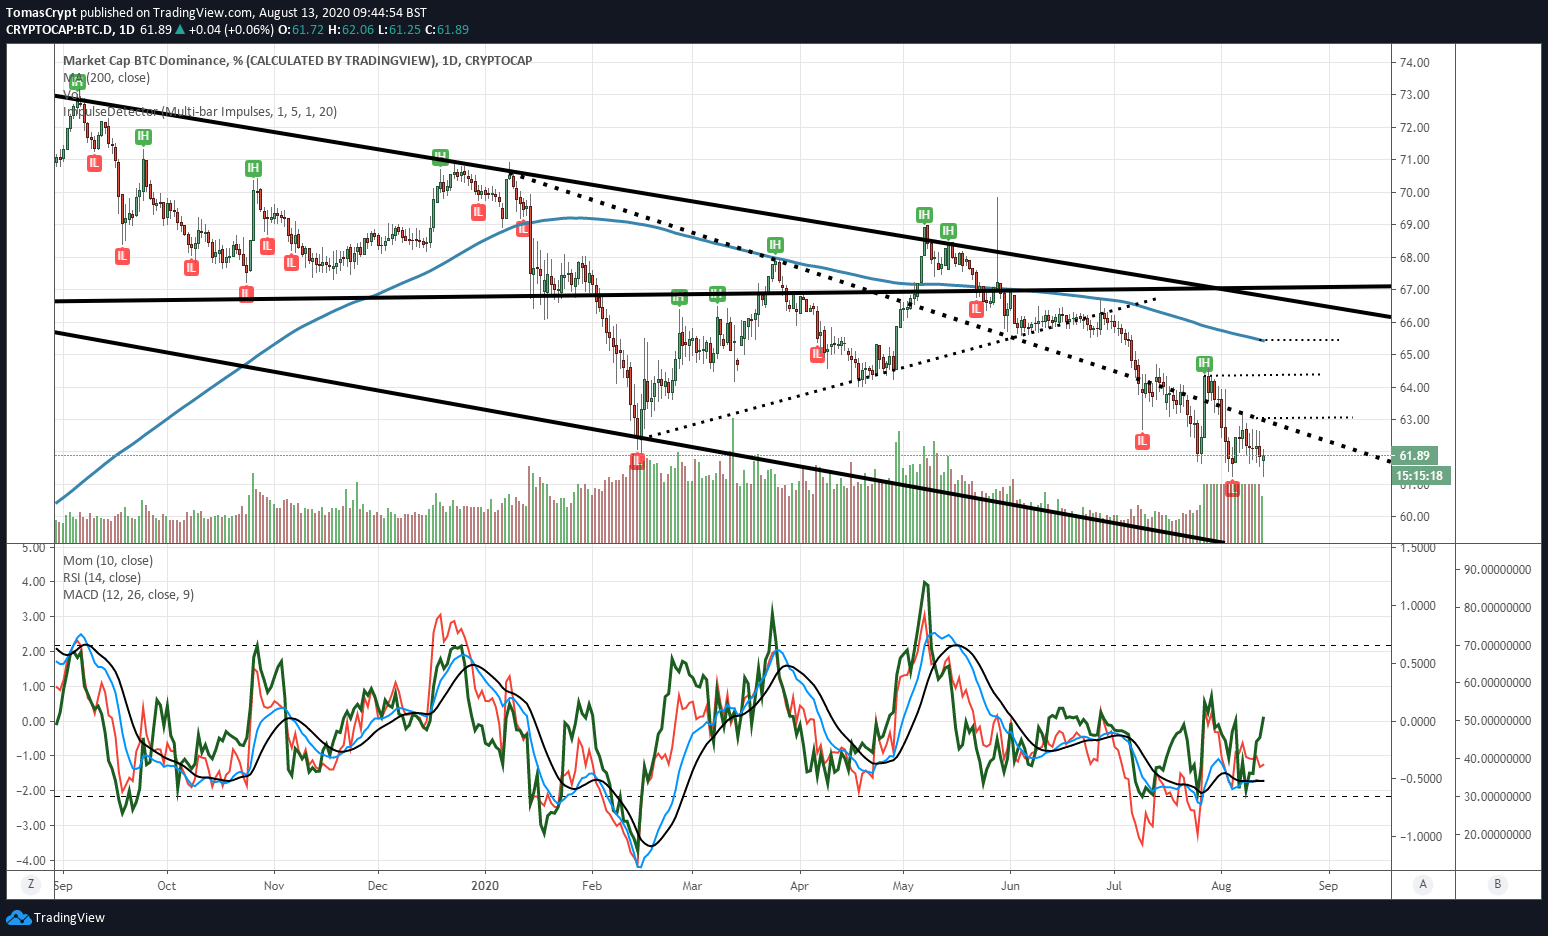
In the case of Bitcoin, the dominance level is now at 61.6%, and it's trying to form a technical floor. Below the 61.24% level, the positions could rotate actively towards Ether and the rest of Altcoins.
ETH/BTC Daily Chart
The ETH/BTC pair is currently trading at the price level of 0.0339 after a first afternoon attempt to break the resistance level at 0.034.
Above the current price, the first resistance level is at 0.034, then the second at 0.0353 and the third one at 0.038.
Below the current price, the first support level is at 0.0328, then the second at 0.0307 and the third one at 0.0295.
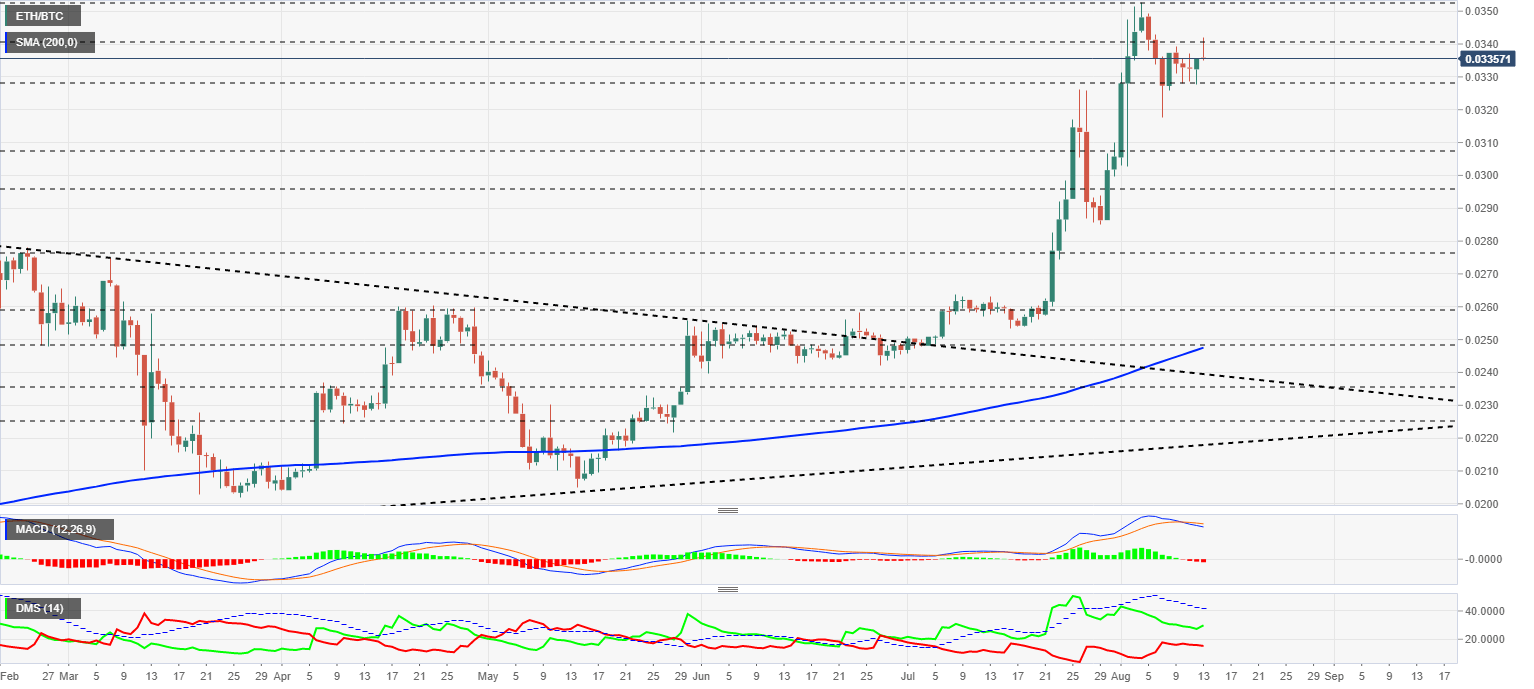
The MACD on the daily chart is losing its downward slope due to yesterday's rally and today's opening. The bearish cross has not undone, and the natural price movement should be downward.
The DMI on the daily chart shows a bullish cross has formed on the bullish side. The bears are not replicating the downward movement, an interesting detail for the short term.
BTC/USD Daily Chart
The BTC/USD pair is currently trading at $11512 and remains above the last resistance level of $11500. BTC/USD is limited at the top by the trend line that originated in early March.
Above the current price, the first resistance level is at $12000, then the second at $12350 and the third one at $12500.
Below the current price, the first support level is at $11350, then the second at $10400 and the third one at $9500.
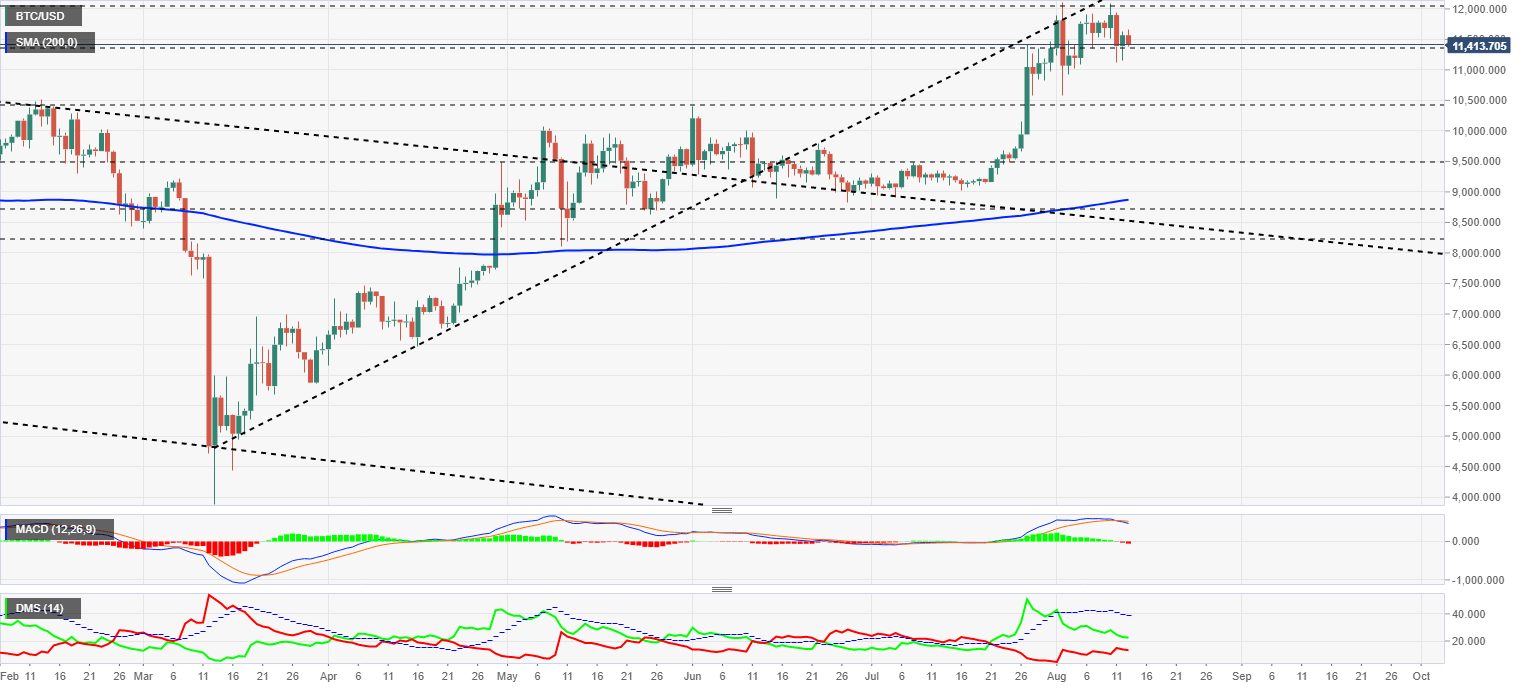
The MACD on the daily chart continues to point downward although yesterday's rally has softened the aggressive downward profile.
The DMI on the daily chart shows bulls and bears at the same levels as in previous days, with no changes to provide information for the short term.
ETH/USD Daily Chart
The ETH/USD pair is currently trading at $388.4 and is losing its gains during the Asian session.
Above the current price, the first resistance level is at $412.7, then the second at $455 and the third one at $500.
Below the current price, the first support level is at $360, then the second at $320 and the third one at $290.
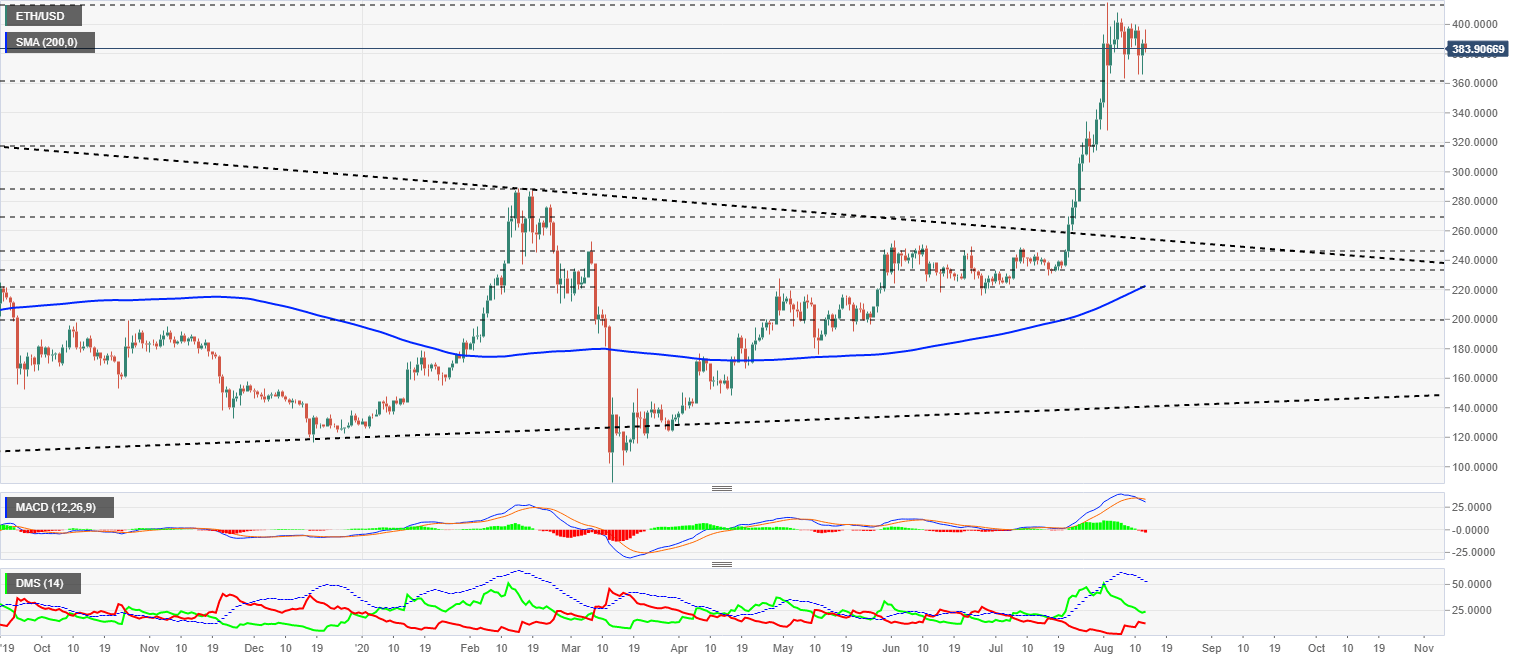
The MACD on the daily chart continues the bearish trend that was confirmed yesterday. The most likely price development for ETH/USD is bearish.
The DMI on the daily chart shows the bulls moving slightly higher, a move that the bears are replicating in a downward direction, aware of the underlying upward force in the ETH/USD pair.
XRP/USD Daily Chart
The XRP/USD pair is currently trading at $0.2768, and this raises doubts as to the strength of the previous Ripple's rise.
Above the current price, the first resistance level is at $0.285, then the second at $0.305 and the third one at $0.336.
Below the current price, the first support level is at $0.265, then the second at $0.235 and the third one at $0.23.
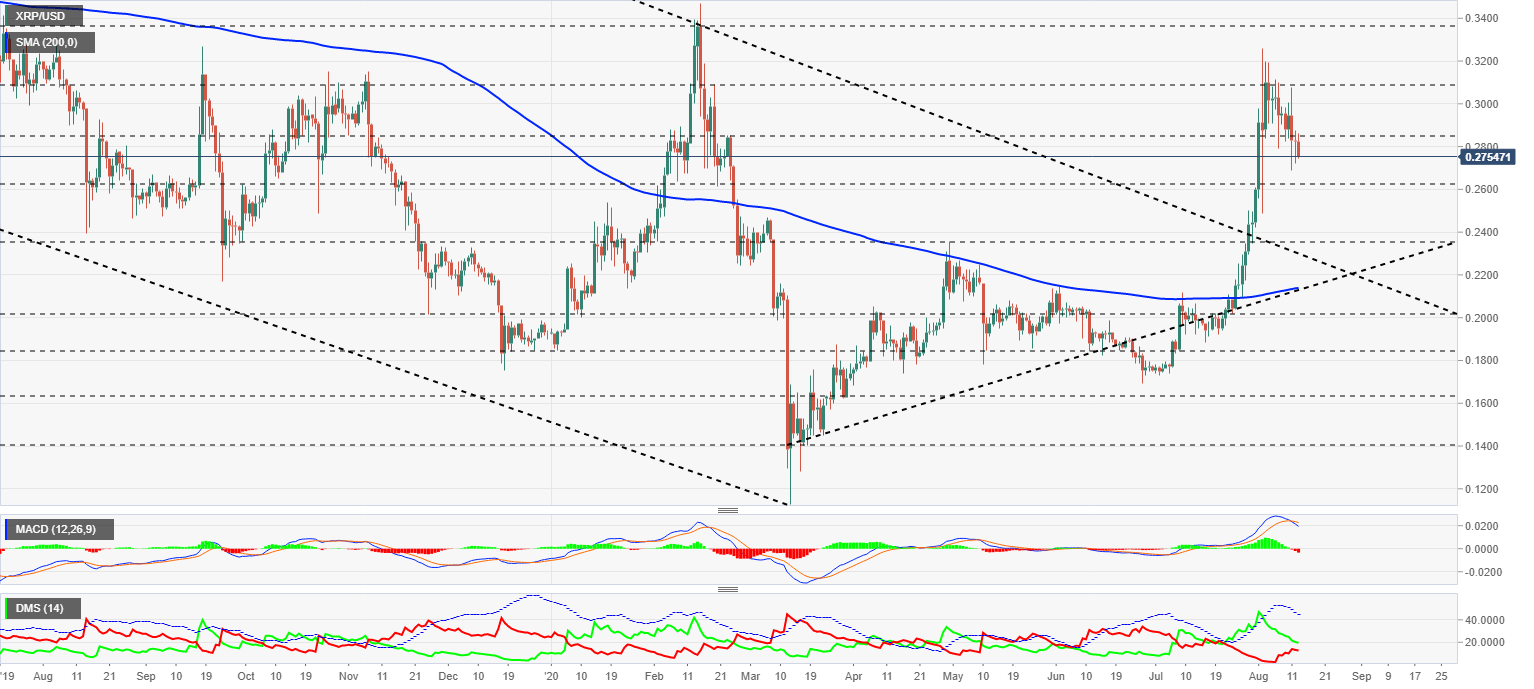
The MACD on the daily chart shows an acceleration in the indicator's bearish trend. The most likely development for Ripple is bearish in the short term.
The DMI on the daily chart shows bulls and bears about to cross. The confrontation between the two sides of the market will increase the volatility of the XRP/USD pair.
Information on these pages contains forward-looking statements that involve risks and uncertainties. Markets and instruments profiled on this page are for informational purposes only and should not in any way come across as a recommendation to buy or sell in these assets. You should do your own thorough research before making any investment decisions. FXStreet does not in any way guarantee that this information is free from mistakes, errors, or material misstatements. It also does not guarantee that this information is of a timely nature. Investing in Open Markets involves a great deal of risk, including the loss of all or a portion of your investment, as well as emotional distress. All risks, losses and costs associated with investing, including total loss of principal, are your responsibility. The views and opinions expressed in this article are those of the authors and do not necessarily reflect the official policy or position of FXStreet nor its advertisers. The author will not be held responsible for information that is found at the end of links posted on this page.
If not otherwise explicitly mentioned in the body of the article, at the time of writing, the author has no position in any stock mentioned in this article and no business relationship with any company mentioned. The author has not received compensation for writing this article, other than from FXStreet.
FXStreet and the author do not provide personalized recommendations. The author makes no representations as to the accuracy, completeness, or suitability of this information. FXStreet and the author will not be liable for any errors, omissions or any losses, injuries or damages arising from this information and its display or use. Errors and omissions excepted.
The author and FXStreet are not registered investment advisors and nothing in this article is intended to be investment advice.
Recommended Content
Editors’ Picks
Ripple update: XRP shows resilience in recent crypto market sell-off
Ripple's XRP is up 6% on Tuesday following a series of on-chain metrics, which reveals investors in the remittance-based token held onto their assets despite the wider crypto market sell-off last week.
Floki DAO floats liquidity provisioning for a Floki ETP in Europe
Floki DAO — the organization that manages the memecoin Floki — has proposed allocating a portion of its treasury to an asset manager in a bid to launch an exchange-traded product (ETP) in Europe, allowing institutional investors to gain exposure to the memecoin.

Six Bitcoin mutual funds to debut in Israel next week: Report
Six mutual funds tracking the price of bitcoin (BTC) will debut in Israel next week after the Israel Securities Authority (ISA) granted permission for the products, Calcalist reported on Wednesday.

Crypto Today: BTC hits new Trump-era low as Chainlink, HBAR and AAVE lead market recovery
The global cryptocurrency market cap shrank by $500 billion after the Federal Reserve's hawkish statements on December 17. Amid the market crash, Bitcoin price declined 7.2% last week, recording its first weekly timeframe loss since Donald Trump’s re-election.

Bitcoin: 2025 outlook brightens on expectations of US pro-crypto policy
Bitcoin price has surged more than 140% in 2024, reaching the $100K milestone in early December. The rally was driven by the launch of Bitcoin Spot ETFs in January and the reduced supply following the fourth halving event in April.

Best Forex Brokers with Low Spreads
VERIFIED Low spreads are crucial for reducing trading costs. Explore top Forex brokers offering competitive spreads and high leverage. Compare options for EUR/USD, GBP/USD, USD/JPY, and Gold.