- Bitcoin price falls below $19,500, spelling bad news for the uptrend scenario.
- Ethereum has breached the August low at $1,419.
- Ripple price diverges as it rebounds into the 21-day simple moving average.
The cryptocurrency market liquidates early traders who partook in the 20% rally in early September. A sweep-the-lows event is likely underway. Key levels have been identified.
Bitcoin price re-routes south
Bitcoin price has breached a definitive line in the sand as the bears persistently flex their power on smaller time frames. Since September, the peer-to-peer digital currency has lost 15% of its market value. The recent breach of the $20,000 level (which acted as the accumulation zone before the 20% rally witnessed during the first week of September) spells serious trouble in the grand scheme of things.
Bitcoin price currently auctions at $19,380. A Fibonacci Retracement tool surrounding the September bull run depicts the current sell-off as no ordinary correction. The bears have successfully breached through the 50%, 61.8,% and 70% Fib levels, with an uptick in bearish volume amidst each hurdle.
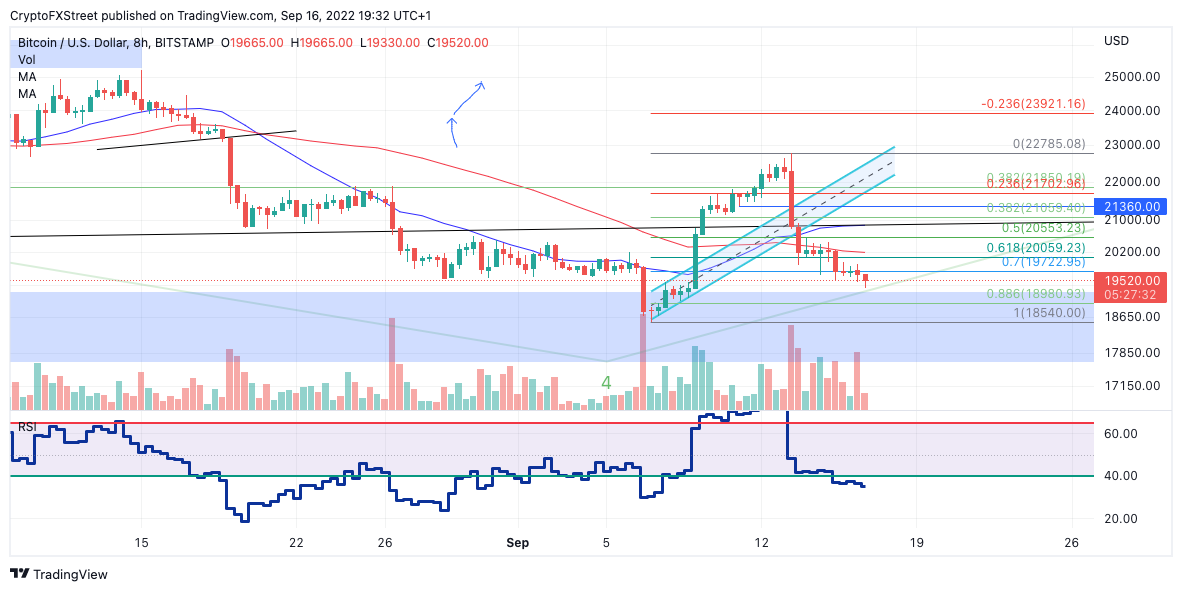
BTC USD
If market conditions persist, a sweep-the-lows event targeting the monthly low at $18,540 could occur in the coming days. The bulls need to hurdle the 50% Fib level at $20,553 to invalidate the bearish outlook.
In the following video, our analysts deep dive into the price action of Bitcoin, analyzing key levels of interest in the market. -FXStreet Team
Ethereum price wipes out a month of gains
Ethereum price has recently breached the August low at $1,419, which is likely to bring an influx of volatility and uncertainty into the market for the remainder of September.
Ethereum price currently auctions at $1,427 as the decentralized smart contract token is now down 20% since its September high at $1,789. The Volume Profile Indicator shows an uptick in volume, while the 8-day exponential and 21-day simple moving averages lag behind the bearish momentum near the mid $1,600 levels.
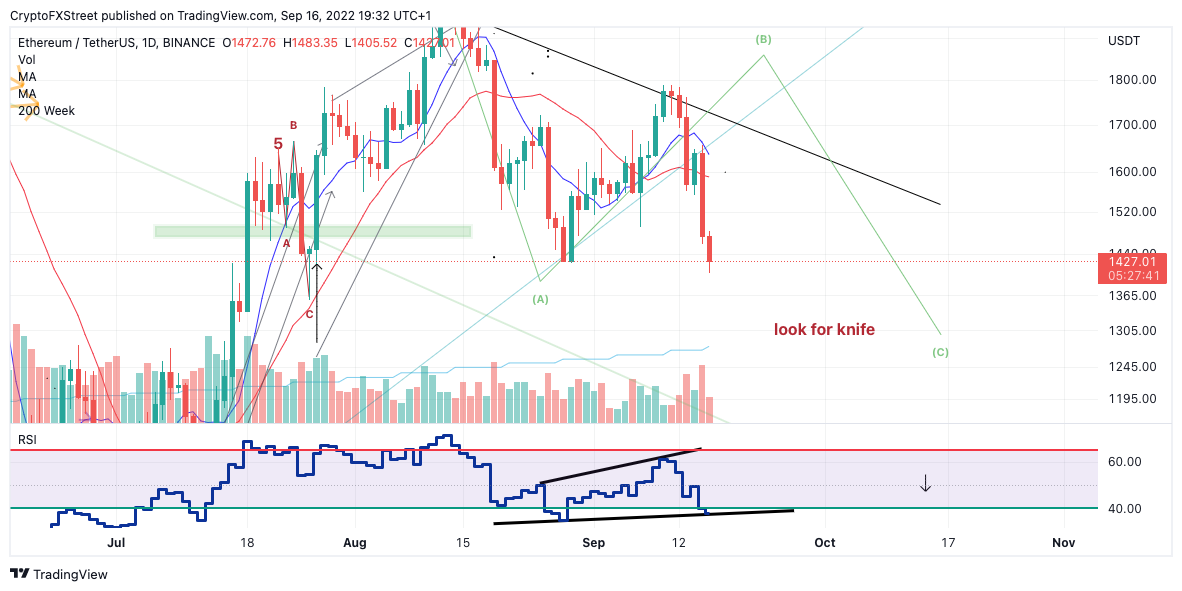
ETH USDT
If market conditions persist, the bears could induce a capitulation event to force early bulls out of their long positions. A probable target is the 200-week moving average at $1,271
In the following video, our analysts deep dive into the price action of Ethereum, analyzing key levels of interest in the market. -FXStreet Team
XRP price diverges from the bunch
XRP price is bringing nostalgic price action back into the market. Crypto day traders know digital remittance tokens’ ability to diverge. While Bitcoin is spiraling south, the XRP price has witnessed a 5% rebound.
XRP price currently auctions at $0.33 as the bulls attempt to reconquer the 21-day simple moving average. A Fibonacci Retracement tool surrounding the September rally suggests the Ripple price faces a few more stiff levels of resistance before an uptrend targeting $0.39 can occur.
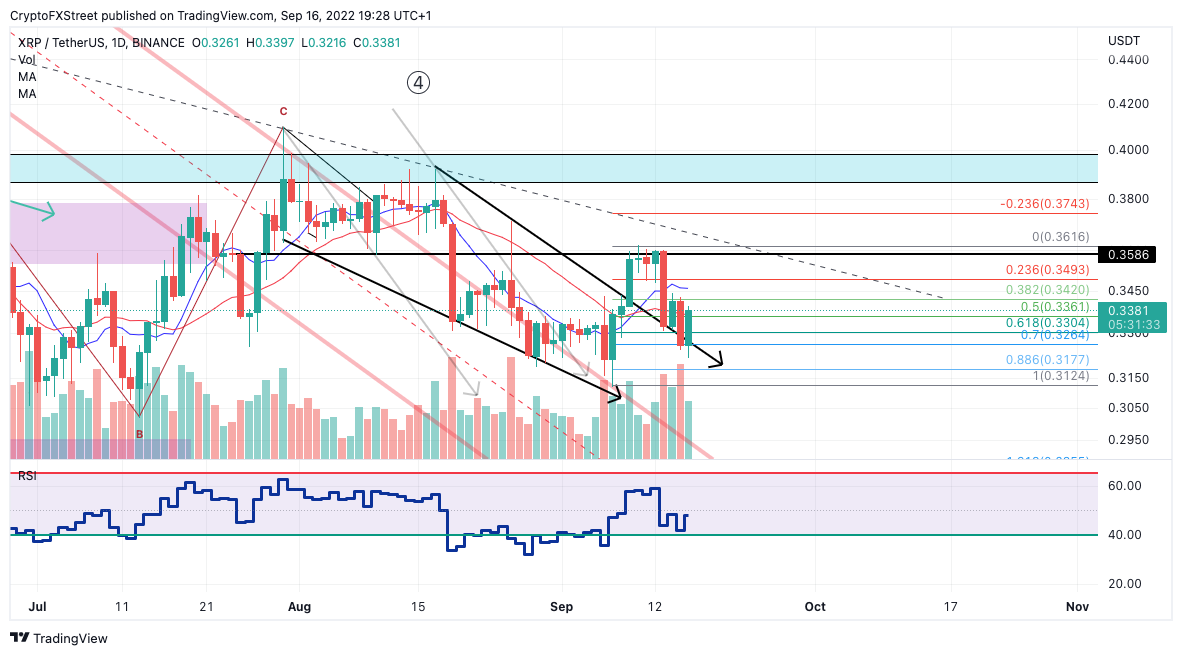
XRP USDT
If the XRP price can hurdle the 38.2% Fib level at $0.34, a rally could ensue, targeting the August 26 high at $0.37 and potentially the summer high near $0.39. Such a move would result in up to a 17% increase from the current price.
In the following video, our analysts deep dive into the price action of Ripple, analyzing key levels of interest in the market. -FXStreet Team
Information on these pages contains forward-looking statements that involve risks and uncertainties. Markets and instruments profiled on this page are for informational purposes only and should not in any way come across as a recommendation to buy or sell in these assets. You should do your own thorough research before making any investment decisions. FXStreet does not in any way guarantee that this information is free from mistakes, errors, or material misstatements. It also does not guarantee that this information is of a timely nature. Investing in Open Markets involves a great deal of risk, including the loss of all or a portion of your investment, as well as emotional distress. All risks, losses and costs associated with investing, including total loss of principal, are your responsibility. The views and opinions expressed in this article are those of the authors and do not necessarily reflect the official policy or position of FXStreet nor its advertisers. The author will not be held responsible for information that is found at the end of links posted on this page.
If not otherwise explicitly mentioned in the body of the article, at the time of writing, the author has no position in any stock mentioned in this article and no business relationship with any company mentioned. The author has not received compensation for writing this article, other than from FXStreet.
FXStreet and the author do not provide personalized recommendations. The author makes no representations as to the accuracy, completeness, or suitability of this information. FXStreet and the author will not be liable for any errors, omissions or any losses, injuries or damages arising from this information and its display or use. Errors and omissions excepted.
The author and FXStreet are not registered investment advisors and nothing in this article is intended to be investment advice.
Recommended Content
Editors’ Picks
Celebrity meme coins controversy continues amid Pump.fun revenue dominance
![Celebrity meme coins controversy continues amid Pump.fun revenue dominance](https://editorial.fxstreet.com/images/Resources/CryptoWorldSEO3_XtraSmall.jpg)
Pump.fun outperformed the Ethereum blockchain on Tuesday after raking in $1.99 million. Following this achievement, a meme coin based on actress Sydney Sweeney was the subject of controversy after its developers dumped their bags on investors.
PEPE's on-chain metrics indicate potential rally after weeks of silence
![PEPE's on-chain metrics indicate potential rally after weeks of silence](https://editorial.fxstreet.com/images/Markets/Currencies/Cryptocurrencies/PEPE/PEPE_coin_XtraSmall.jpg)
PEPE has struggled to see any significant price move after reaching an all-time high in May. Increased adoption rate and low MVRV ratio indicate a bullish run may be on the horizon. A single PEPE outflow from Binance worth $14.7 million gives credence to signs of bullish expectation.
Ethereum has failed to overcome key resistance despite bullish sentiment surrounding ETH ETF
![Ethereum has failed to overcome key resistance despite bullish sentiment surrounding ETH ETF](https://editorial.fxstreet.com/images/Markets/Currencies/Digital%20Currencies/Ethereum/ethereum_2_XtraSmall.jpg)
Ethereum (ETH) is down more than 1.4% on Tuesday following another ETH sale from the Ethereum Foundation. Meanwhile, crypto exchange Gemini's recent report reveals that ETH ETF could see about $5 billion in net inflows within six months of launch.
Crypto community blasts Polkadot following report of treasury spending
![Crypto community blasts Polkadot following report of treasury spending](https://editorial.fxstreet.com/images/Markets/Currencies/Cryptocurrencies/Polkadot/polkadot-150x150logo-637399979978734311_XtraSmall.png)
Polkadot reports $87 million of treasury spending during H1. Crypto community members expressed harsh feelings toward the DOT team's high spending. DOT is up more than 2% in the past 24 hours but risks correction following the report.
Bitcoin: BTC price correction could end in July, according to seasonal data
![Bitcoin: BTC price correction could end in July, according to seasonal data](https://editorial.fxstreet.com/images/Markets/Currencies/Digital%20Currencies/Bitcoin/bitcoin_5_XtraSmall.jpg)
Bitcoin (BTC) price appears poised for a decline this week, influenced by slight outflows in US spot ETFs, selling activity among BTC miners, and a combined transfer of 4,690.28 BTC to centralized exchanges by the US and German governments.