- Bitcoin price hovers around $28,000 and could hit $30,000 by Easter 2023.
- Ethereum price looks for a leg above $1,800 despite regulatory challenges and exchange decisions.
- XRP price explodes over 20% on important Ripple news.
Bitcoin price faces a new narrative, BTC vs. banks, having steadily built a potential base following the FTX contagion. Suddenly, the king crypto is showing massive strength compared to the rest of the financial world. As the banking sector faces a crisis, BTC is finally showing what it was created for, and altcoins like Ethereum and Ripple are not far behind. The uptick across the table comes amid federal regulatory clampdown on crypto entities and an increasingly cautious market environment. Michael Safai, managing partner at Dexterity Capital said,:
When you see the banking system in peril, you realize that bitcoin was really invented to create independence from those risks and to get away from the whims of central banks.
Bitcoin price hovers above $28,000 as bullish momentum builds
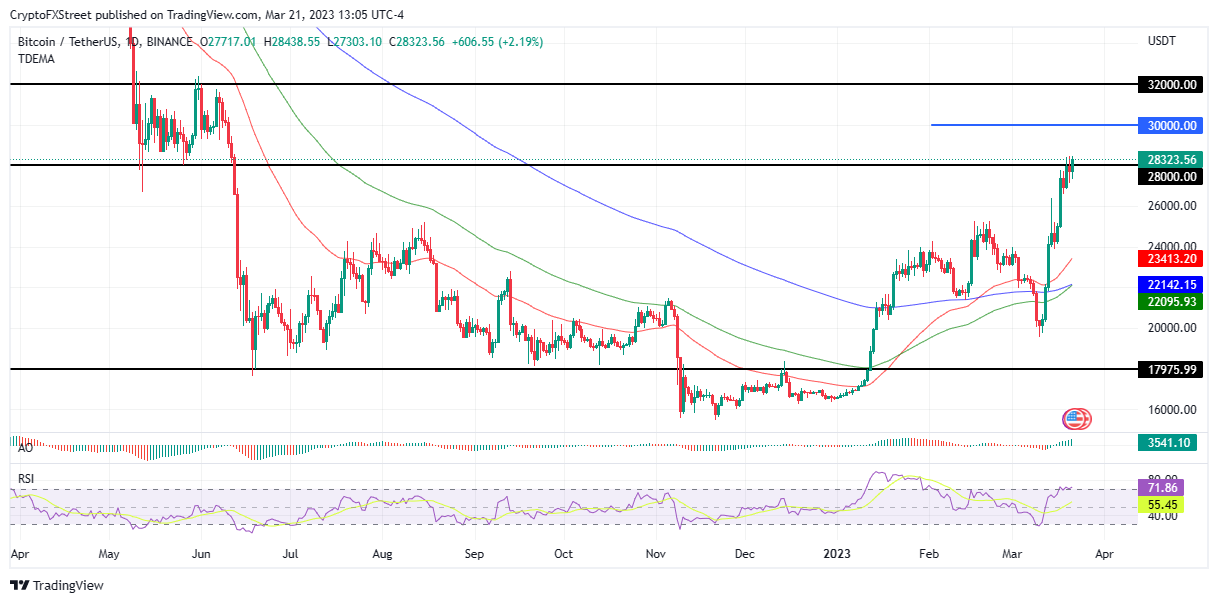
Bitcoin price is auctioning for $28,323 after breaching the $28,000 resistance level on March 21. The price is trying to consolidate above this level in the one-day timeframe as bulls accumulate power for a further move. The banking debacle rattled global financial markets, boosting investors' confidence in crypto, and now they view BTC as an alternative to the traditional banking system.
Bitcoin price is up 21% month-to-date, bringing the total gains to around 70% since the onset of 2023. If the king crypto holds above the $28,000 level, BTC could hit $30,000 before Easter 2023. Of course, this requires an increase in buyer momentum and that investors keep their selling appetite in check.
In highly bullish cases, Bitcoin price could continue northbound to crack past the $30,000 target and tag the $32,000 resistance level last seen in May 2022 before the Terra crisis.
Notice a pending bullish call on the chart below, which would be authenticated once the 100-day Exponential Moving Average (EMA) at $22,094 crosses above the 200-day EMA at $22,141. If investors heed this call, Bitcoin price could soar further. Alongside the 100- and 200-day EMAs, the 50-day EMA at $23,409 was also northbound, indicating this was the path with the least resistance.
BTC/USDT 1-day chart
Conversely, if profit takers play their cards, Bitcoin price could descend below the $28,000 level or lower in extremely bearish conditions. A daily candlestick close below this level could threaten the current trajectory.
Additionally, the Relative Strength Index (RSI) at 71 had just crossed into the overbought territory. This could indicate waning bullish momentum, presumably explaining why Bitcoin price has been trading horizontally since March 19, capped under the psychological resistance at the $28,500 area.
Ethereum price looks for another leg up
Ethereum price is soldiering on despite regulatory challenges and exchange decisions. Recently, crypto trading platform Kraken announced plans to shut down its retail ETH staking business in the US as part of its settlement with the Securities and Exchange Commission (SEC). The New York attorney general also argued that ETH is a security in a case against the crypto exchange KuCoin. SEC Chair Gary Gensler has repeatedly implied that Ether is not a commodity.
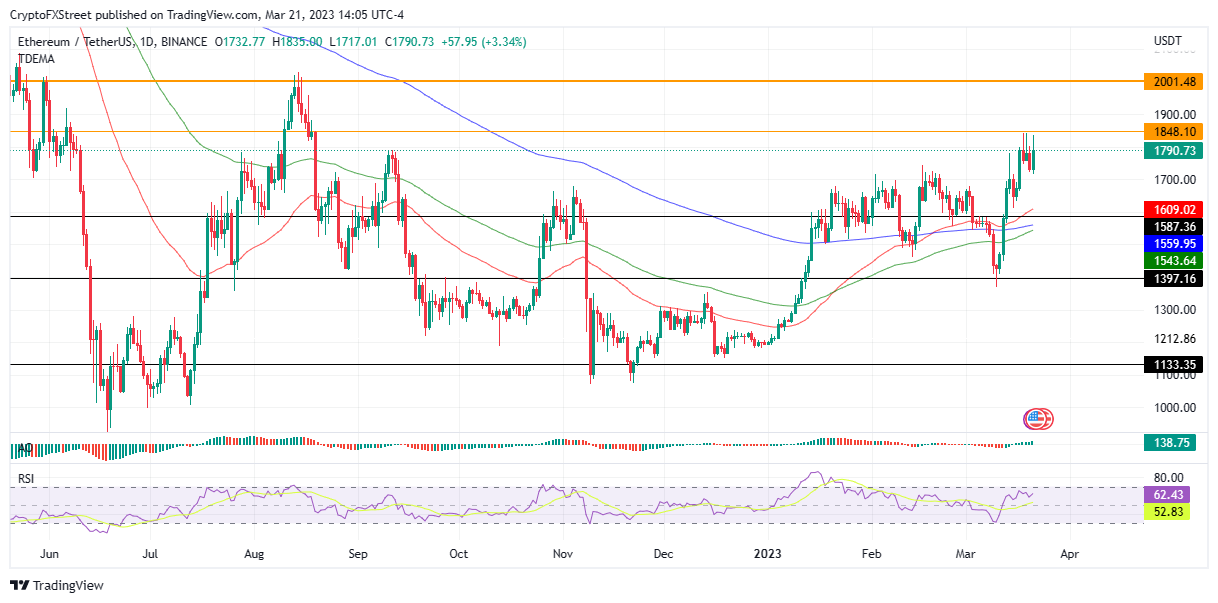
Nevertheless, Ethereum price remains northbound after gaining 2% in the last 24 hours to auction at $1,790 at the time of writing. If sidelined investors join the rally, ETH could move above the psychological $1,800 level and tag the next obstacle at $1,848, last visited in August. In highly bullish cases, the second largest crypto could ascend to tag the $2,001 barricade, completing an 11% upswing from current levels.
The RSI at 62 showed there was still more room to the upside before ETH was considered overbought. Any position above 50 hints at growing momentum, which means Ethereum price could increase, particularly as the countdown to the Shanghai upgrade continues, where staking withdrawals will be enabled.
ETH/USDT 1-day chart
On the downside, if buying pressure eases, Ethereum price risks dropping to tag the 50-day EMA at $1,608 before a further leg down under the $1,587 support level. Factors that could contribute to the value drop include the market slowing down on FOMC anticipation and investors booking early profits.
Ripple price explodes on positive network news
Ripple price has exploded nearly 30% on positive network news. For starters, lawyers representing the crypto firm and its co-defendants have adduced new evidence expected to bolster their defense arguments greatly in the SEC lawsuit against the company.
Secondly, the Ripple network has introduced a new mechanism, XRPL Solvency Proof, to enhance a privacy solutions toolkit for all DeFi users in the XRP Ledger ecosystem and those who leverage XRP in real-world use cases. This has contributed to the Ripple price increase.
Congratulations to the winning team of the #ParisBlockchainWeek #XRPL #Hackathon
— Jason Tigas (@jayCryp_TO) March 20, 2023
XRPL Solvency Proof is a way to prove solvency without revealing wallet address or transaction history (ie Renting, Loans, Investments, Insurance, etc)#BuiltOnXRPLhttps://t.co/fhonRmagfM pic.twitter.com/FQTDU0fD1Z
Thirdly, the network has partnered with a key UK-based non-profit, GOSH Charity, to help children living with Cancer.
Excited to announce @Ripple's partnership with @GOSHCharity - now Ripple’s primary UK nonprofit partner. We believe in the power of #blockchain to create positive change. Great example how we can use our resources to support children under cancer care and their families. https://t.co/eV0sfyzVWC
— Sendi Young (@sendiyoung) March 21, 2023
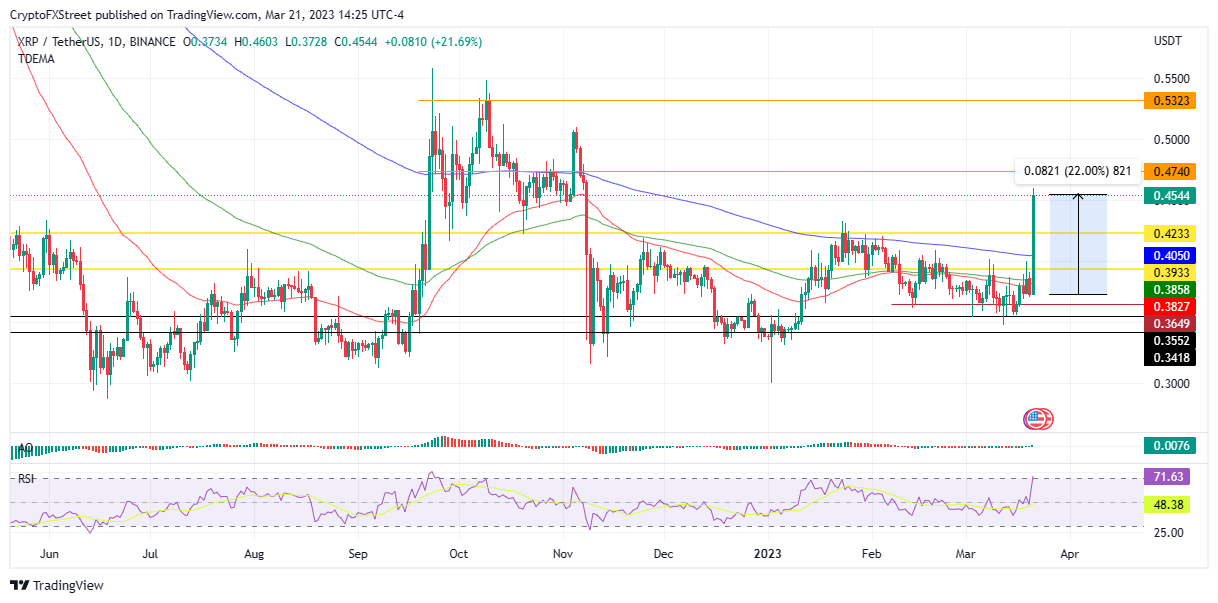
Ripple price unexpectedly leaped 27% to outperform Bitcoin and Ethereum in daily gains. Based on the RSI indicator, the XRP/BTC recovery trend may continue in the short term, implying that XRP could continue gaining strength against Bitcoin in the coming days. Predictions in the Ripple lawsuit also have a bearing on the price action.
Ripple price is testing the $0.4740 resistance level. A decisive flip of this obstacle into support could set the tone for XRP to target the next barrier at $0.5323. Such a move would denote a 12% ascent from current levels.
XRP/USDT 1-day chart
On the downside, given the long green bar, investor appetite for profit could turn to greed, triggering a sell-off. This could send Ripple price down into the supplier congestion zone marked in yellow bands between $0.4233 and $0.3933.
A leg below this zone could see Ripple price lose most of the gains made on March 21, setting it back to endure overhead pressure from the 200- 100- and 50-day EMAs at $0.4050, $0.3857, and $0.3826, respectively.
Read: Drivers to the latest XRP bull run and why it is far from over
Information on these pages contains forward-looking statements that involve risks and uncertainties. Markets and instruments profiled on this page are for informational purposes only and should not in any way come across as a recommendation to buy or sell in these assets. You should do your own thorough research before making any investment decisions. FXStreet does not in any way guarantee that this information is free from mistakes, errors, or material misstatements. It also does not guarantee that this information is of a timely nature. Investing in Open Markets involves a great deal of risk, including the loss of all or a portion of your investment, as well as emotional distress. All risks, losses and costs associated with investing, including total loss of principal, are your responsibility. The views and opinions expressed in this article are those of the authors and do not necessarily reflect the official policy or position of FXStreet nor its advertisers. The author will not be held responsible for information that is found at the end of links posted on this page.
If not otherwise explicitly mentioned in the body of the article, at the time of writing, the author has no position in any stock mentioned in this article and no business relationship with any company mentioned. The author has not received compensation for writing this article, other than from FXStreet.
FXStreet and the author do not provide personalized recommendations. The author makes no representations as to the accuracy, completeness, or suitability of this information. FXStreet and the author will not be liable for any errors, omissions or any losses, injuries or damages arising from this information and its display or use. Errors and omissions excepted.
The author and FXStreet are not registered investment advisors and nothing in this article is intended to be investment advice.
Recommended Content
Editors’ Picks

Top 3 Price Prediction Bitcoin, Ethereum, Ripple: Bulls target $100,000 BTC, $2,000 ETH, and $3 XRP
Bitcoin (BTC) is stabilizing around $95,000 at the time of writing on Wednesday, and a breakout suggests gains toward $100,000. Ethereum (ETH) and Ripple (XRP) followed BTC’s footsteps and hovered around their key levels.

Tether mints 3 billion USDT on Ethereum and TRON as markets stabilize
Tether ramps up its minting activity amid surging demand for stablecoins, often signaling heightened trading and liquidity needs. The issuer of the leading stablecoin by market capitalization has minted 2 billion USDT on Ethereum and an additional 1 billion USDT on the TRON network.

SEC delays decision on Franklin Templeton’s spot XRP ETF to June 2025
The Securities and Exchange Commission (SEC) has postponed its decision on Franklin Templeton’s spot XRP ETF, extending the review period to June 17, 2025. XRP traded at approximately $2.24 at press time, rising 7% over the past week, according to CoinGecko.

Trump Media announces new token launch and native crypto wallet in latest Shareholder letter
Trump Media unveils plans to launch a utility token and crypto wallet to monetize Truth Social and expand its streaming services. Markets react with a 10% drawdown on the Solana-hosted official TRUMP memecoin.

Bitcoin Weekly Forecast: BTC consolidates after posting over 10% weekly surge
Bitcoin (BTC) price is consolidating around $94,000 at the time of writing on Friday, holding onto the recent 10% increase seen earlier this week.

The Best brokers to trade EUR/USD
SPONSORED Discover the top brokers for trading EUR/USD in 2025. Our list features brokers with competitive spreads, fast execution, and powerful platforms. Whether you're a beginner or an expert, find the right partner to navigate the dynamic Forex market.


