Top 3 Price Prediction Bitcoin, Ethereum, Ripple: Cryptocurrency prices rally as markets anticipate US CPI
- Bitcoin price could make a 5% run to $30,400 if it closes decisively above $30,259 or a pullback to demand zone.
- Ethereum price coils up for a retest of the $1,836 to $1,806 demand zone unless bullish momentum propels it past the $1,887 hurdle.
- Ripple price tests the 50-day EMA at $0.6591 as bulls look to breach the $0.6840 resistance level.
Cryptocurrency prices are rallying starting with Bitcoin (BTC) price, which is trading with a bullish inclination. With it, the rest of the altcoin category is flashing green, starting with Ethereum (ETH) and Ripple (XRP). It all comes ahead of the US Consumer Price Index (CPI), which has been scheduled for August 10 at 12:30 GMT.
According to studies, the relationship between cryptos and US inflation is ultimately tenuous. Whilst there have been periods where cryptos appear to have been used as an inflation hedge, these are not consistent enough and too often contradicted to offer a robust correlation.
That said, if Thursday’s CPI reading causes market volatility it will probably spill over into crypto as there is evidence of a correlation with broader market volatility (as measured by the VIX). A big miss, therefore, could impact the big crypto. Ethereum (ETH) and Ripple (XRP), meanwhile, are both riding on this optimism, but it remains to be seen whether this is sustainable.
Also Read: Could Bitcoin price advance amid higher US inflation rate expectations?
Bitcoin price has investors on the edge of their seats
Bitcoin (BTC) price shows optimism, which explains the recent run up and tagging of the $30,259 resistance level. However, the breach of this barricade was premature, as it was followed by a rejection. Now BTC could draw lower towards the demand zone at $29,353 to $28,842.
If this buyer dormancy zone fails to hold Bitcoin price could slip through, flipping the zone into a bearish breaker before BTC extends toward the 200-day Exponential Moving Average (EMA) at $28,602.
In a dire case, the flagship crypto could move lower to the $27,300 range – or retest the June 18 lows around $26,320 in the worst possible outcome. Such a move would constitute a 10% downswing from current levels.
The Relative Strength Index (RSI) supports the bearish outlook as it edges south reflecting falling momentum. Similarly, the histograms of the Awesome Oscillator are thinly above the midline, suggesting bears could easily take control.
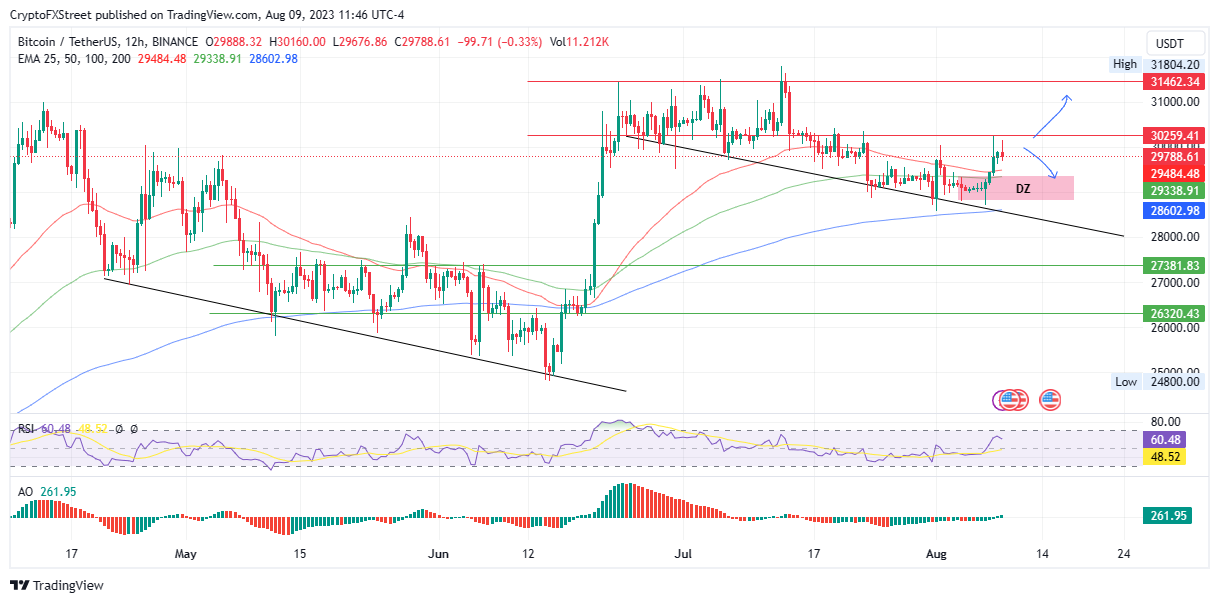
BTC/USDT 12-hour chart
Conversely, a resurgence by the bulls could salvage the situation for Bitcoin price, correcting the slump with a northbound move toward the $30,259 roadblock.
A successful breach of this supplier congestion zone into support would invalidate the bearish outlook, potentially clearing the path for a rally to $31,462. This would denote a 5% uptick above current levels.
Also Read: Bitcoin whales make a comeback as open interest hits 15-month high ahead of CPI announcement.
Ethereum price could pull toward the demand zone
Ethereum (ETH) price is trading with a bearish inclination. The second largest crypto by market capitalization is facing rejection from both the 50- and the 100-day EMA at $1,859 and $1,862 respectively.
As buying pressure continues to fade, sellers could push Ethereum price below the 200-day EMA at $1,842. Therefore, the area between $1,836 and $1,806 is crucial for ETH, giving bulls a chance to buy aggressively lest the PoS token converts it into a bearish breaker as it extrapolates to the $1,786 support level.
The dipping RSI also supports this outlook by showing falling momentum, and the AO histograms point to bears dominating the bulls.
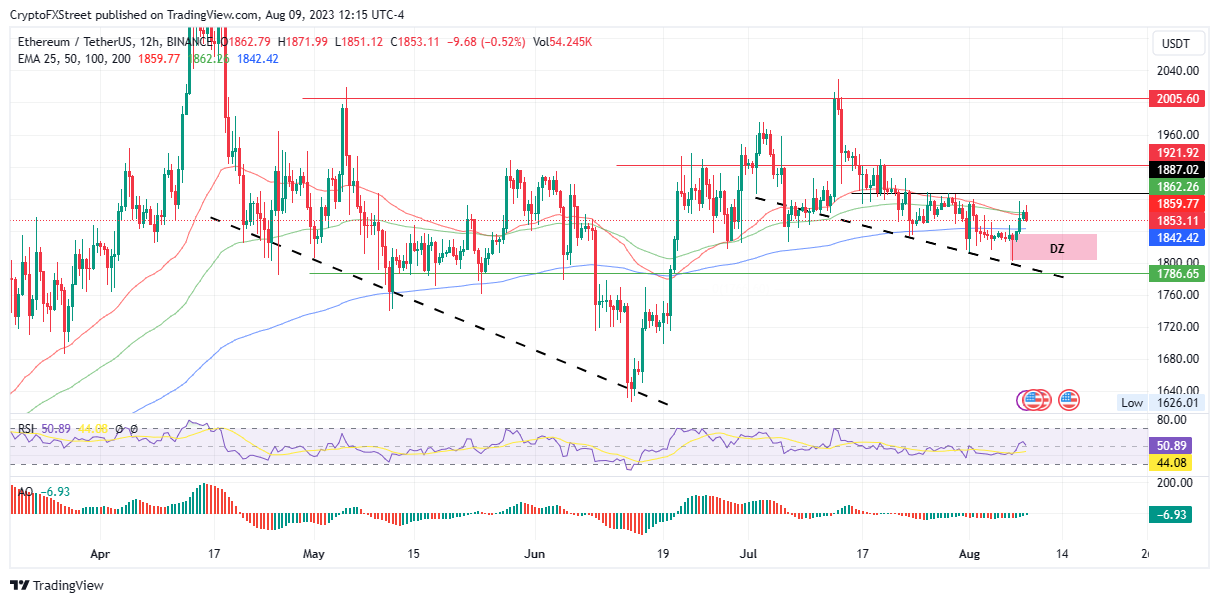
ETH/USDT 12-hour chart
If the above scenario does not play out, Ethereum price could pull north, restoring above the 50- and 100-day EMA before confronting the $1,887 resistance level. A bold move above this barricade could inspire hope among bulls drawing in sidelined investors and conservative traders.
The ensuing buying pressure could see Ethereum price reclaim the July 19 peak around $1,921 or extend a neck to tag the $2,005 resistance level in a highly bullish case. This would denote a 10% ascension.
Also Read: Ethereum could become internet's money layer as PayPal issues PYUSD stablecoin as an ERC-20 token
Ripple price could breach the $0.684 resistance level
Ripple (XRP) price has been in a two-day uptrend since August 7, flipping the 100-day EMA into support at $0.6238 before testing the 50-day EMA at $0.6591. If buyer momentum increases, XRP could break above the $0.6840 resistance level before a potential northbound move to the $0.8260 resistance level.
The RSI suggests rising momentum as it moves north, while the histograms are green to show bullish momentum. However, the price strength indicated by both momentum indicators below their midlines is concerning.
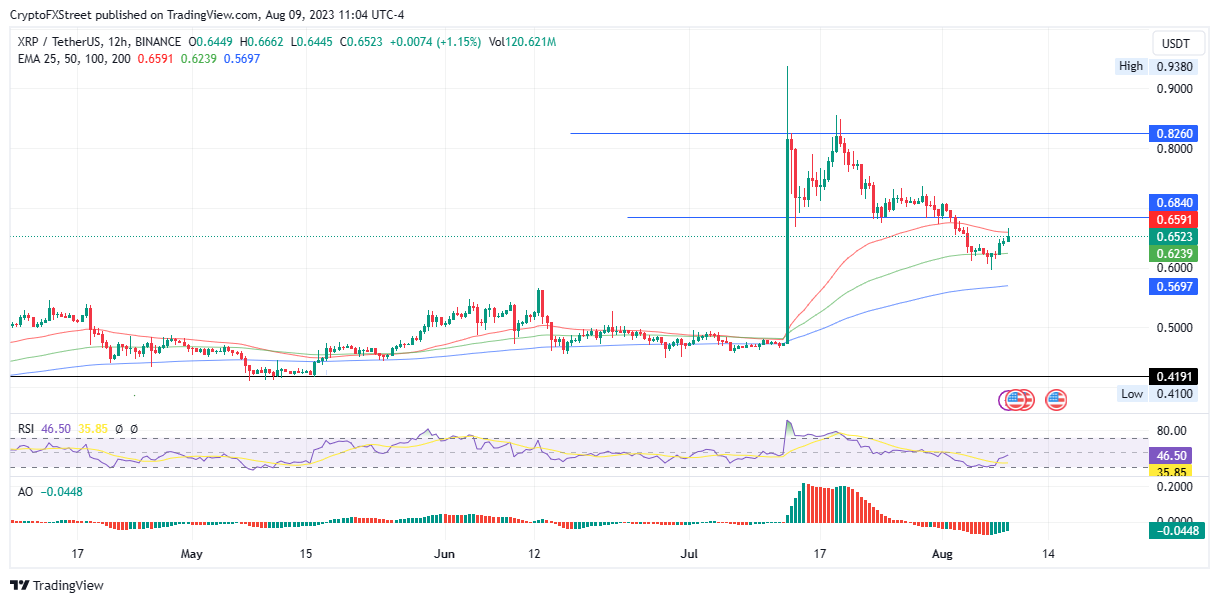
XRP/USDT 12-hour chart
With weak price strength, XRP bears could quickly regain control of the market, sending Ripple price below the 100-day EMA at $0.6238.
In a dire case, the remittance token could go as low as the 200-day EMA at $0.5697, totaling a 10% slump from current price levels.
Also Read: Ripple XRP price rally to $21 target likely, experts support Judge Torres' ruling.
Ripple FAQs
What is Ripple?
Ripple is a payments company that specializes in cross-border remittance. The company does this by leveraging blockchain technology. RippleNet is a network used for payments transfer created by Ripple Labs Inc. and is open to financial institutions worldwide. The company also leverages the XRP token.
What is XRP?
XRP is the native token of the decentralized blockchain XRPLedger. The token is used by Ripple Labs to facilitate transactions on the XRPLedger, helping financial institutions transfer value in a borderless manner. XRP therefore facilitates trustless and instant payments on the XRPLedger chain, helping financial firms save on the cost of transacting worldwide.
What is XRPL?
XRPLedger is based on a distributed ledger technology and the blockchain using XRP to power transactions. The ledger is different from other blockchains as it has a built-in inflammatory protocol that helps fight spam and distributed denial-of-service (DDOS) attacks. The XRPL is maintained by a peer-to-peer network known as the global XRP Ledger community.
What blockchain technology does XRP use?
XRP uses the interledger standard. This is a blockchain protocol that aids payments across different networks. For instance, XRP’s blockchain can connect the ledgers of two or more banks. This effectively removes intermediaries and the need for centralization in the system. XRP acts as the native token of the XRPLedger blockchain engineered by Jed McCaleb, Arthur Britto and David Schwartz.
Author

Lockridge Okoth
FXStreet
Lockridge is a believer in the transformative power of crypto and the blockchain industry.


