- As Bitcoin's average price is in its mid-range, sentiment plummets and returns to the fear zone.
- The crypto market points to lower levels in the short term.
- The consolidation of the current price levels can be extended until the middle of June.
The volatility of the crypto market is falling again after the weekend's bearish episode.
The upward window of opportunity seen last week has closed.
The main moving averages are tilting downwards and forecast in that direction until mid-June.
During 2018 and 2019, the crypto market has already demonstrated its capacity to exhaust the patience of investors, and it seems that it will now put this strategy back into play.
Source: alternative.me
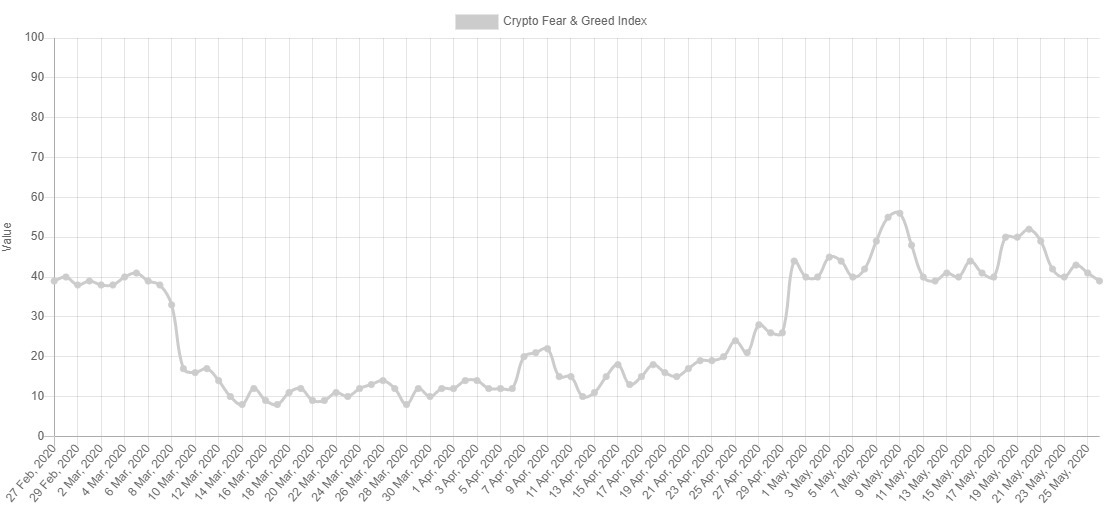
The market sentiment level is shifting towards pessimism, rapidly falling into fear despite the lack of clear price justification.
The average price of BTC/USD over the last 21 days is $9287, about 50% of the historical high, therefore a neutral range. Contrary to what one might expect, the market does not have this perception but rather accentuates the pessimism.
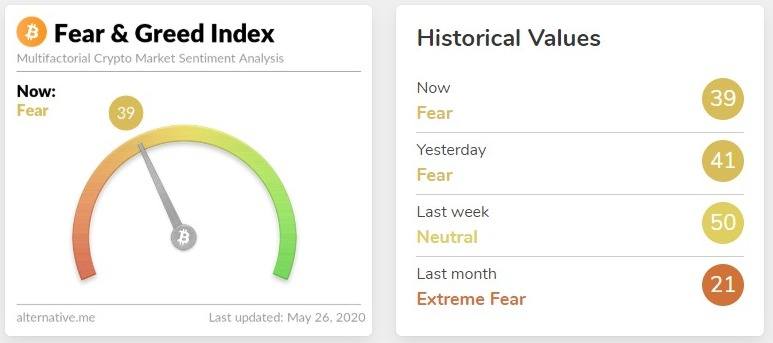
This is clearly reflected in the market sentiment indicator, now falling again and already in the midst of the "fear" zone. Alternative.me's index is now at level 39, a figure not seen since the beginning of the month.
ETH/BTC Daily Chart
The ETH/BTC pair is currently trading at the price level of 0.0227. Yesterday there was another attempt to break the 0.23 level but it failed and today sellers are driving ETH/BTC to look for support in the 50-day exponential moving average. The fastest-moving averages are tilting down and are heading towards the 200-day simple moving average at the 0.0218 level.
Above the current price, the first resistance level is at 0.023, then the second at 0.0242 and the third one at 0.0254.
Below the current price, the first support level is at 0.0226, then the second at 0.022 and the third one at 0.0217.
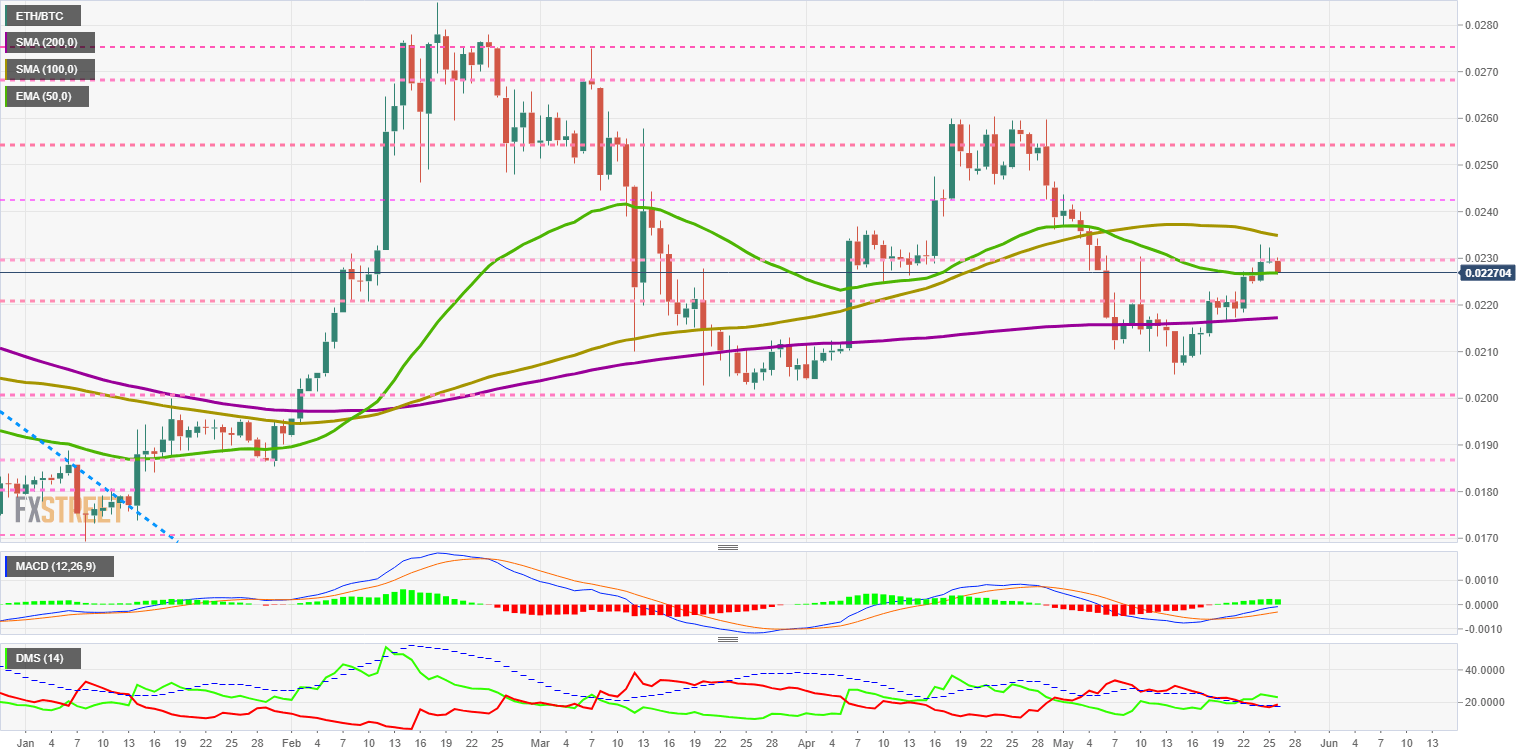
The MACD on the daily chart loses some upward potential when the indicator reaches the neutral level and reflects the difficulty in getting above the price level of 0.023. With this technical structure, the most likely development in the short term is sideways for the price.
The DMI on the daily chart shows the bulls controlling the ETH/BTC pair, although the bears do see an opportunity in the current situation and move upwards above the ADX line.
BTC/USD Daily Chart
The BTC/USD pair is currently trading at the $8999 price level, and after three sessions below the $9000 level, it may try to break out of this psychological level today. The main moving averages are losing their upward profile and are already entering a bearish lateral structure in the short term.
Above the current price, the first resistance level is at $9200, then the second at $9650 and the third one at $10400.
Below the current price, the first support level is at $8750, then the second at $8575 and the third one at $8400.
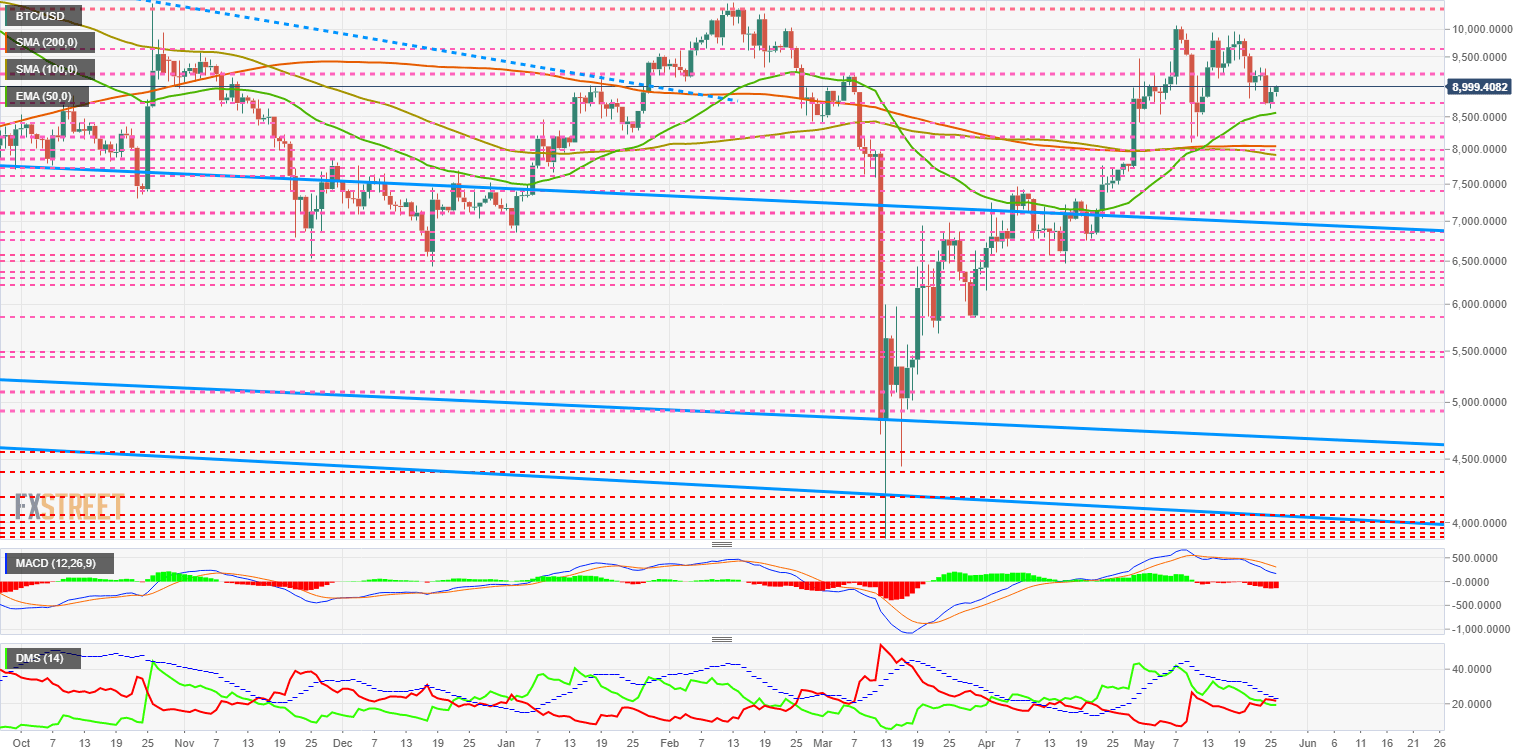
The MACD on the daily chart increases the short-term bearish profile. The movement will continue downward at least until it reaches the neutral level of the indicator, a level that will be contacted approximately during the second week of June.
The DMI on the daily chart shows the bears above the bulls but limited by the presence of the ADX line.
ETH/USD Daily Chart
The ETH/USD pair is currently trading at $203.4 after ten days of holding above the $200 support level.
The 50-day exponential moving average continues to trend higher and reinforces the upside potential as the market improves.
Above the current price, the first resistance level is at $208, then the second at $218 and the third one at $225.
Below the current price, the first support level is at $200, then the second at $195 and the third one at $190.
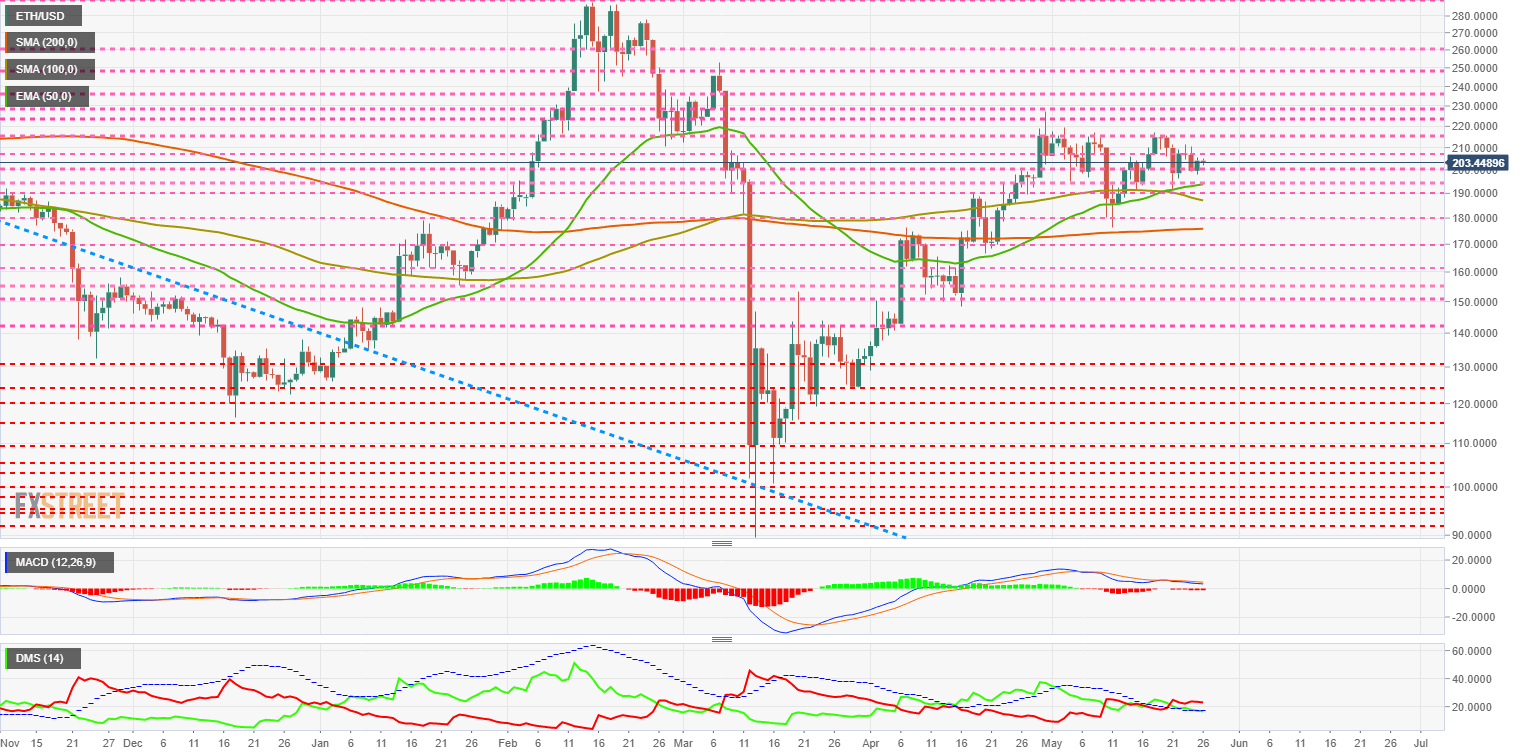
The MACD on the daily chart shows the extreme sluggishness of the market. The profile is slightly bearish on the side, a situation that could last for days.
The DMI on the daily chart shows the bears controlling the pair, although without a definite advantage. The bulls are trying to stay above the ADX line, which would allow the buying side to react quickly if money enters the market actively.
XRP/USD Daily Chart
The XRP/USD pair is currently trading at $0.1945 and continues to move lower after the last attempt to break the resistance at $0.20. Price congestion resistance at $0.20 is reinforced by the presence of the 50-day exponential moving average and the 100-day simple moving average.
The main moving averages on the XRP/USD chart are increasing the downward slope and pointing to the $0.17 level.
Above the current price, the first resistance level is at $0.20, then the second at $0.22 and the third one at $0.237.
Below the current price, the first support level is at $0.19, then the second at $0.18 and the third one at $0.163.
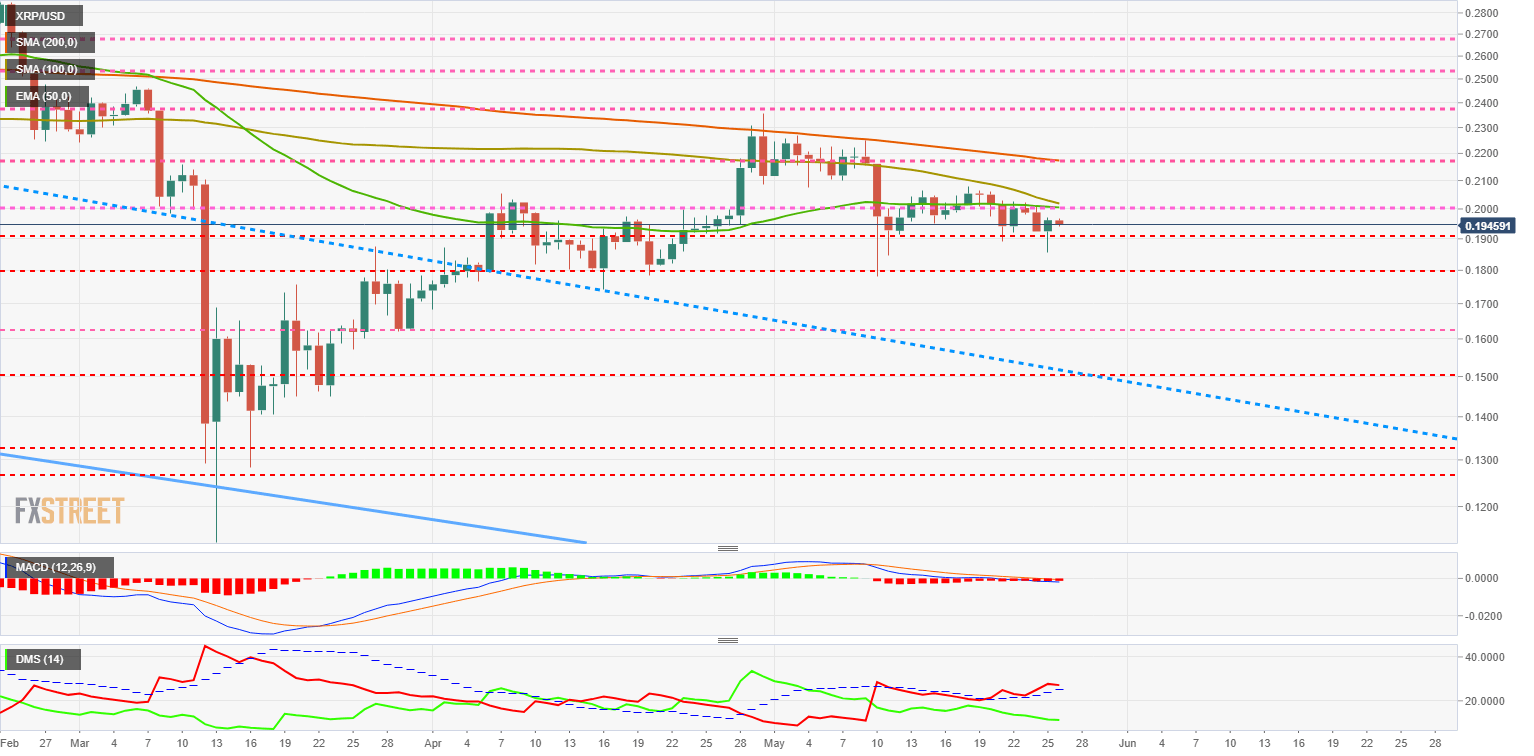
The MACD on the daily chart is already moving in the negative territory of the indicator and increases the possibility of a downward movement of the XRP.
The DMI on the daily chart shows the bears controlling the XRP/USD pair with a significant advantage over the bulls. The bearish side continues to push its position lower.
Information on these pages contains forward-looking statements that involve risks and uncertainties. Markets and instruments profiled on this page are for informational purposes only and should not in any way come across as a recommendation to buy or sell in these assets. You should do your own thorough research before making any investment decisions. FXStreet does not in any way guarantee that this information is free from mistakes, errors, or material misstatements. It also does not guarantee that this information is of a timely nature. Investing in Open Markets involves a great deal of risk, including the loss of all or a portion of your investment, as well as emotional distress. All risks, losses and costs associated with investing, including total loss of principal, are your responsibility. The views and opinions expressed in this article are those of the authors and do not necessarily reflect the official policy or position of FXStreet nor its advertisers. The author will not be held responsible for information that is found at the end of links posted on this page.
If not otherwise explicitly mentioned in the body of the article, at the time of writing, the author has no position in any stock mentioned in this article and no business relationship with any company mentioned. The author has not received compensation for writing this article, other than from FXStreet.
FXStreet and the author do not provide personalized recommendations. The author makes no representations as to the accuracy, completeness, or suitability of this information. FXStreet and the author will not be liable for any errors, omissions or any losses, injuries or damages arising from this information and its display or use. Errors and omissions excepted.
The author and FXStreet are not registered investment advisors and nothing in this article is intended to be investment advice.
Recommended Content
Editors’ Picks

Crypto fraud soars as high-risk addresses on Ethereum, TRON networks receive $278 billion
The cryptocurrency industry is growing across multiple facets, including tokenized real-world assets, futures and spot ETFs, stablecoins, Artificial Intelligence (AI), and its convergence with blockchain technology, as well as the dynamic decentralized finance (DeFi) sector.

Bitcoin eyes $100,000 amid Arizona Reserve plans, corporate demand, ETF inflows
Bitcoin price is stabilizing around $95,000 at the time of writing on Tuesday, and a breakout suggests a rally toward $100,000. The institutional and corporate demand supports a bullish thesis, as US spot ETFs recorded an inflow of $591.29 million on Monday, continuing the trend since April 17.

Meme coins to watch as Bitcoin price steadies
Bitcoin price hovers around $95,000, supported by continued spot BTC ETFs’ inflows. Trump Official is a key meme coin to watch ahead of a stakeholder dinner to be attended by President Donald Trump. Dogwifhat price is up 47% in April and looks set to post its first positive monthly returns this year.

Cardano Lace Wallet integrates Bitcoin, boosting cross-chain capabilities
Cardano co-founder Charles Hoskinson announced Monday that Bitcoin is integrated into the Lace Wallet, expanding Cardano’s ecosystem and cross-chain capabilities. This integration enables users to manage BTC alongside Cardano assets, providing support for multichain functionality.
Bitcoin Weekly Forecast: BTC consolidates after posting over 10% weekly surge
Bitcoin (BTC) price is consolidating around $94,000 at the time of writing on Friday, holding onto the recent 10% increase seen earlier this week.

The Best brokers to trade EUR/USD
SPONSORED Discover the top brokers for trading EUR/USD in 2025. Our list features brokers with competitive spreads, fast execution, and powerful platforms. Whether you're a beginner or an expert, find the right partner to navigate the dynamic Forex market.