Top 3 Price Prediction Bitcoin, Ethereum, Ripple: Market optimism cools down
- Sentiment level plummets 6.6% and takes a significant downward turn.
- Bitcoin exhibits signs of recovering market share in the short term.
- ETH/USD points to the $340 price level as key support as its immediate target.

The consolidation process initiated at the end of last week is continuing, and the euphoric feeling that dominated the market is starting to cool down.
The crypto market is susceptible to sentiment levels since there is no information about projects that is easy to understand by neophytes.
Very few of the people who have capital invested in cryptocurrencies have a deep understanding of the technology and the implications it can have for the future value of a project.
The references are the headlines, often filled with "Bumps", "Pumps" and other emotional headlines.
Technical analysis is the primary reference for the general public, and it is not an easy field of knowledge either.
This market profile is why we can now expect a significant correction in the market's mood, such as the one suffered today by the sentiment indicator published by the site alternative.me, which plummeted 6.6% to the 75 levels and with a possible downward trend of 30% to reach the neutral zone of the sentiment indicator.

The sentiment chart already showed a bearish correction pattern a few days ago.
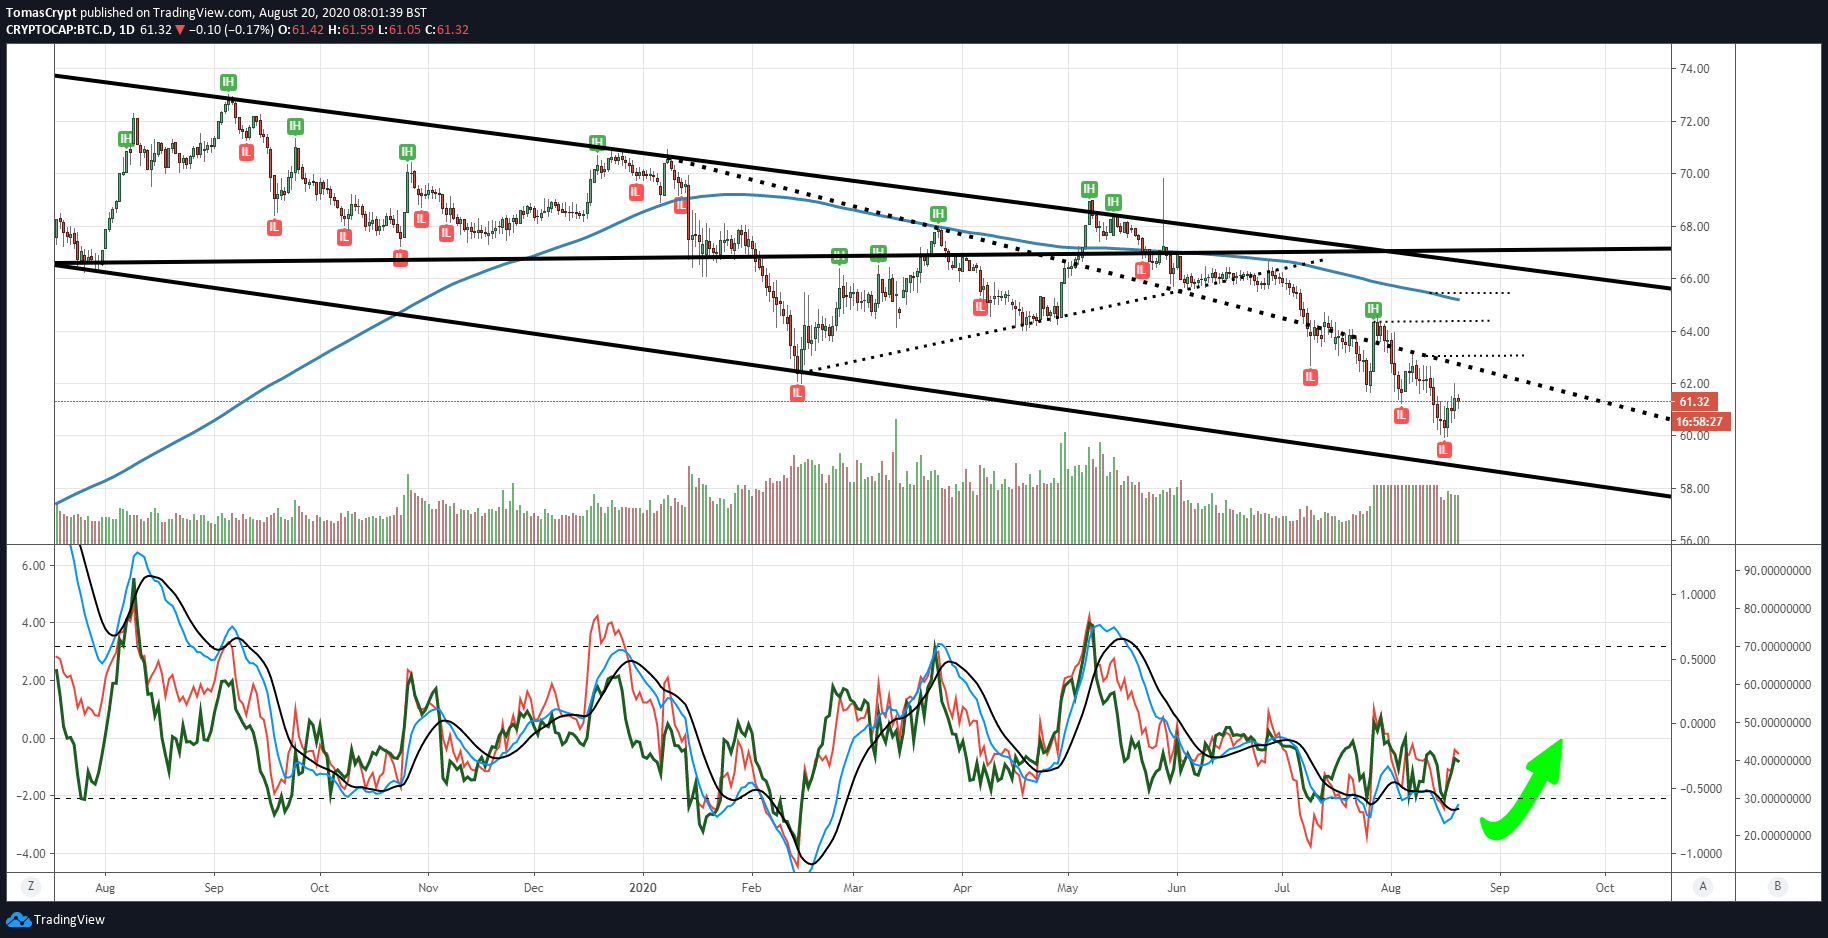
Bitcoin continues to be the big beneficiary of the downward movement, and its dominance chart is beginning to look strongly bullish. This intermarket pattern doesn't mean that it will rise against fiat currencies, but that its value against the Altcoin segment may increase substantially.
ETH/BTC Daily Chart
The ETH/BTC pair is currently trading at 0.0345 and confirms the loss of support at 0.035.
Above the current price, the first resistance level is at 0.035, then the second at 0.0367 and the third one at 0.0372.
Below the current price, the first support level is at 0.0332, then the second at 0.0316 and the third one at 0.0309.
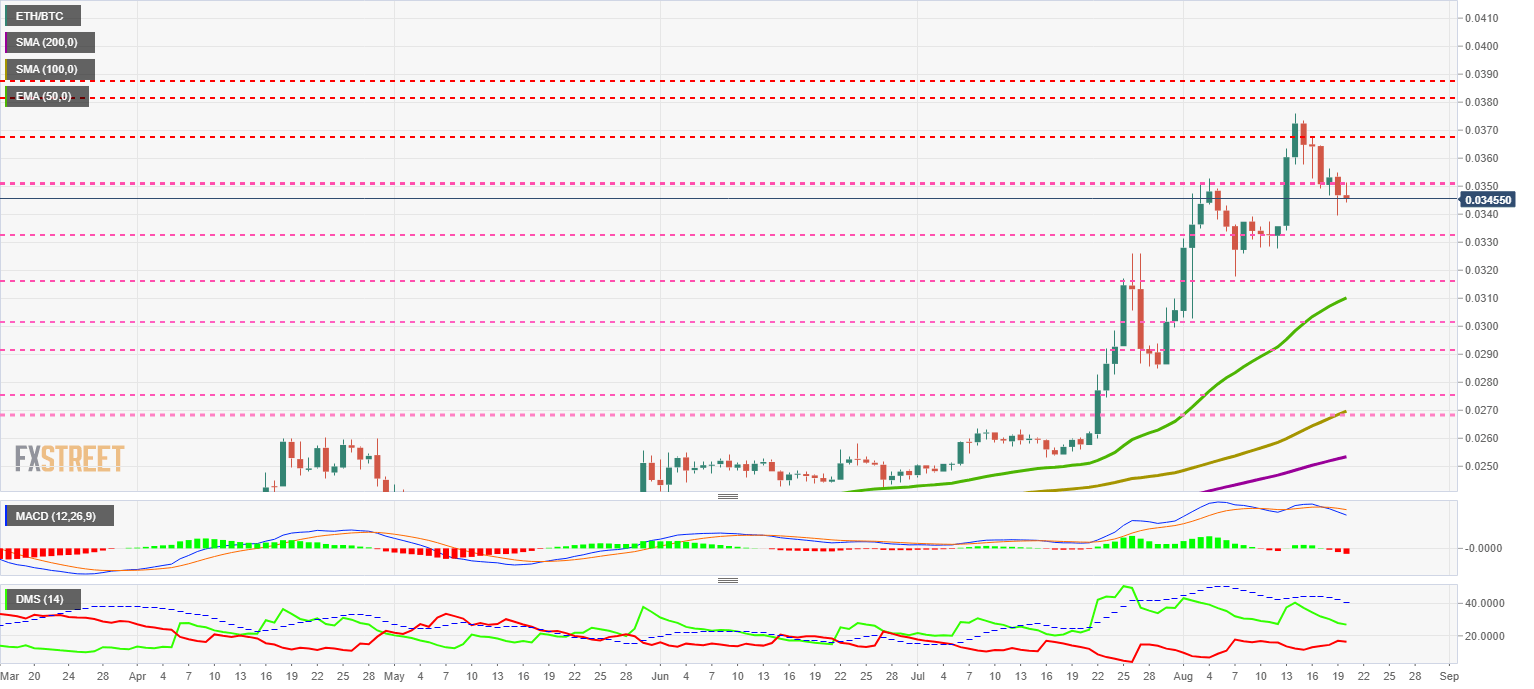
The MACD on the daily chart is increasing the bearish trend line and suggests that the downward momentum will continue.
The DMI on the daily chart shows the bulls are losing strength, but the bears are still not convinced of their power. The consolidation movement will continue at least until both sides of the market meet, at which point market participants will decide on the direction to take.
BTC/USD Daily Chart
The BTC/USD pair is currently trading at the price level of $11745 and is already halfway to the next support level at $11200.
Above the current price, the first resistance level is at $12400, then the second at $14000 and the third one at $17200.
Below the current price, the first support level is at $11200, then the second at $10780 and the third one at $9900.
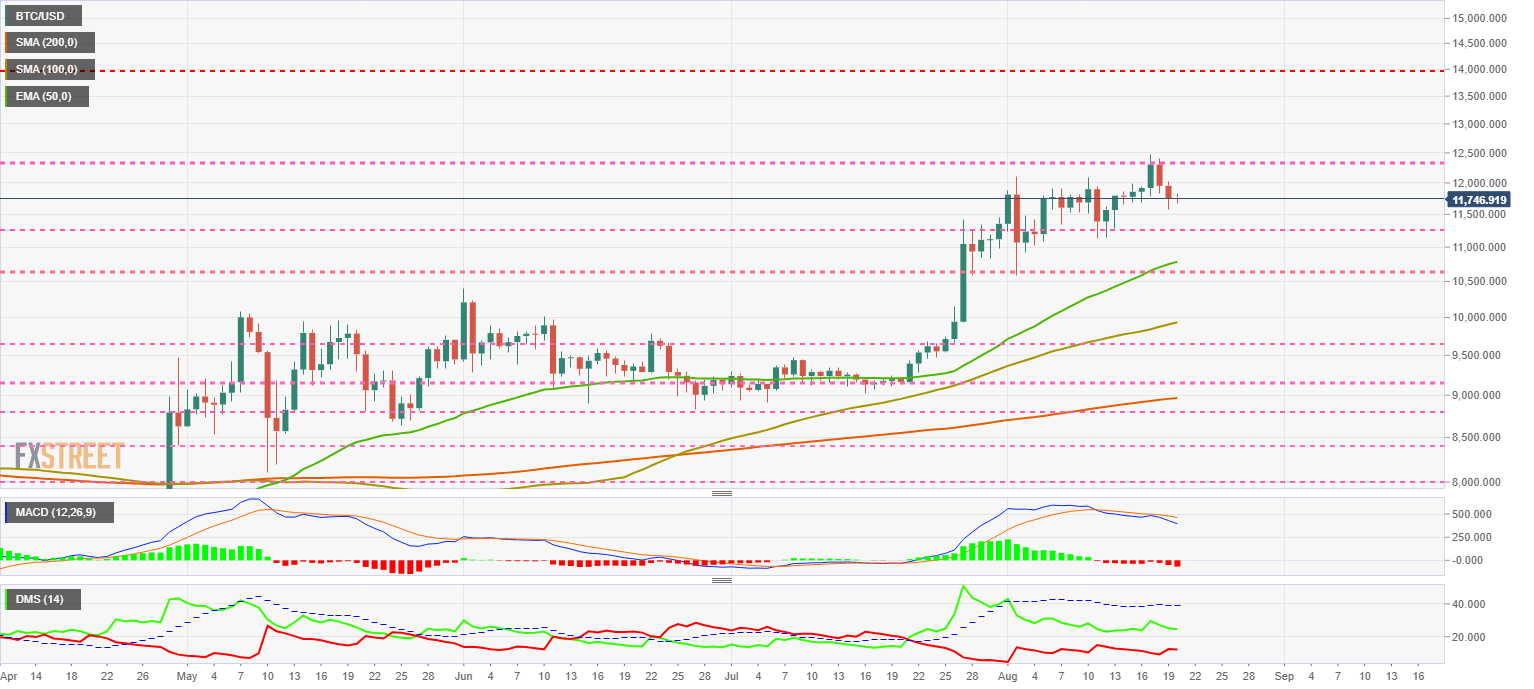
The MACD on the daily chart increases the bearish profile although the moving averages remain very close together and leave a narrow margin open for a possible upward rebound.
The DMI on the daily chart shows bulls and bears maintaining the same level as in previous days, revealing doubts between the two sides of the market.
ETH/USD Daily Chart
The ETH/USD pair is currently trading at the price level of $405.01 and is rushing downward in search of price congestion support at $375.
Above the current price, the first resistance level is at $440, then the second at $460 and the third one at $485.
Below the current price, the first level of support is at $375, then the second at $355 and the third one at $340.
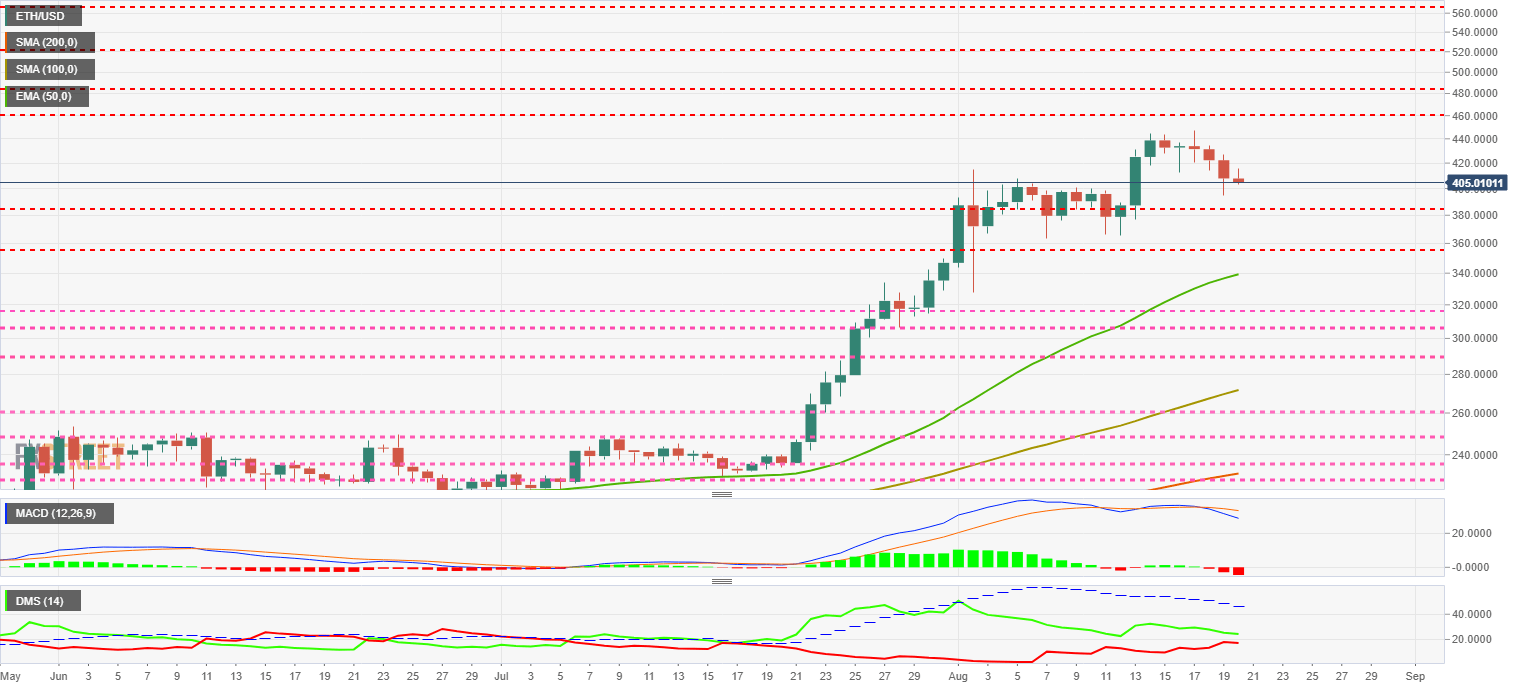
The MACD on the daily chart is accelerating, which increases the bearish profile and complicates the possibility of a possible change in direction.
The DMI on the daily chart shows both sides of the market are closely following each other and could face each other at any moment. Due to the structure of the MACD, it might be a surprise if the bears don't take control of the bulls.
XRP/USD Daily Chart
The XRP/USD pair is currently trading at the price level of $0.2879 and is moving away from the critical level at $0.30.
Above the current price, the first resistance level is at $0.29, then the second at $0.30 and the third one at $0.32.
Below the current price, the first support level is at $0.282, then the second at $0.268 and the third one at $0.255.
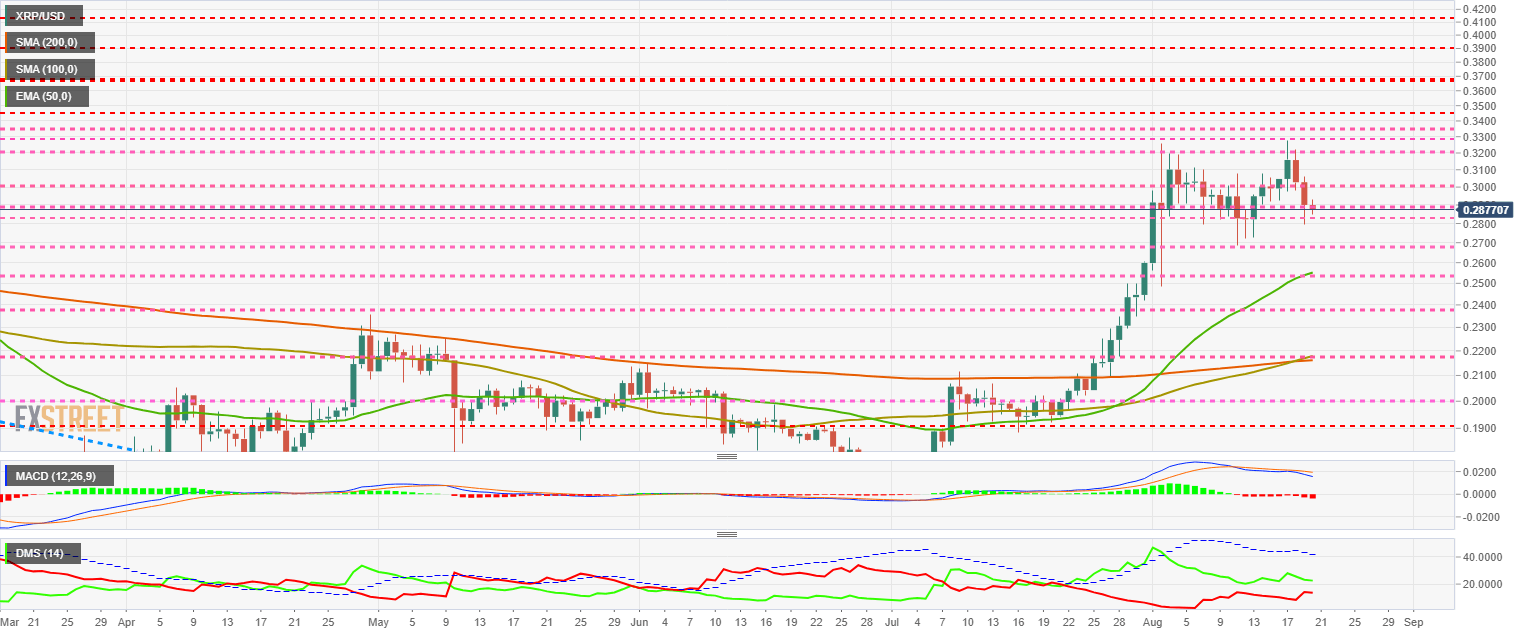
The MACD on the daily chart increases the slope and the gap between the lines, announcing that the downward momentum may last for some time.
The DMI on the daily chart shows bulls and bears close so that they may be facing each other in the coming hours.
Author

Tomas Salles
FXStreet
Tomàs Sallés was born in Barcelona in 1972, he is a certified technical analyst after having completing specialized courses in Spain and Switzerland.


