Top 3 Price Prediction Bitcoin, Ethereum, Ripple: Last recourse for BTC and ETH, but XRP will not yield
- Bitcoin price could slump 10% to the $27,500 range if the crucial line of defense at $29,872 is lost.
- Ethereum price slipping below critical trendline support makes ETH attractive to the June 7 lows of $1,824.
- XRP could record a new range high as Ripple price tests the great highs of July 13 at $0.817.

Bitcoin (BTC) has traders at the edge of their seats, treading along dangerous lines as investors wait for a decisive, tangible move to influence their hand. The confusion also extends to the Ethereum (ETH) price camp where gloom continues to spread. Meanwhile, Ripple (XRP) remains nostalgic for the July 13 trade, and now bulls want to relive it.
Also Read: Traders ask how high heavens could be for Bitcoin price as SEC sets down eight BTC ETF applications.
Bitcoin price on the fence
Bitcoin (BTC) price is on the fence, bordering between falling back into the consolidation range or breaking below and extending south. The $29,872 support level remains critical for BTC, pivoting the price action to determine which way next.
After a brief break below the crucial support, an influx of buyer momentum restored Bitcoin price within the range. This is indicated by the Relative Strength Index (RSI) attempting to make a decisive bend north and stay above 50. A strong foray north by the RSI could compel Bitcoin price to extrapolate to the upside, potentially breaching the $31,500 range high and recording a new local high.
With the right trigger, buying pressure could catapult Bitcoin price to the $31,500 level, denoting a 20% climb from the current level.
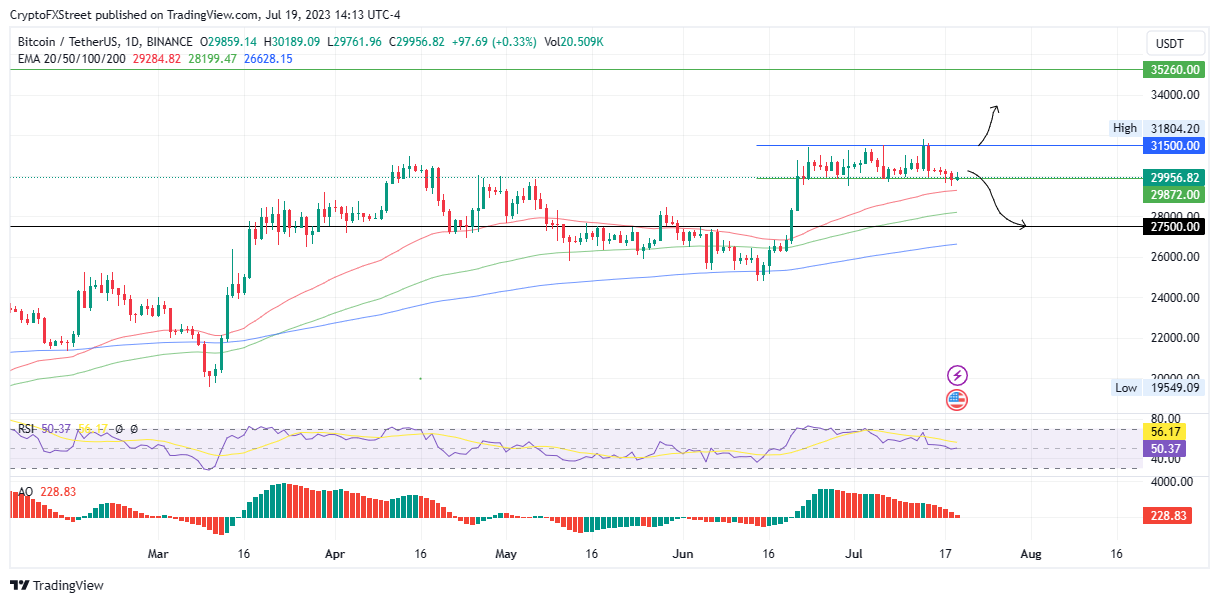
BTC/USDT 1-Day Chart
On the other hand, if buying pressure reduces, bears could seize the opportunity to pull Bitcoin price lower. A daily candlestick close below the 50-day Exponential Moving Average (EMA) of $29,286 would spell doom for BTC, making a retracement to the $27,500 level likely.
Also Read: Bitcoin price stays above $30,000; Cathie Wood assures increased confidence in BTC.
Ethereum price slips below crucial support
Ethereum (ETH) price has slipped below the uptrend line in a move that threatens investors' profit prospects. Unless ETH restores above this bullish trendline, the Proof-of-Stake (PoS) token faces a breakdown below the 50- and 100-day EMAs at $1,871 and $1,835, respectively, to tag the July 7 lows of around $1,824.
The Awesome Oscillators (AO) bolster the case for the bears, as the histograms of this momentum indicator are flashing red in huge volumes to show bears fastening their grip on ETH.
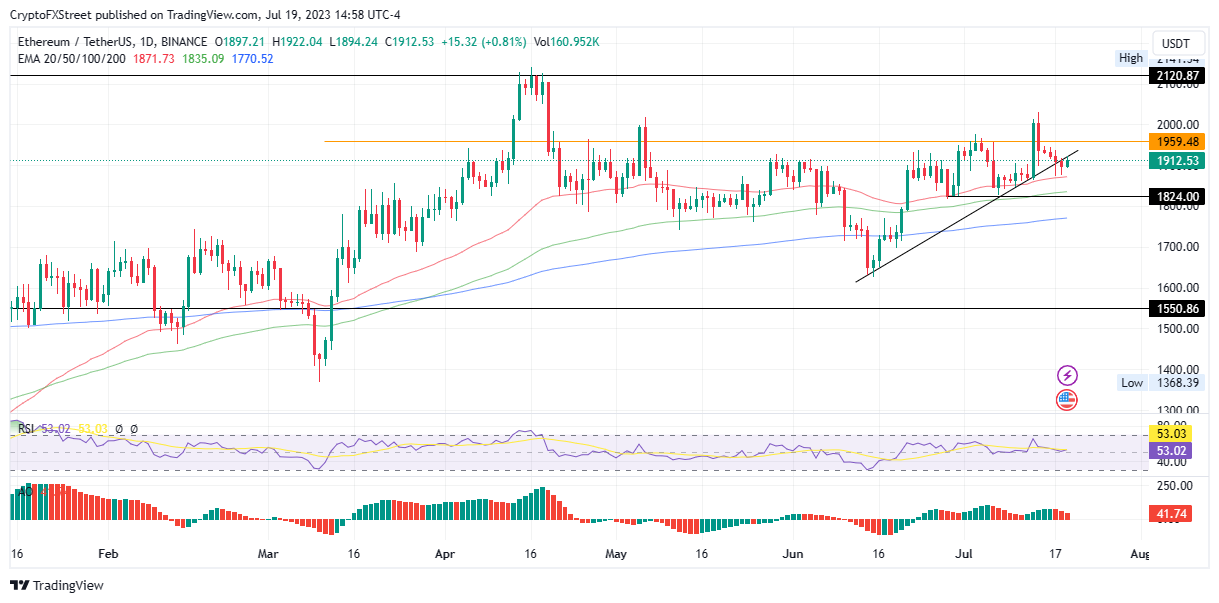
ETH/USDT 1-day chart
Conversely, if more bulls approach the scene, the ensuing buying pressure could pull Ethereum price back above the uptrend line. A sustained move above this bullish consolidation trendline could see ETH hit $1,959 soon.
In a highly bullish case, the largest altcoin by trading volume could shatter the psychological $2,000 level and target the $2,120 range high next. Such a move would see ETH holders rake in up to 10% profits.
Ripple price will not yield.
Ripple (XRP) price is recovering from the dip recorded after the dissipation of hype following Ripple Lab's partial win against the US Securities and Exchange Commission (SEC) on July 13. At the time, the remittance token recorded an intra-day high of $0.938 before returning to a daily close of $0.818.
At the time of writing, Ripple price is trying to shatter this local peak and extend a neck north. An increase in buying pressure could see this strategy pan out, clearing the path for a possible rally to the $0.938 range high. Such a move would constitute a 15% climb.
The RSI at 77 is still rising, suggesting increasing momentum that could bode well for Ripple price. While others may interpret this RSI range as overbought, it is worth mentioning that Welles Wilder only confirms an actual sell signal when the RSI crosses the 70 mark to the downside. As long as the RSI is northbound – even if it is above 70 – the asset could record more gains backed by significant buyer momentum.
The AO indicator also bolsters the case for the bulls, recording deep green histograms in the positive territory to show that bulls are in control.
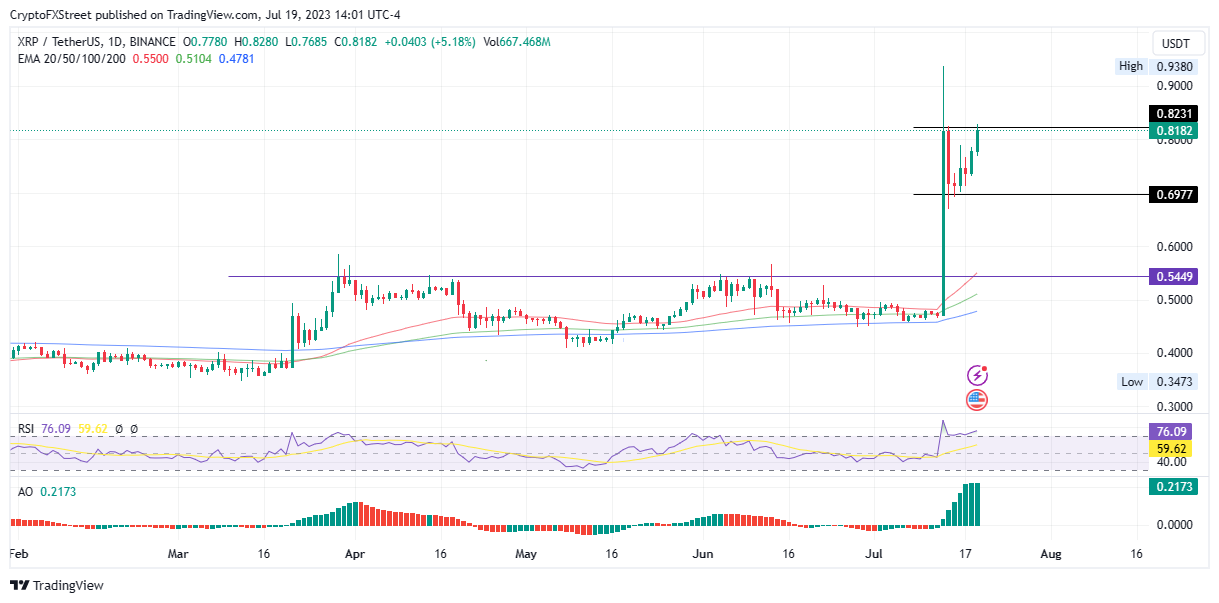
XRP/USDT 1-Day Chart
If profit-taking begins, Ripple price could pull back with a potential revisit of the $0.697 range before another foray north.
Like this article? Help us with some feedback by answering this survey:
Author

Lockridge Okoth
FXStreet
Lockridge is a believer in the transformative power of crypto and the blockchain industry.


