- Bitcoin price has risen above the $25,586 resistance level as it gingerly treads a recovery higher.
- Ethereum price recoups losses, but the $1,800 psychological level could be difficult to overcome.
- Ripple price decisively breaks above a bearish channel at $0.4600, but growing headwinds leave a lot to be determined.
Bitcoin (BTC) price is leading the rest of the market, including Ethereum (ETH) and Ripple (XRP) prices, north, with momentum indicators painting a bullish picture. However, investors must exercise caution from here on out, with a lot still to be determined.
Also Read: US CPI annual inflation comes in above expectations at 3.7%, Bitcoin price rests above $26,000
Bitcoin price forging an uptrend
Bitcoin (BTC) price is forging an uptrend after two successive green candlesticks. While the outlook appears promising, investors should exercise caution lest the recovery prove fake.
For the bullish perspective, the Relative Strength Index (RSI) moving north points to rising momentum, which is corroborated by the green candlesticks of the Awesome Oscillator (AO). Furthermore, RSI is converging bullishly with Bitcoin price adding weight to prospects of an uptrend. This is indicated by BTC price’s recent streak of lower lows, which were not mirrored by the RSI.
Furthermore, BTC has retained above the last higher low of the previous uptrend – the June lows at $24,800. Given this key level has held, the market structure remains long-term positive, making a recovery a real possibility.
In an uptrend scenario, Bitcoin price could break past the resistance confluence between the 50- and 200-day Simple Moving Averages (SMA) before confronting the 100-day SMA, with the three moving averages converging around the psychological $28,000. This makes this obstacle a formidable one. A confirmed breach above the $28,838 resistance level would increase the odds for a continuation north.
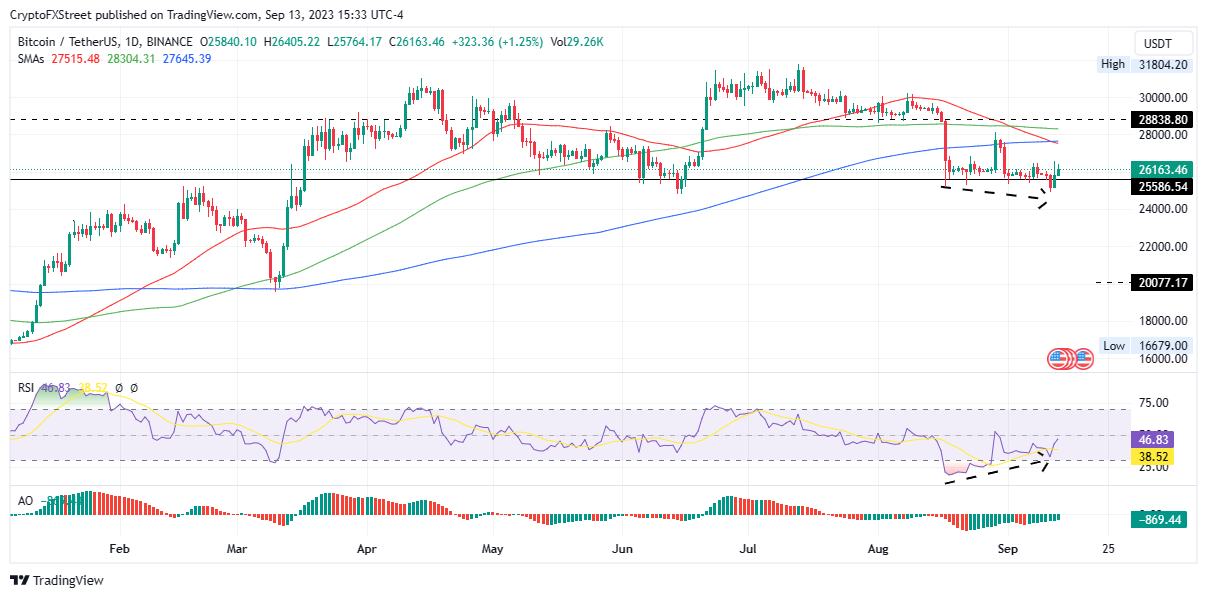
BTC/USDT 1-day chart
On the flipside, a strong resistance barricade hovers above Bitcoin price, indicated by the 50-day SMA (short-term moving average) crossing below the 200-day SMA (longer-term moving average). Any move up to this cluster of MAs will likely be met with technical selling pressure.
This technical formation is also what is known as a ‘death cross’ which is when the 50-day SMA crosses below the 200-day SMA, and signals oncoming bearishness in the market. However, it is not a textbook version of the pattern as the 200-day SMA is rising as the 50 crosses below it. Ideally, for a five-star set-up, both MAs should be falling.
A bearish reversal could, nevertheless, send Bitcoin price back below $25,586, or in a dire case, to test the $24,000 psychological range. The June lows at $24,800 are a key make-or-break level, and if breached could flip the script for the lead crypto.
Ethereum price could have trouble overcoming the $1,800 hurdle
Ethereum (ETH) price is recovering, like BTC, but overhead pressure seems to be gathering up. To the upside, the 50-day SMA could reject ETH, or worse, the confluence between the 100- and 200-day SMA, at around the $1,800 psychological level, present a formidable resistance level. A break above this hurdle could see ETH tag $1,919 – levels last tested around mid-July.
The RSI is northbound, converging bullishly with price, and bolstered by the green bars of the AO’s histograms, adding credence to the bullish thesis.
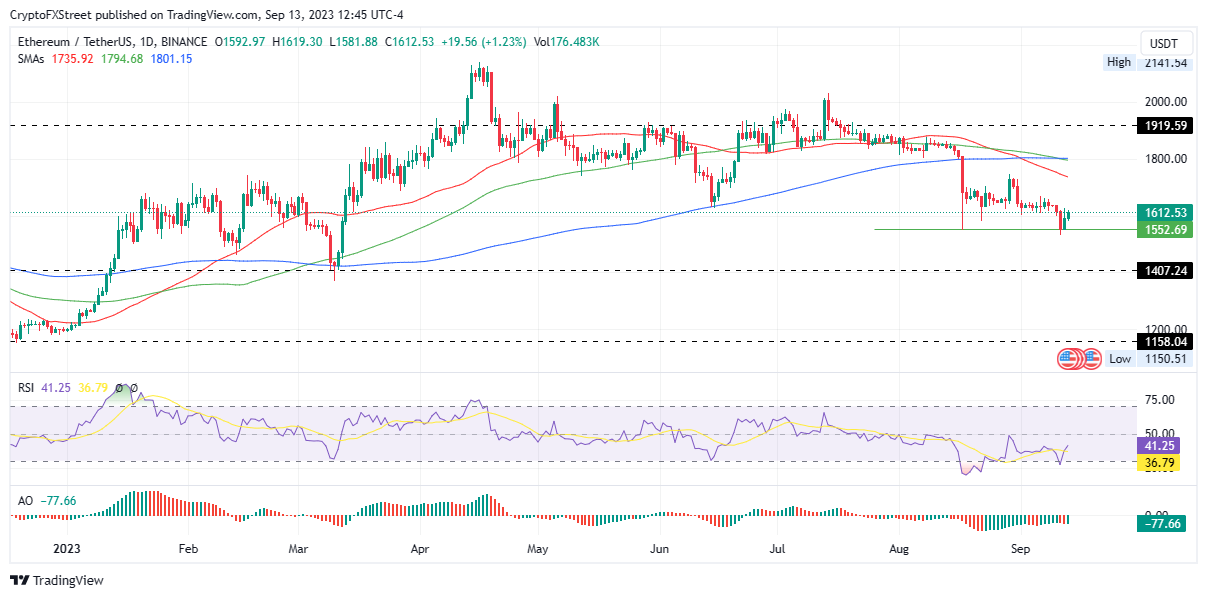
ETH/USDT 1-day chart
On the other hand, Ethereum price still risks a correction, considering the pattern of lower lows and lower highs since the April highs were lost. Bears still have a presence in the ETH market, as indicated by the mixed AO histogram.
Should the optimistic forecast fail, Ethereum price could break below the $1,552 support level, or in the dire case, extend toward the $1,407 support level, thereby reclaiming the March 11 lows. This would indicate a 12% slump below current levels.
Also Read: Total Crypto market cap falls below $1 trillion as whales dump Bitcoin and Ethereum
Ripple price faces strong headwinds after a bullish breakout
Ripple (XRP) price successfully broke out from a bearish falling channel, which it then pulled back for a retest and final leg-up goodbye. If it continues to hold above this channel for the second consecutive day it could turn the upper boundary of the descending channel into support at $0.4600.
However, Ripple price faces strong opposition, with the 200-, 100-, and 50-day SMAs, acting as resistance levels to cap the upside potential for XRP at $0.5107, $0.5666, and $0.5753 levels respectively.
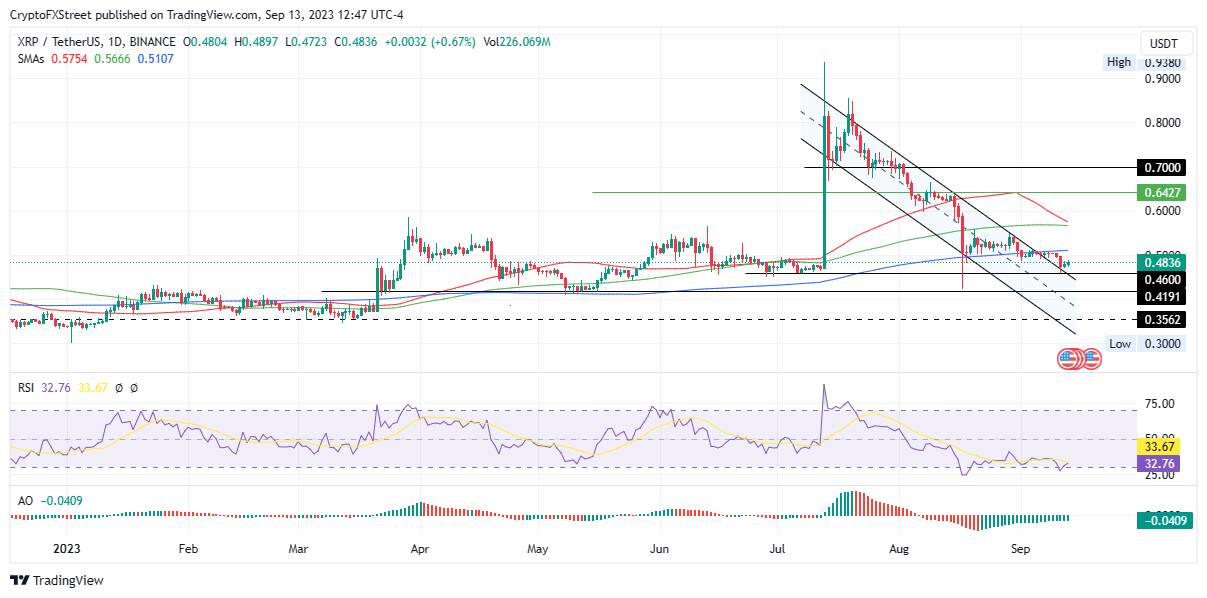
XRP/USDT 1-day chart
Conversely, early profit takers could cut the budding uptrend short, sending Ripple price back into the confines of the descending channel. A decisive break below the midline of the channel at $0.4191 would invalidate the bullish outlook, possibly sending XRP to the channel’s lower boundary at $0.3562. Such a move would indicate a 25% crash below current levels.
Also Read: Ripple Price Forecast: XRP holders need to prepare for 25% crash
Cryptocurrency metrics FAQs
What is circulating supply?
The developer or creator of each cryptocurrency decides on the total number of tokens that can be minted or issued. Only a certain number of these assets can be minted by mining, staking or other mechanisms. This is defined by the algorithm of the underlying blockchain technology. Since its inception, a total of 19,445,656 BTCs have been mined, which is the circulating supply of Bitcoin. On the other hand, circulating supply can also be decreased via actions such as burning tokens, or mistakenly sending assets to addresses of other incompatible blockchains.
What is market capitalization?
Market capitalization is the result of multiplying the circulating supply of a certain asset by the asset’s current market value. For Bitcoin, the market capitalization at the beginning of August 2023 is above $570 billion, which is the result of the more than 19 million BTC in circulation multiplied by the Bitcoin price around $29,600.
What is trading volume?
Trading volume refers to the total number of tokens for a specific asset that has been transacted or exchanged between buyers and sellers within set trading hours, for example, 24 hours. It is used to gauge market sentiment, this metric combines all volumes on centralized exchanges and decentralized exchanges. Increasing trading volume often denotes the demand for a certain asset as more people are buying and selling the cryptocurrency.
What is funding rate?
Funding rates are a concept designed to encourage traders to take positions and ensure perpetual contract prices match spot markets. It defines a mechanism by exchanges to ensure that future prices and index prices periodic payments regularly converge. When the funding rate is positive, the price of the perpetual contract is higher than the mark price. This means traders who are bullish and have opened long positions pay traders who are in short positions. On the other hand, a negative funding rate means perpetual prices are below the mark price, and hence traders with short positions pay traders who have opened long positions.
Information on these pages contains forward-looking statements that involve risks and uncertainties. Markets and instruments profiled on this page are for informational purposes only and should not in any way come across as a recommendation to buy or sell in these assets. You should do your own thorough research before making any investment decisions. FXStreet does not in any way guarantee that this information is free from mistakes, errors, or material misstatements. It also does not guarantee that this information is of a timely nature. Investing in Open Markets involves a great deal of risk, including the loss of all or a portion of your investment, as well as emotional distress. All risks, losses and costs associated with investing, including total loss of principal, are your responsibility. The views and opinions expressed in this article are those of the authors and do not necessarily reflect the official policy or position of FXStreet nor its advertisers. The author will not be held responsible for information that is found at the end of links posted on this page.
If not otherwise explicitly mentioned in the body of the article, at the time of writing, the author has no position in any stock mentioned in this article and no business relationship with any company mentioned. The author has not received compensation for writing this article, other than from FXStreet.
FXStreet and the author do not provide personalized recommendations. The author makes no representations as to the accuracy, completeness, or suitability of this information. FXStreet and the author will not be liable for any errors, omissions or any losses, injuries or damages arising from this information and its display or use. Errors and omissions excepted.
The author and FXStreet are not registered investment advisors and nothing in this article is intended to be investment advice.
Recommended Content
Editors’ Picks

Bitcoin Weekly Forecast: BTC nosedives below $95,000 as spot ETFs record highest daily outflow since launch
Bitcoin price continues to edge down, trading below $95,000 on Friday after declining more than 9% this week. Bitcoin US spot ETFs recorded the highest single-day outflow on Thursday since their launch in January.

Bitcoin crashes to $96,000, altcoins bleed: Top trades for sidelined buyers
Bitcoin (BTC) slipped under the $100,000 milestone and touched the $96,000 level briefly on Friday, a sharp decline that has also hit hard prices of other altcoins and particularly meme coins.

Solana Price Forecast: SOL’s technical outlook and on-chain metrics hint at a double-digit correction
Solana (SOL) price trades in red below $194 on Friday after declining more than 13% this week. The recent downturn has led to $38 million in total liquidations, with over $33 million coming from long positions.

SEC approves Hashdex and Franklin Templeton's combined Bitcoin and Ethereum crypto index ETFs
The SEC approved Hashdex's proposal for a crypto index ETF. The ETF currently features Bitcoin and Ethereum, with possible additions in the future. The agency also approved Franklin Templeton's amendment to its Cboe BZX for a crypto index ETF.

Bitcoin: 2025 outlook brightens on expectations of US pro-crypto policy
Bitcoin (BTC) price has surged more than 140% in 2024, reaching the $100K milestone in early December. The rally was driven by the launch of Bitcoin Spot Exchange Traded Funds (ETFs) in January and the reduced supply following the fourth halving event in April.

Best Forex Brokers with Low Spreads
VERIFIED Low spreads are crucial for reducing trading costs. Explore top Forex brokers offering competitive spreads and high leverage. Compare options for EUR/USD, GBP/USD, USD/JPY, and Gold.