Top 3 Price Prediction Bitcoin, Ethereum, Ripple: How sustainable is the recent crypto spring
- Bitcoin price triggers ascending triangle breakout with 21% upside, but bulls are unlikely to follow through.
- Ethereum price retests the daily supply zone, extending from $3,241 to $3,412 but lacks momentum to continue the ascent.
- Ripple price marches toward its next target at $0.91 after successfully flipping the $0.85 hurdle.

Bitcoin price has revealed a massive surge in buying pressure, leading to a significant breakout. This development has allowed plenty of altcoins to trigger an exponential uptrend. While Ethereum faces a hurdle, Ripple seems to be heading higher.
Bitcoin price breaks out
Bitcoin price unfolded in an ascending triangle, obtained by connecting the four equal highs at $44,418 and four higher lows formed since January 22. This technical formation forecast a 21% upswing, obtained by measuring the distance between the first swing high and swing low to the breakout point at $44,418.
On March 27, BTC broke through this hurdle, triggering the 21% ascent to $53,855. While bullish, Bitcoin price needs to successfully retest the $44,418 support level and waddle through the 200-day Simple Moving Average (SMA) at $48,292 and the weekly supply zone, ranging from $45,550 to $51,860.
Investors need to exercise caution, therefore, as a retracement might be around the corner. As for the extent of this pullback, market participants can expect BTC to retest the $44,418 level. A break below that could knock BTC down to $42,082, a newly formed support area.
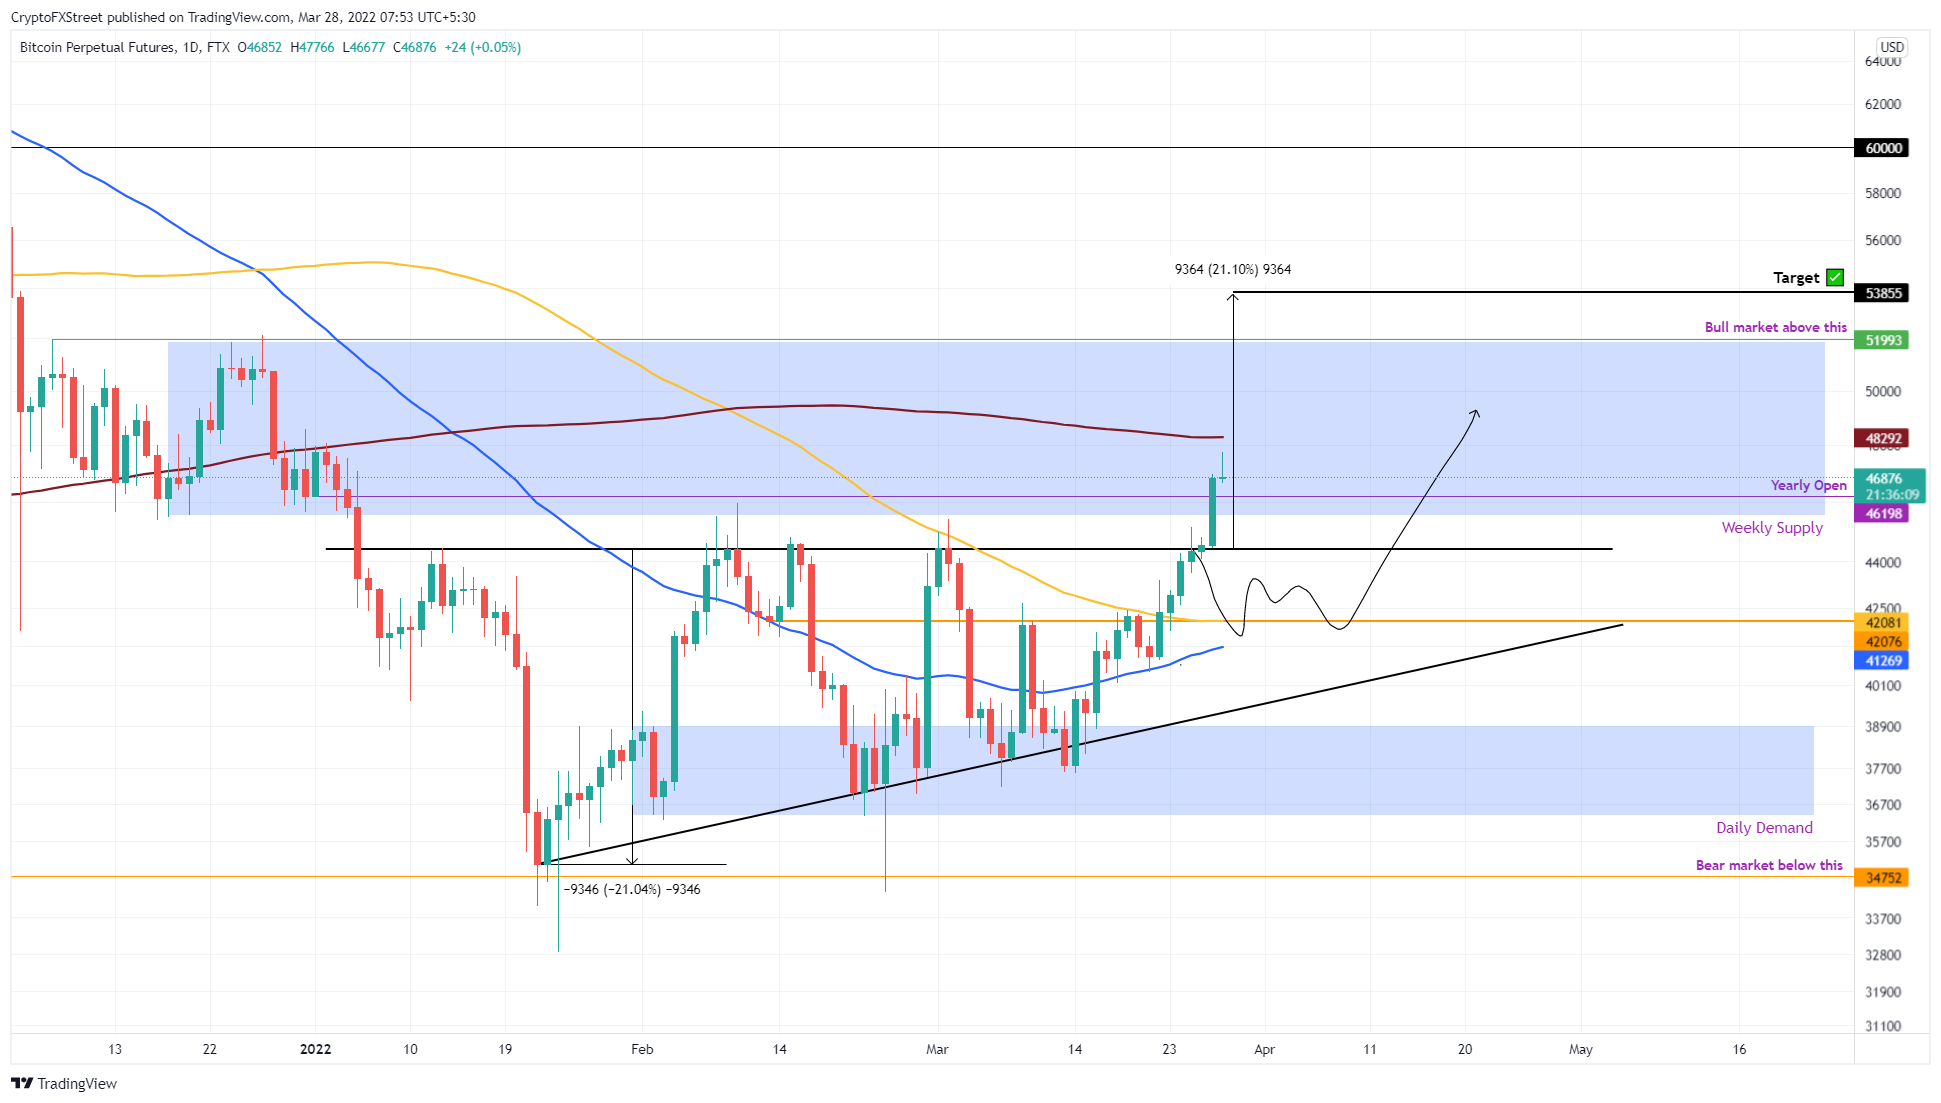
BTC/USD 1-day chart
While things are looking up for Bitcoin price, a daily candlestick close below the $36,398 support level will invalidate the bullish thesis. This move will open the path to the $35,000 support level, aka the last line of defense.
A breakdown of this barrier could trigger a crash to $30,000 or lower.
Ethereum price has more hurdles to breach
Ethereum price formed a demand zone, extending from $2,820 to $2,966 before rallying 18%. This move is currently piercing the daily supply zone, ranging from $3,241 to $3,412, where it will likely face some headwinds.
Therefore, market participants should expect a minor retracement to the 100-day SMA at $3,051 or the demand zone below it. However, if ETH continues to plow through the hurdles to the upside, it could rally another 5% before encountering the 200-day SMA at $3,488.
Beyond this barrier, ETH needs to shatter the $3,585 hurdle, which is likely where the upside is capped for the altcoin.
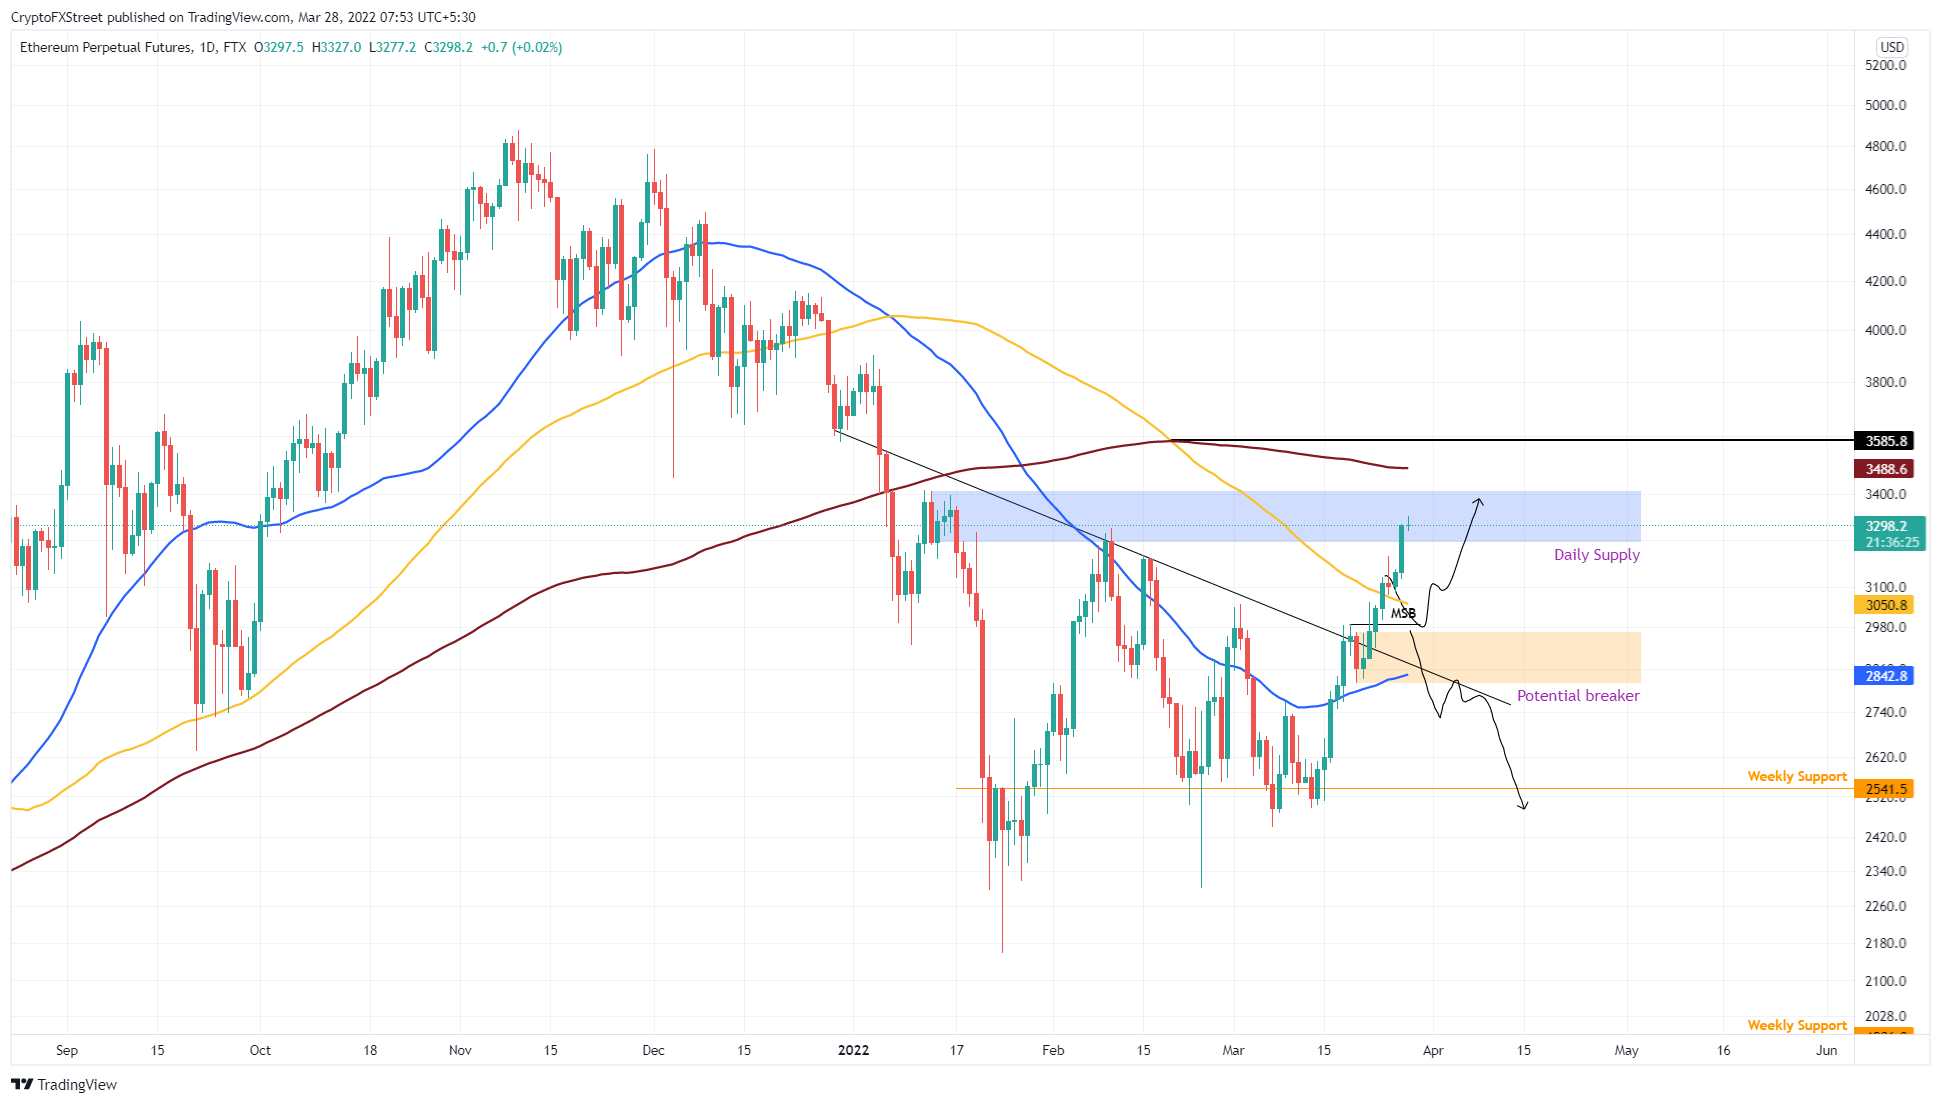
ETH/USD 1-day chart
On the other hand, if Ethereum price produces a daily candlestick close below $2,820, it will invalidate the bullish thesis by flipping the $2,820 to $2,966 demand zone into a breaker. In such a case, investors can expect ETH to retest the $2,541 support level.
Ripple price cuts through noise
Ripple price has been flourishing since its breakout from a bullish pennant on March 11. The initial leg-up pushed XRP to retest $0.85 as a first target.
Since then, Ripple price retraced briefly, allowing bulls to build momentum for the next rally. So far, XRP price has pushed past the $0.85 resistance barrier and is eying a retest of the $0.91 ceiling.
Flipping the $0.91 level into a support floor will trigger the next leg-up, where XRP price attempts to retest the $1 psychological level. In total, this move would constitute a 15% upswing from the current position.
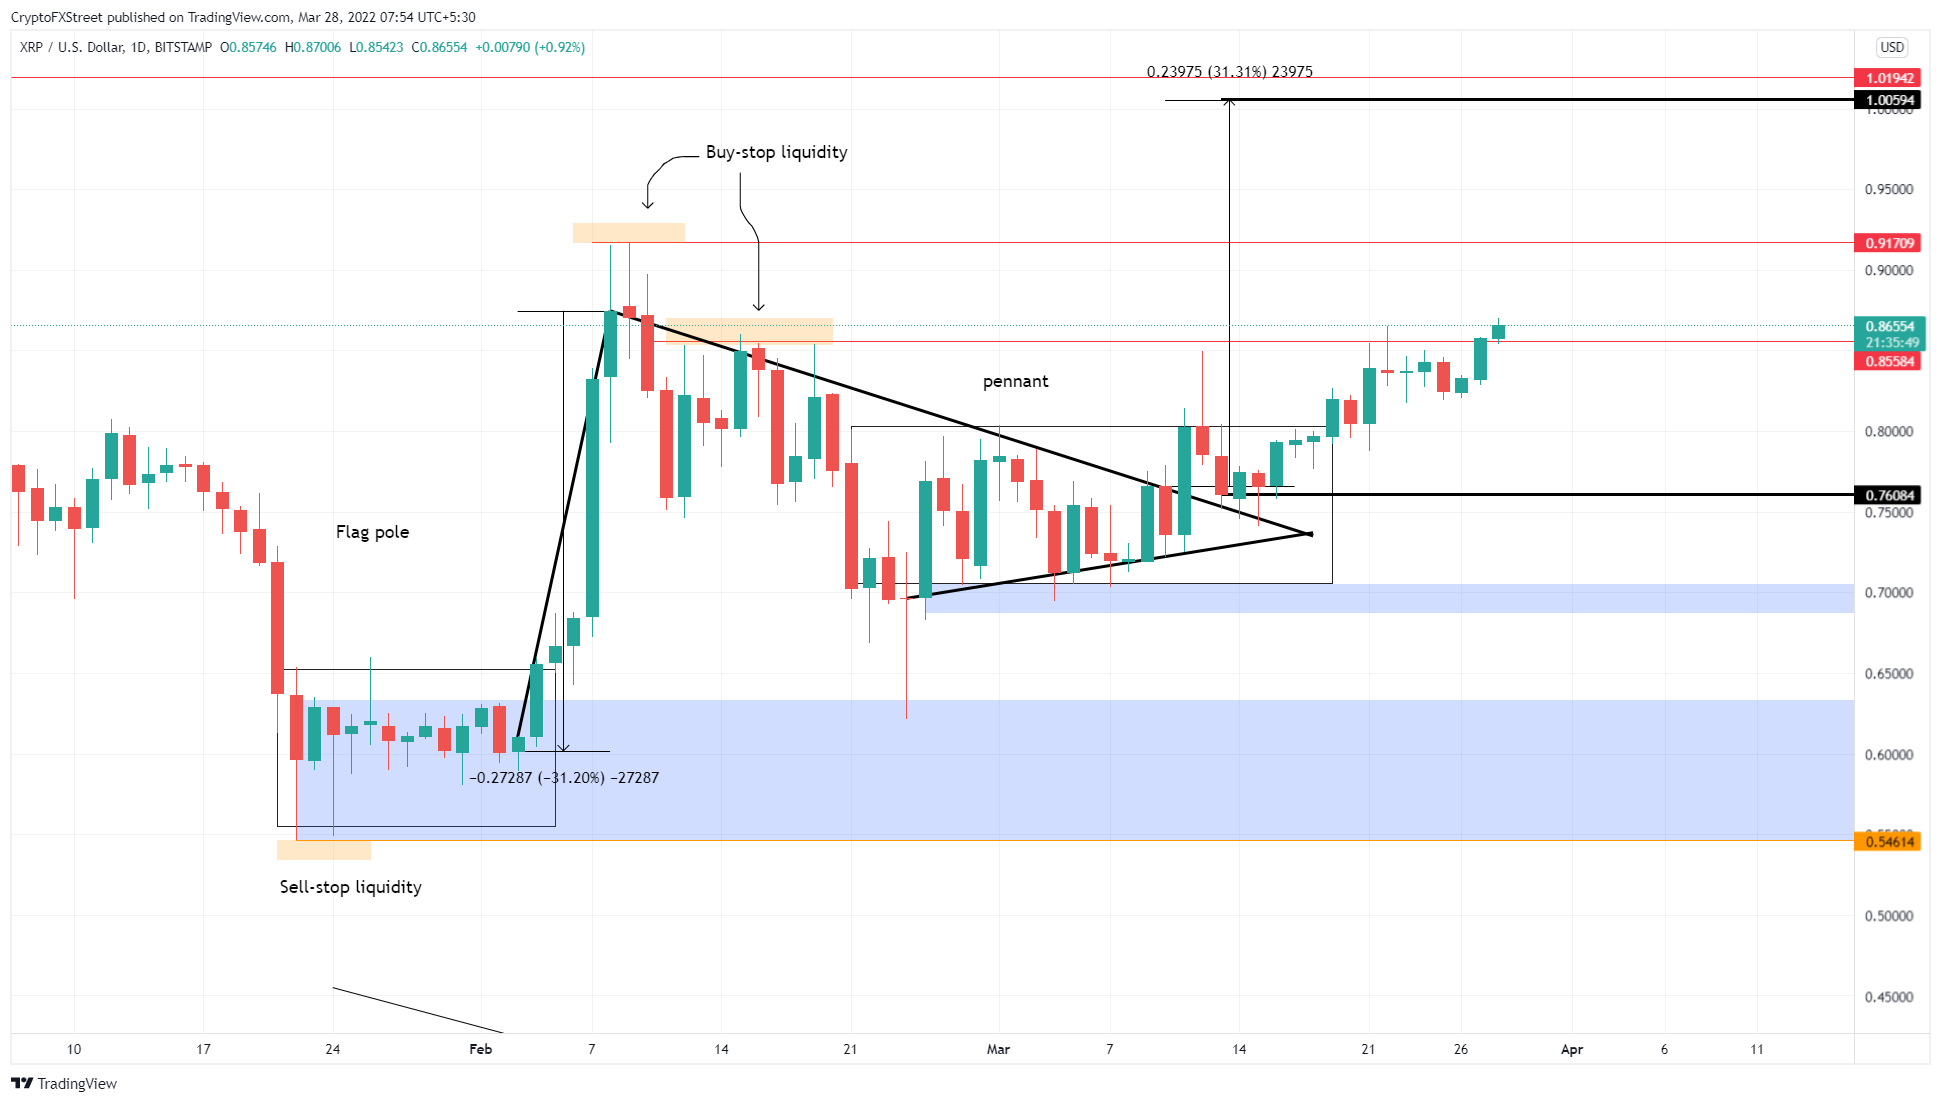
XRP/USD 1-day chart
While an uptrend for Ripple price makes sense, investors need to watch the $0.85 support level. A breakdown of this barrier could trigger a crash to $0.76, which will be the deciding factor between consolidation or a bull rally.
Author

Akash Girimath
FXStreet
Akash Girimath is a Mechanical Engineer interested in the chaos of the financial markets. Trying to make sense of this convoluted yet fascinating space, he switched his engineering job to become a crypto reporter and analyst.


