- Ethereum takes over from Bitcoin and bets on increasing its market share beyond 10%.
- Bitcoin runs out of strength to face a scenario of multiple technical resistances.
- Ripple is still weak but could surprise on the upside in the next few days.
This week we started the crypto market coverage with Ethereum showing a lot of desire to take their part of the business.
Last week, Bitcoin took the lead, but it couldn't get above $10000 or enter a new level of dominance above 68%.
Ethereum sends a bullish signal to the market today and moves in the high range of the consolidation level of the last few days. The daily chart's ETH/USD cross shows a solid bullish pattern and validates the upward movement.
XRP shows once again that it is in other technical phase and barely improves a few cents and remains in the range of $0.20.
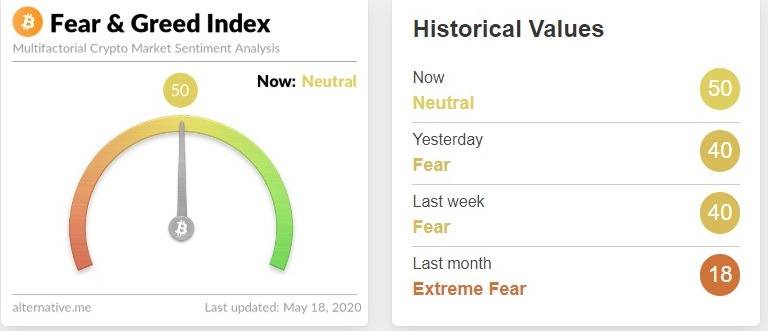
Source: alternative.me
The market sentiment level improves to the 50 levels (Neutral) as Ethereum sets to lead the next uptrend.
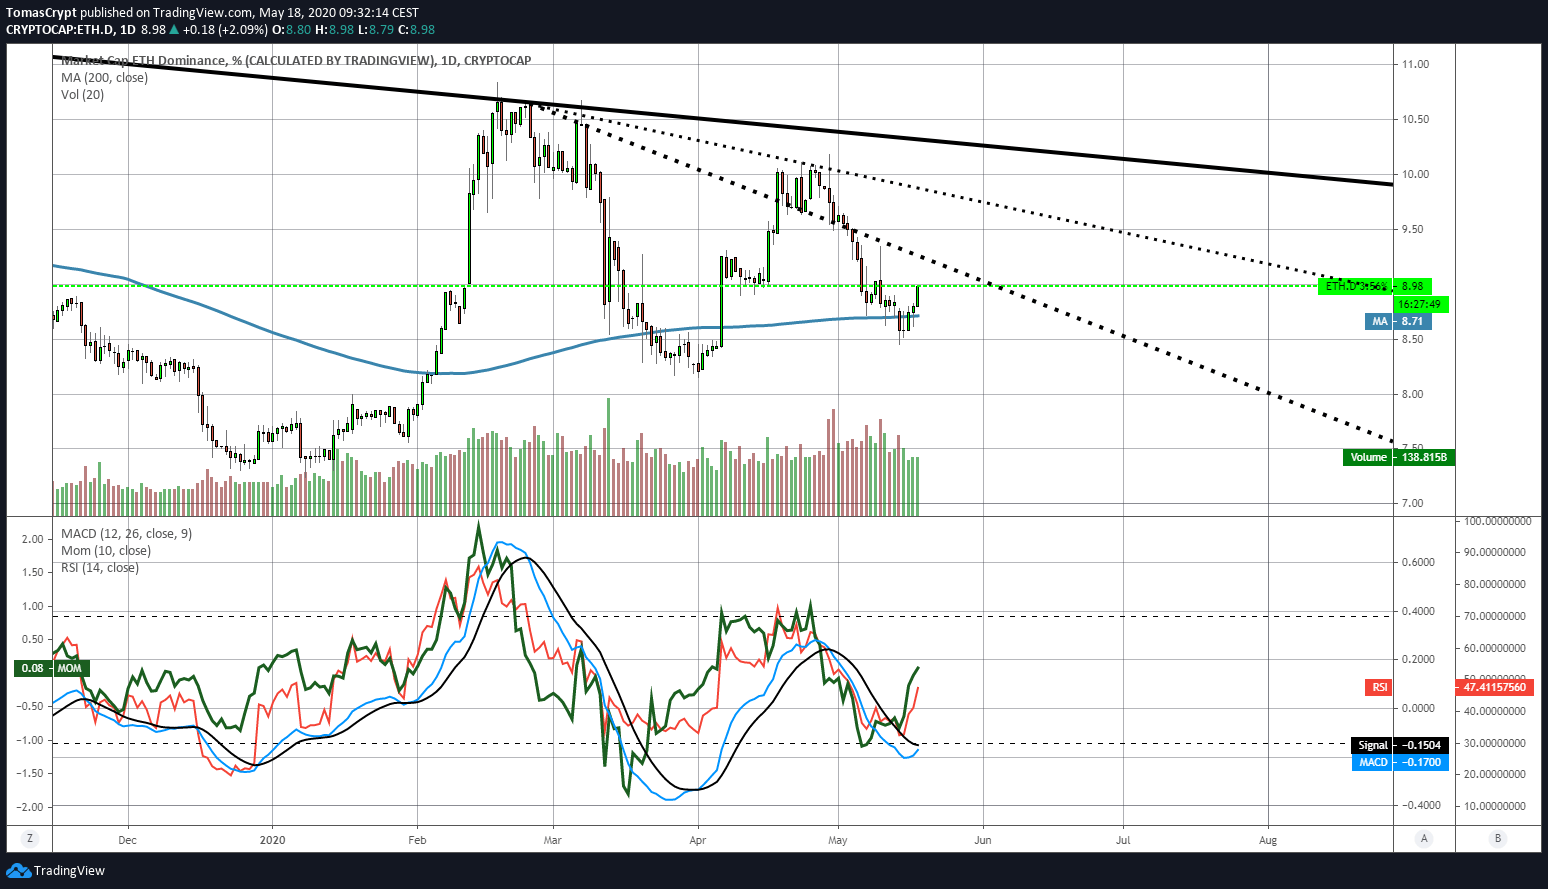
Ethereum's dominance chart reinforces the bullish scenario with a significant upward movement that takes it to the 8.97% market share level. Resistance to the advance is at 9.20%, then the second at 9.80% and the third at 10.3%.
ETH/BTC Daily Chart
The ETH/BTC pair is currently trading at the price level of 0.0219 and is trading above the 200-day simple moving average. The 100-day simple moving average and the 50-day exponential moving average extend their influence to the 0.024 level, so this is the first big hurdle to beat.
Above the current price, the first resistance level is at 0.022, then the second at 0.0228 and the third one at 0.024.
Below the current price, the first support level is at 0.0215, then the second at 0.0203 and the third one at 0.0196.
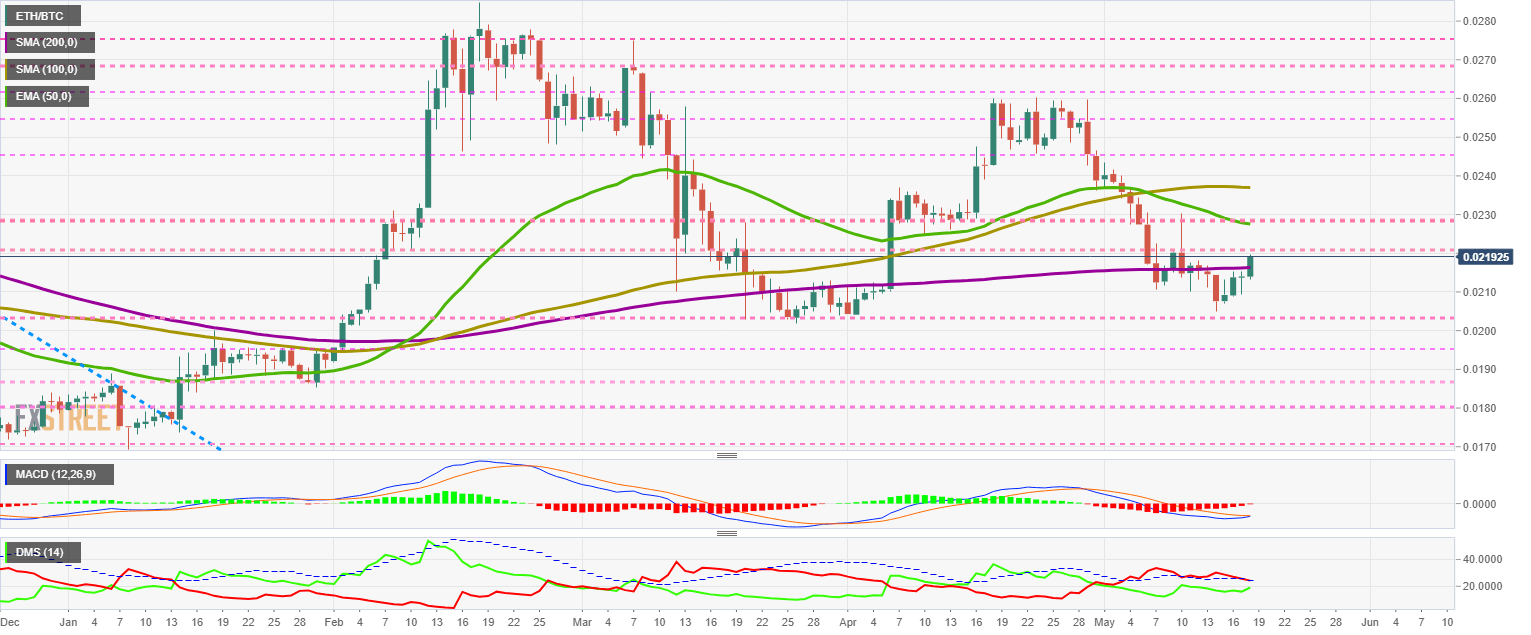
The MACD on the daily chart shows a bullish cross developing that needs an upbeat tone to continues to succeed.
The DMI on the daily chart shows the bulls losing support from the ADX line and disabling the bearish pattern. The bulls are rushing upwards and could take control of the pair in two days.
BTC/USD Daily Chart
The BTC/USD pair is currently trading at the price level of $9781 after failing to break above $10000 over the weekend. Bitcoin has very strong resistance up to the $11250 level and may need a break on the way. BTC/USD has been on a steady uptrend since early March.
Above the current price, the first resistance level is at $10000, then the second at $10300 and the third one at $10700.
Below the current price, the first support level is at $9700, then the second at $9200 and the third one at $8750.
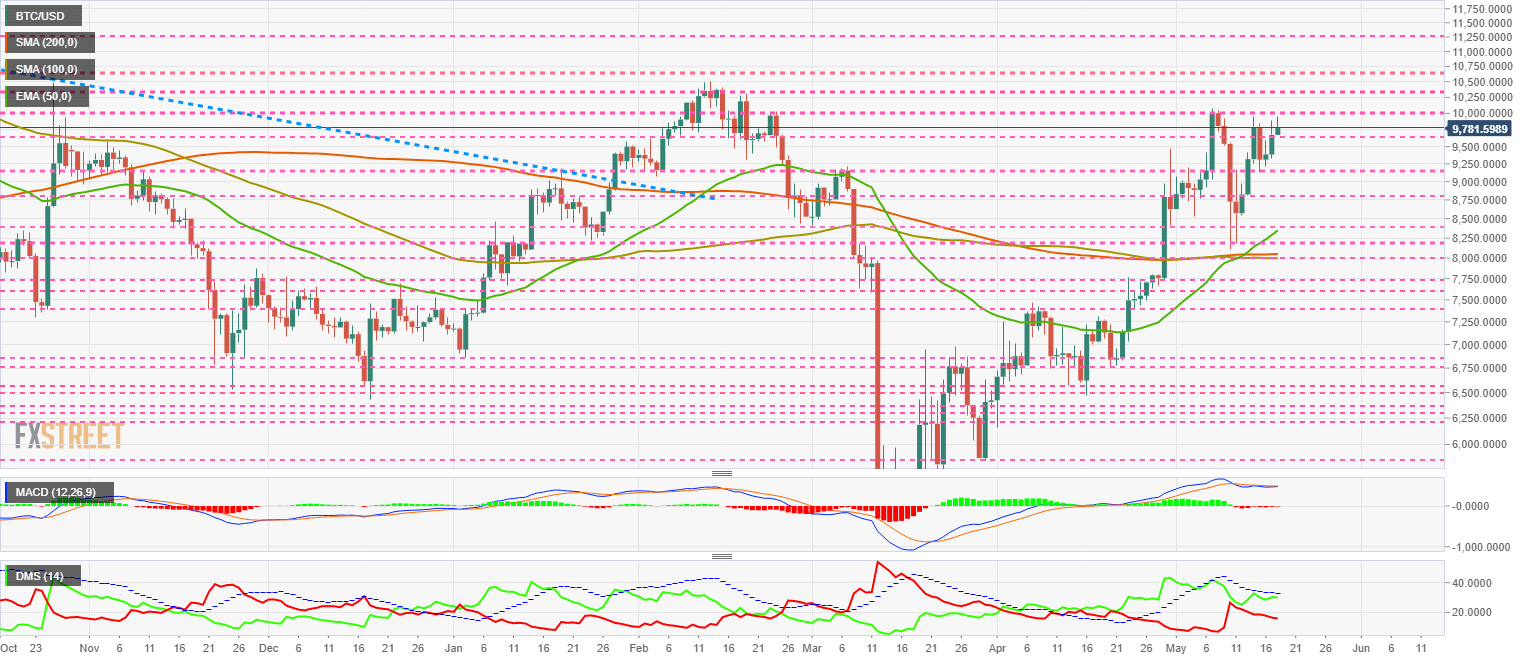
The MACD on the daily chart shows a structure typical of an overbought moment. The moving averages show a flat profile while the momentum remains at very favourable levels.
The DMI on the daily chart shows bulls unable to break the ADX line. Bears continue their slight downward trend for another day.
ETH/USD Daily Chart
The ETH/USD pair is currently trading at $214 and points to be the main attraction of the week. Ether has significant technical resistance beyond the $260 level.
Above the current price, the first resistance level is at $225, then the second at $230 and the third one at $238.
Below the current price, the first support level is at $208, then the second at $200 and the third one at $195.
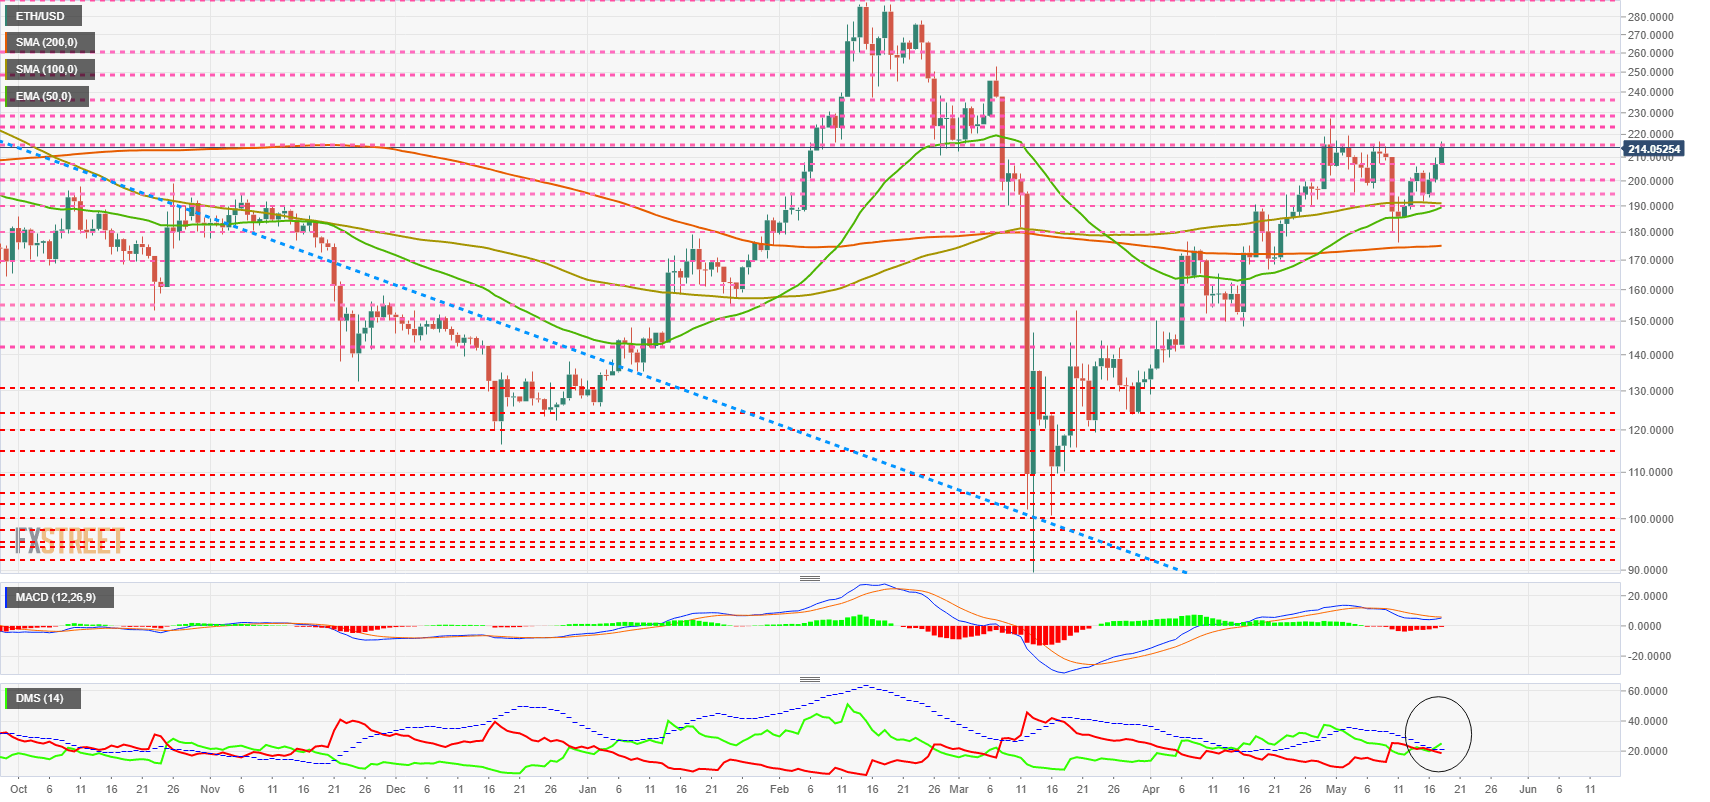 The MACD on the daily chart shows a bullish cross in progress, which will require a further upside to finish it properly.
The DMI on the daily chart shows the activation of a bullish pattern, as the bulls are over the ADX line. Bears move down and repeat the mid-April structure.
XRP/USD Daily Chart
The XRP/USD pair is currently trading at $0.205 and is above the 50-day exponential moving average. The 100-day and 200-day simple moving averages continue to be very steep. The XRP needs to be above $0.25 to have a chance of turning around the current situation.
Above the current price, the first resistance level is at $0.214, then the second at $0.218 and the third one at $0.238.
Below the current price, the first support level is at $0.20, then the second at $0.19 and the third one at $0.17.
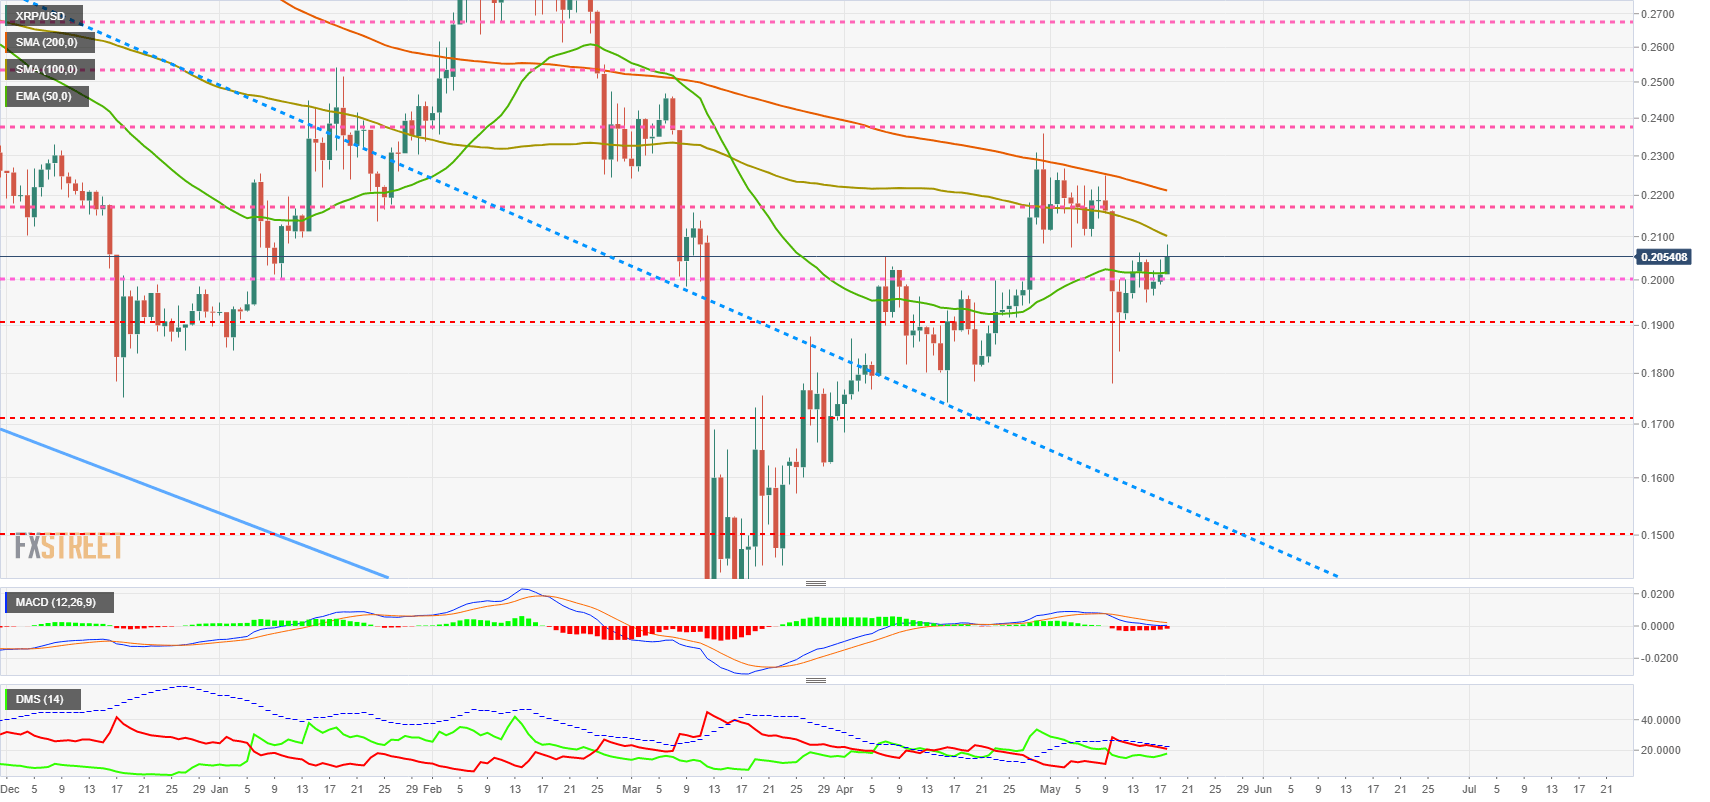
The MACD on the daily chart shows a bearish structure that reaches the neutral level of the indicator today. The MACD on the daily chart shows a bearish structure that reaches today's neutral level.
The DMI on the daily chart shows bears unable to break the ADX line. The bulls are moving fast upwards and could announce a bullish surprise in the coming days.
Information on these pages contains forward-looking statements that involve risks and uncertainties. Markets and instruments profiled on this page are for informational purposes only and should not in any way come across as a recommendation to buy or sell in these assets. You should do your own thorough research before making any investment decisions. FXStreet does not in any way guarantee that this information is free from mistakes, errors, or material misstatements. It also does not guarantee that this information is of a timely nature. Investing in Open Markets involves a great deal of risk, including the loss of all or a portion of your investment, as well as emotional distress. All risks, losses and costs associated with investing, including total loss of principal, are your responsibility. The views and opinions expressed in this article are those of the authors and do not necessarily reflect the official policy or position of FXStreet nor its advertisers. The author will not be held responsible for information that is found at the end of links posted on this page.
If not otherwise explicitly mentioned in the body of the article, at the time of writing, the author has no position in any stock mentioned in this article and no business relationship with any company mentioned. The author has not received compensation for writing this article, other than from FXStreet.
FXStreet and the author do not provide personalized recommendations. The author makes no representations as to the accuracy, completeness, or suitability of this information. FXStreet and the author will not be liable for any errors, omissions or any losses, injuries or damages arising from this information and its display or use. Errors and omissions excepted.
The author and FXStreet are not registered investment advisors and nothing in this article is intended to be investment advice.
Recommended Content
Editors’ Picks

Dogecoin and Bitcoin Cash Price Prediction: Funding rates decrease indicate weakness in DOGE and BCH
Dogecoin and Bitcoin Cash registered 3% and 8% losses on Tuesday following increased selling pressure from the futures market. The decline comes amid large-cap cryptos like Bitcoin, Ether and XRP, holding still with slight gains.

XRP could sustain rally amid growing ETF and SEC vote prospects
Ripple flaunted a bullish outlook, trading at $2.1505 on Tuesday. Investor risk appetite has continued to grow since the middle of last week, propping XRP for a sustainable upward move triggered by the swift decision by US President Donald Trump to suspend reciprocal tariffs for 90 days.

VeChain Price Forecast: VET bulls aim for a double-digit rally
VeChain price hovers around $0.023 on Tuesday after breaking above a falling wedge pattern the previous day; a breakout of this pattern favors the bulls. Bybit announced on Monday that VET would be listed on its exchange. Moreover, the technical outlook suggests rallying ahead, targeting double-digit gains.
Dogecoin, Shiba Inu and Fartcoin price prediction if Bitcoin crosses $100K this week
The meme coin market fell sharply on Monday, shedding 4.8% in market capitalization to settle at $49.25 billion, according to data compiled from CoinGecko. The sell-off coincided with increased volatility across broader crypto markets while investors rotated funds into Bitcoin briefly tested $85,000.

Bitcoin Weekly Forecast: Market uncertainty lingers, Trump’s 90-day tariff pause sparks modest recovery
Bitcoin (BTC) price extends recovery to around $82,500 on Friday after dumping to a new year-to-date low of $74,508 to start the week. Market uncertainty remains high, leading to a massive shakeout, with total liquidations hitting $2.18 billion across crypto markets.

The Best brokers to trade EUR/USD
SPONSORED Discover the top brokers for trading EUR/USD in 2025. Our list features brokers with competitive spreads, fast execution, and powerful platforms. Whether you're a beginner or an expert, find the right partner to navigate the dynamic Forex market.