- Bitcoin price shows a correction in play after the MRI flashed a red ‘one’ cycle top signal.
- Ethereum shows a strong trend continuation while the rest of the market experiences a minor pullback.
- Ripple faces retracement from Wednesday’s trading session, looks to continue until retesting support at $1.56.
The hype around Coinbase’s IPO was matched by Bitcoin and Ethereum, which surged to new all-time highs. On the other hand, Ripple price faced an abrupt stop as investors began booking profits.
While the pioneer crypto and remittances token struggle to maintain their bullishness, the smart contracts token shows no sign of stopping.
Bitcoin lacks momentum despite breaking out from bullish setup
Bitcoin price action since March 15 has produced three distinctive swing lows known as the inverse head-and-shoulders pattern. This setup contains a central dip referred to as the head, while the other two of comparable depth are known as shoulders.
The swing highs of these peaks have seen a sell-off at the neckline at $60,100, which was breached successfully on April 13, signaling a 16% upswing to $69,860. This target is determined by measuring the head’s depth and adding it to the breakout point.
While the technical formation is bullish, the Momentum reversal indicator’s (MRI) reversal signal in the form of a red ‘one’ candlestick on the 4-hour chart has deterred the advance.
A potential spike in buying pressure could end the sell-off and restart the upward move to the intended target at $69,860.
If the bullish momentum persists beyond this point, investors can expect Bitcoin price to tap the 127.2% Fibonacci extension level at $70,779.
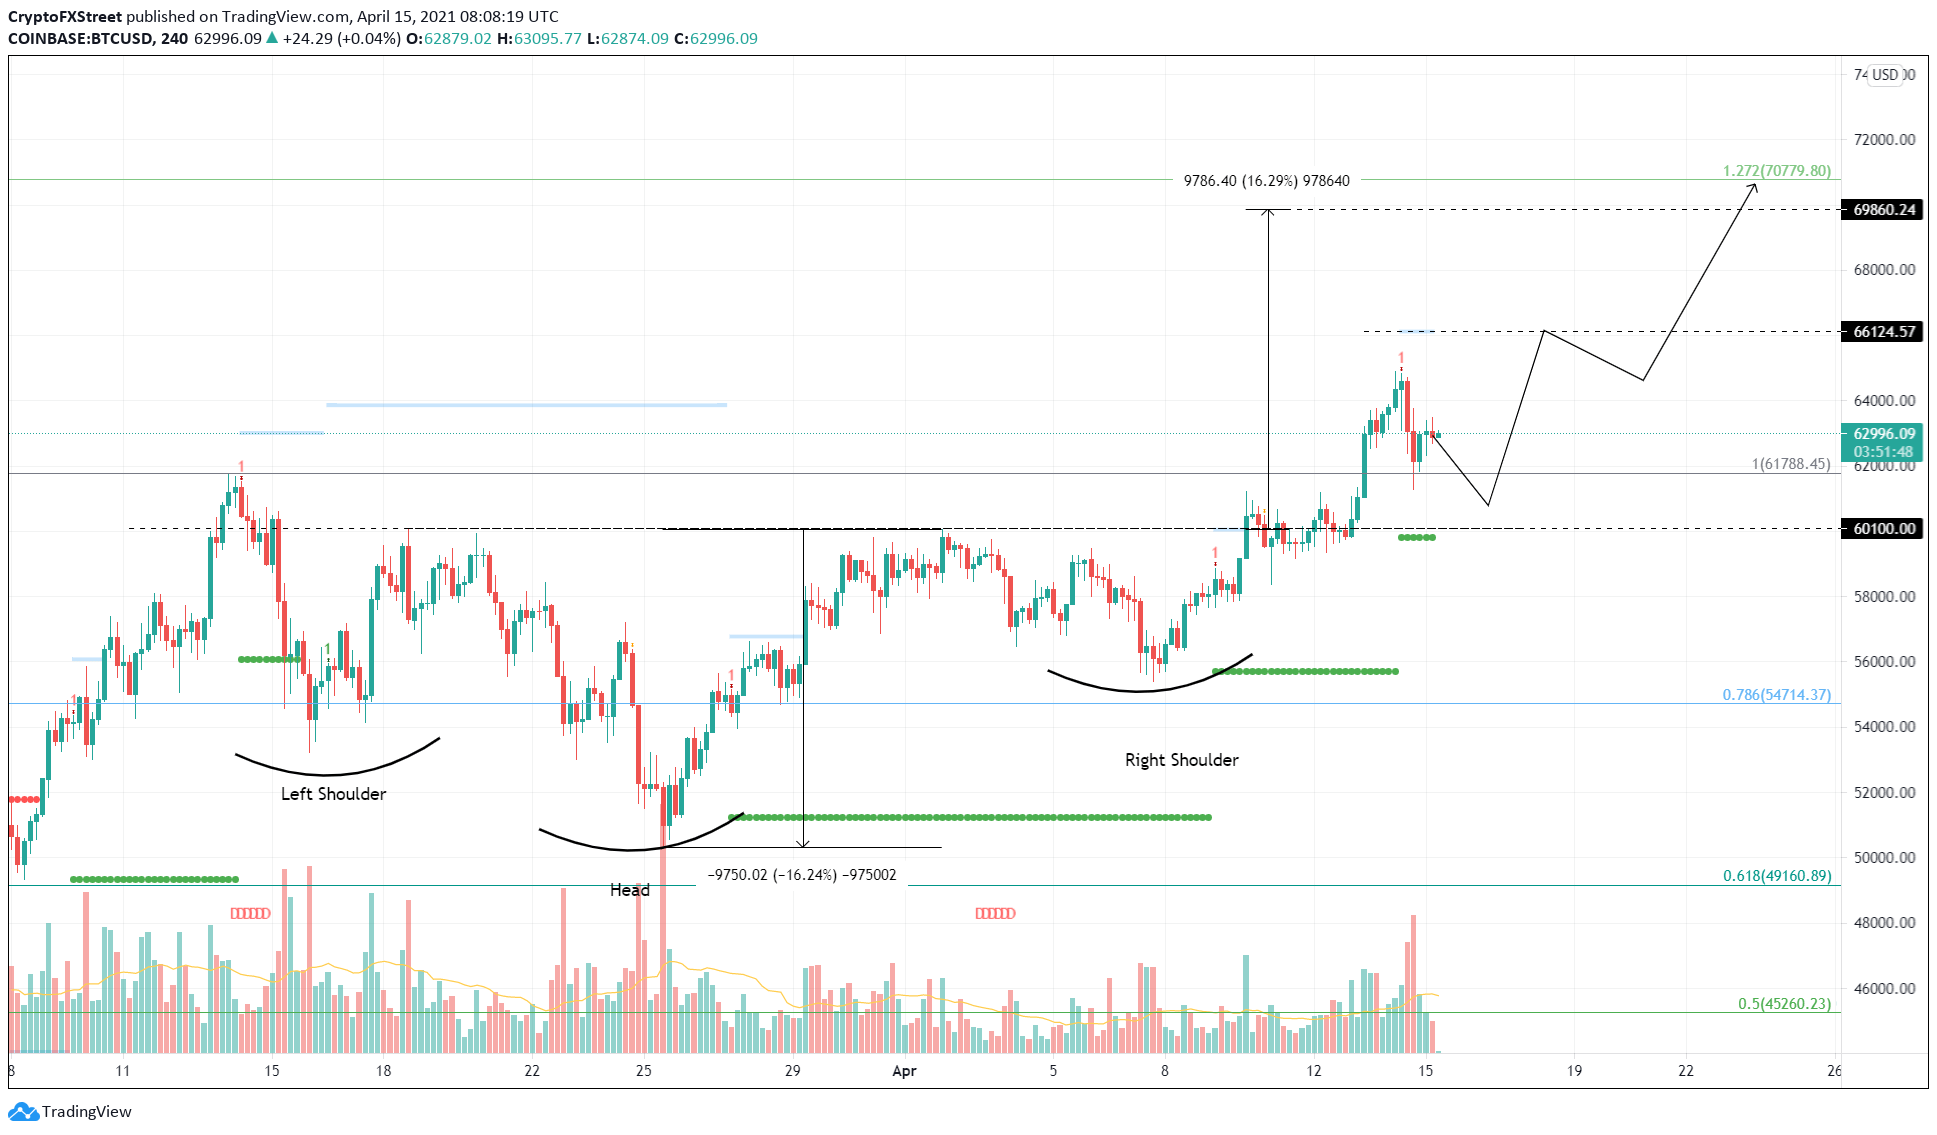
BTC/USD 4-hour chart.
Regardless of the optimism, if the retracement produces a decisive close below the previous all-time high at $61,788, it would significantly discourage buyers from placing bid orders.
However, a breakdown of the neckline at $60,100 would invalidate the bearish thesis and trigger a 5.4% drop to $56,791.
Ethereum price continues its carefree ascent
Ethereum price has surged nearly 25% since it broke out of a symmetrical triangle on April 1. This technical formation contains ETH getting squeezed between two converging trend lines, resulting in lower highs and higher lows.
The setup’s target is determined by measuring the distance between the pivot high and low and adding it to the breakout point at $1,863. Unlike Bitcoin, ETH bulls have disregarded the recently spawned red ‘one’ reversal signal by the MRI.
Additionally, the MRI has also produced an extension C, which paints an overextension of the bull rally on the 6-hour chart.
While these signs indicate that a retracement is nigh, the buyers might push the smart contracts token to a new all-time high at $2,546 before allowing a full-blown retracement.
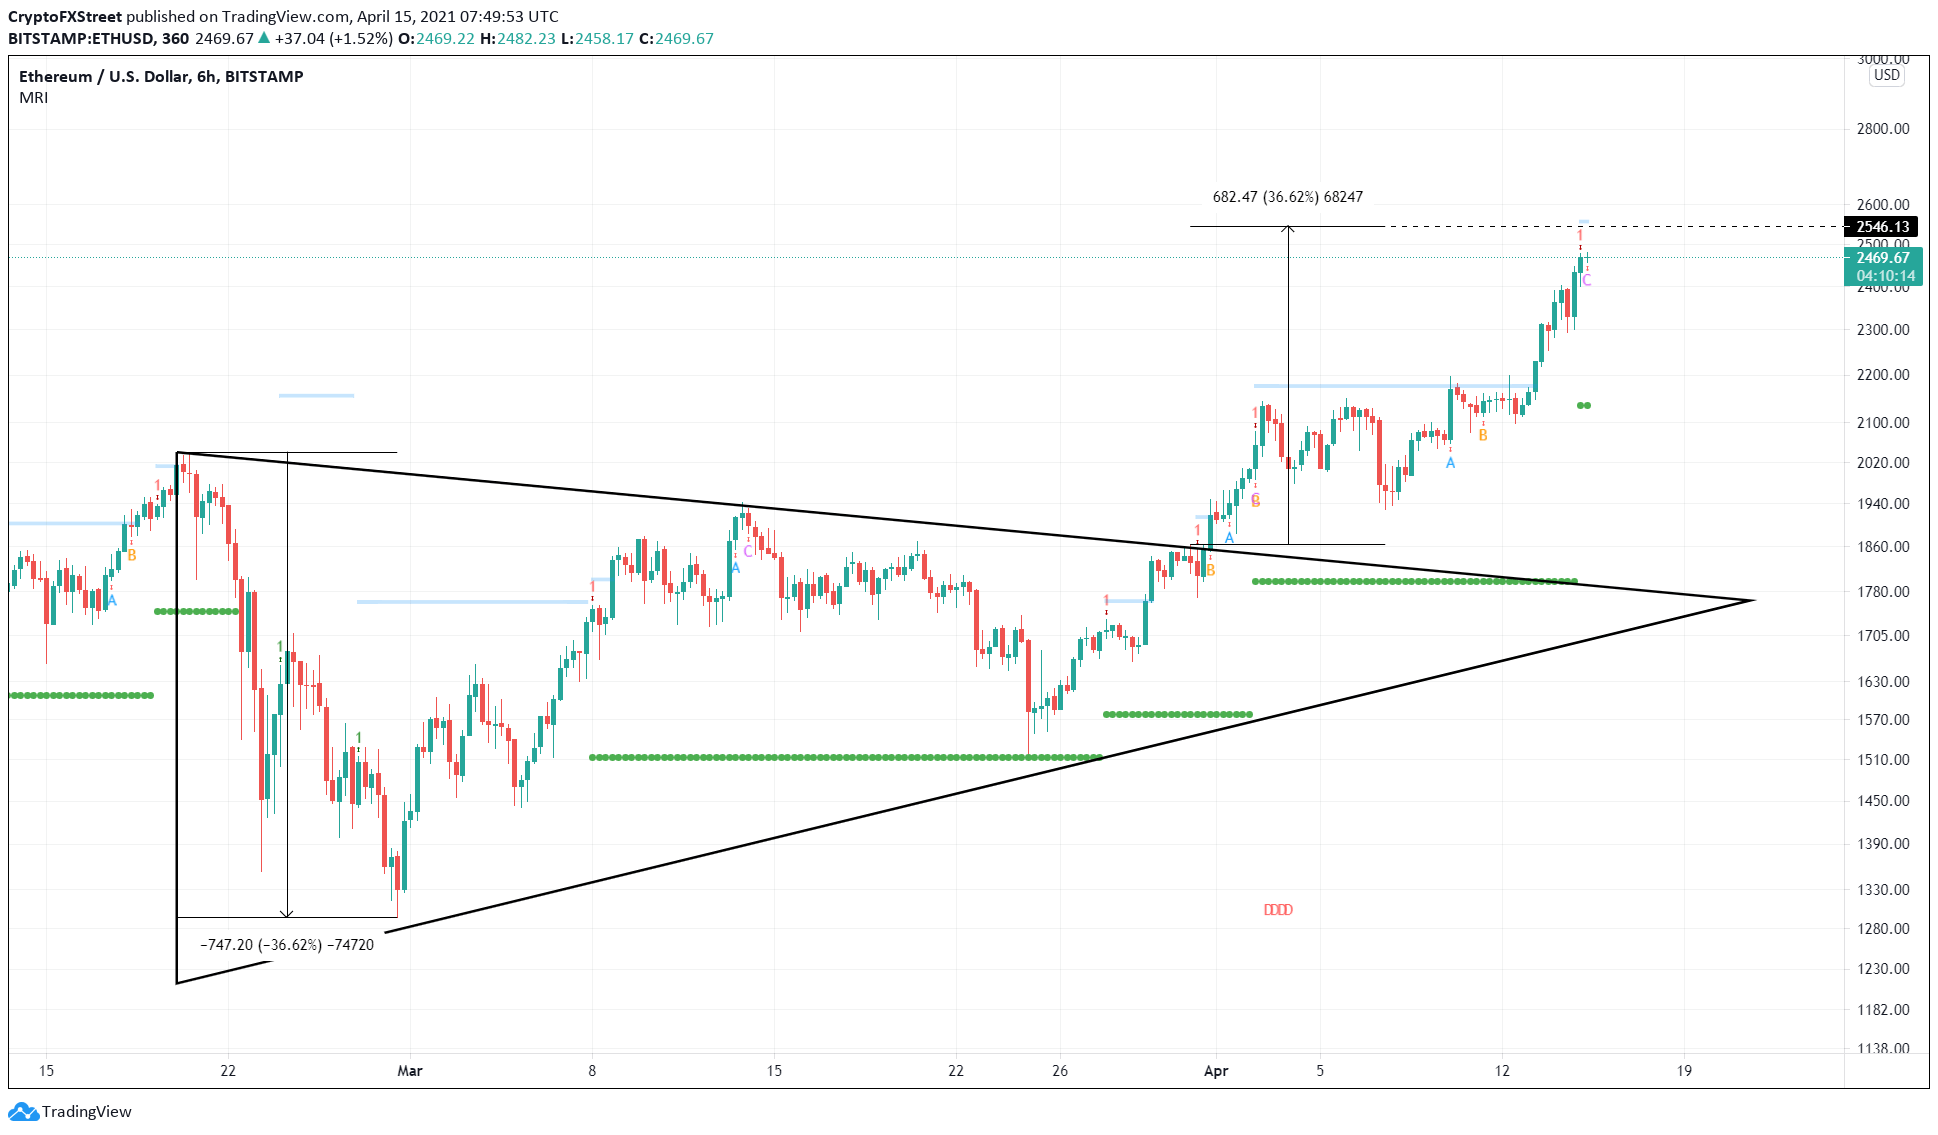
ETH/USD 6-hour chart
If investors fail to prop up Ethereum price, then it is evident that a retracement will ensue. In such a case, an 11% sell-off to $2,177, coinciding with the MRI’s breakout line, is likely.
Ripple buyers book profits, sending XRP price into tailspin
XRP price has moved from one bullish technical formation to another, appreciating from $0.63 to almost $2. Such a hyperbolic move, although impressive, met a blockade in Wednesday’s trading session that resulted in a sudden 20% wick to the crucial demand barrier at $1.56.
XRP price seems to have recovered almost all of the losses, but the pullback scare has not vanished yet. Additionally, the MRI has also flashed a red ‘A’ candlestick, suggesting that Ripple price has overextended its rally.
If the sellers continue to keep booking profits, XRP price could initially drop 9% to the immediate support level at $1.56. If this barrier is breached, the remittance token could sell off nearly 15% to MRI’s State Trend Support and hit $1.33.
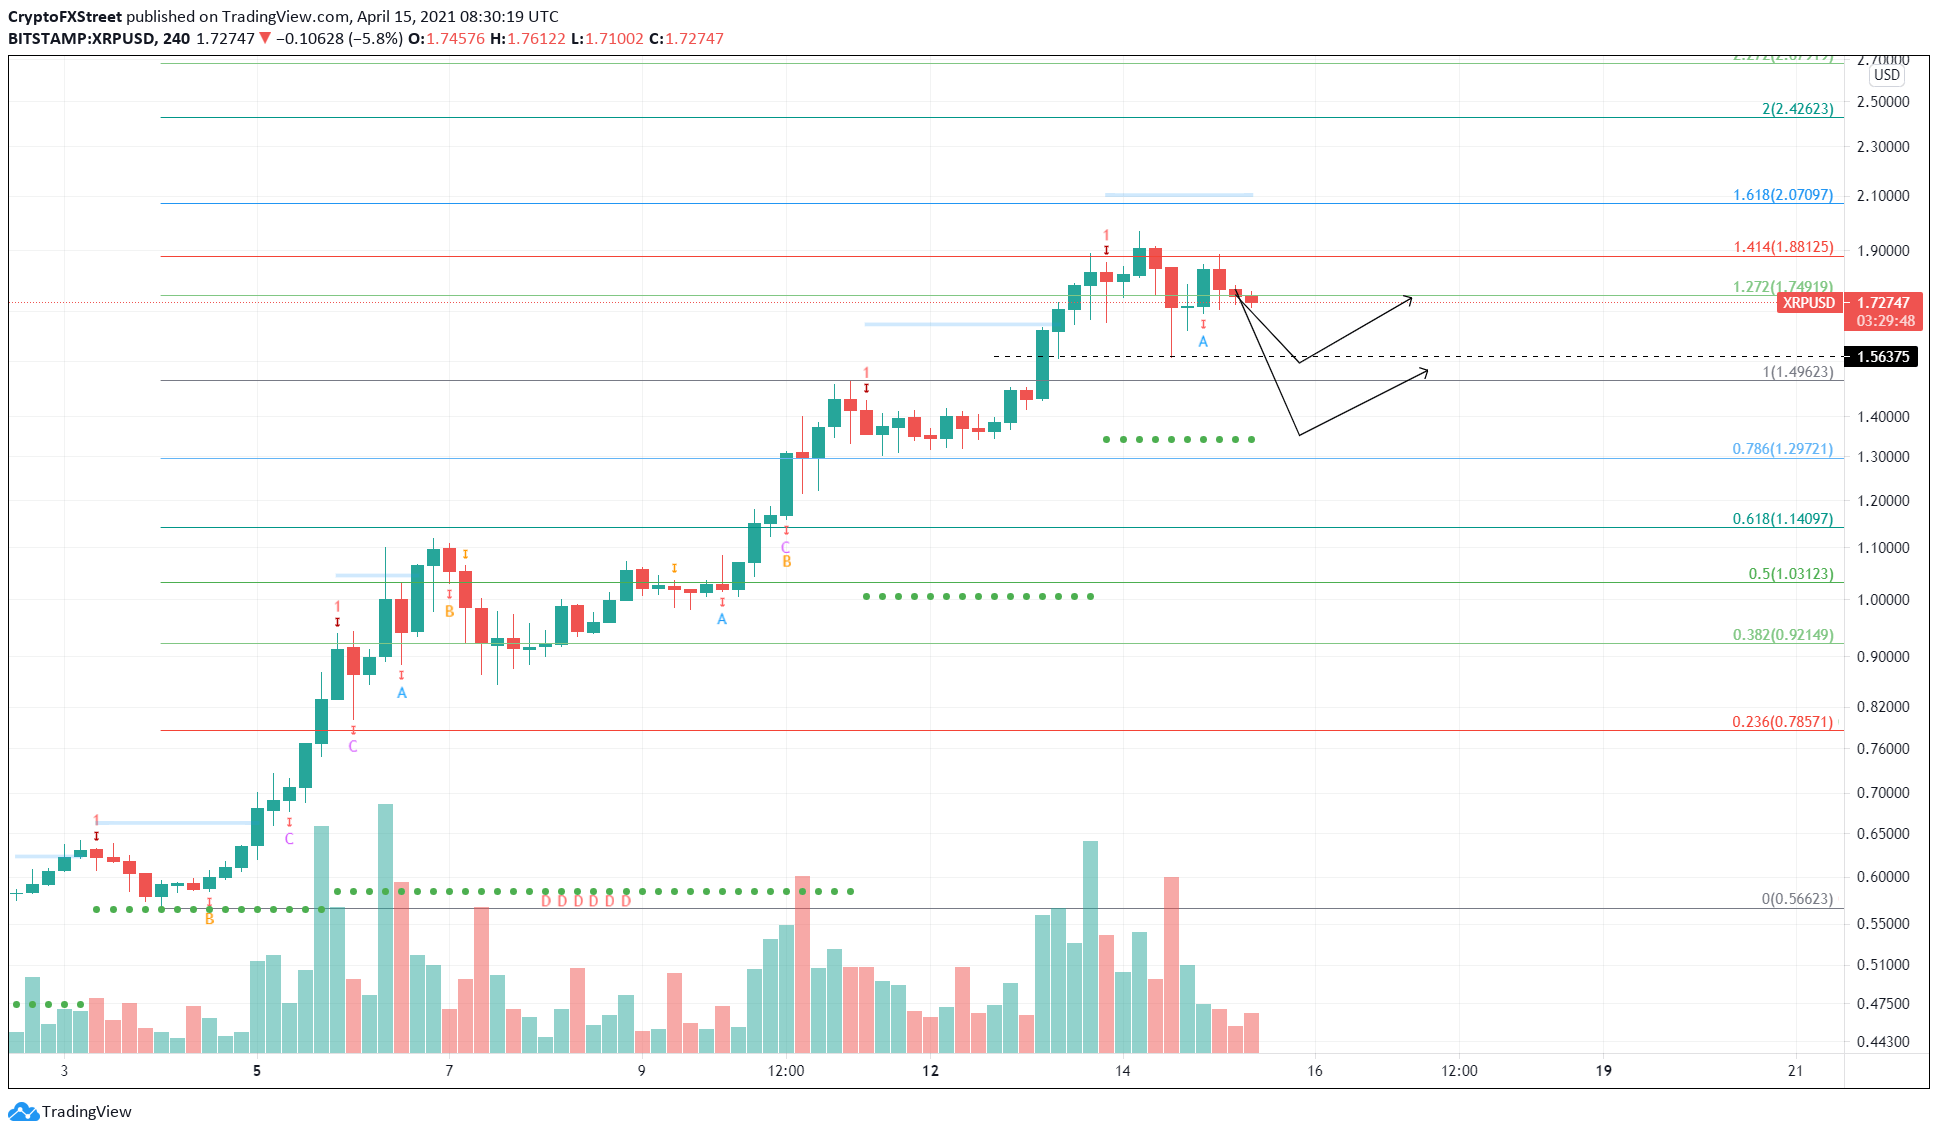
XRP/USD 4-hour chart
On the contrary, if the buyers make a comeback, XRP price could bounce off the MRI’s breakout line at $1.66 and head to retest its recent highs at $1.97 and perhaps even $2.07, coinciding with the 161.8% Fibonacci extension level.
Information on these pages contains forward-looking statements that involve risks and uncertainties. Markets and instruments profiled on this page are for informational purposes only and should not in any way come across as a recommendation to buy or sell in these assets. You should do your own thorough research before making any investment decisions. FXStreet does not in any way guarantee that this information is free from mistakes, errors, or material misstatements. It also does not guarantee that this information is of a timely nature. Investing in Open Markets involves a great deal of risk, including the loss of all or a portion of your investment, as well as emotional distress. All risks, losses and costs associated with investing, including total loss of principal, are your responsibility. The views and opinions expressed in this article are those of the authors and do not necessarily reflect the official policy or position of FXStreet nor its advertisers. The author will not be held responsible for information that is found at the end of links posted on this page.
If not otherwise explicitly mentioned in the body of the article, at the time of writing, the author has no position in any stock mentioned in this article and no business relationship with any company mentioned. The author has not received compensation for writing this article, other than from FXStreet.
FXStreet and the author do not provide personalized recommendations. The author makes no representations as to the accuracy, completeness, or suitability of this information. FXStreet and the author will not be liable for any errors, omissions or any losses, injuries or damages arising from this information and its display or use. Errors and omissions excepted.
The author and FXStreet are not registered investment advisors and nothing in this article is intended to be investment advice.
Recommended Content
Editors’ Picks

Top 3 Price Prediction Bitcoin, Ethereum, Ripple: BTC, ETH, and XRP decline as President Trump’s team considers “broader and higher tariffs”
Bitcoin continues its decline, trading below $82,000 on Monday after falling 4.29% the previous week. Ethereum and Ripple followed BTC’s footsteps and declined by 9.88% and 12.40%, respectively.

XRP Price Forecast: Weak demand and rising supply could trigger a downtrend
Ripple's XRP is down 7% on Friday following bearish pressure from macroeconomic factors, including United States (US) President Donald Trump's tariff threats and rising US inflation.

Crypto Today: XRP, SOL and ETH prices tumble as South Carolina moves to buy up to 1 million BTC
Bitcoin price tumbled below the $85,000 support on Friday, plunging as low as $84,200 at press time. The losses sparked over $449 million in liquidations across the crypto derivatives markets.

Hackers accelerate ETH decline following $27 million dump, bearish macroeconomic factors
Ethereum (ETH) declined below $2,000 on Friday following a series of hacks traced to accounts of crypto exchange Coinbase users, which caused a loss of $36 million.

Bitcoin: BTC remains calm before a storm
Bitcoin's price has been consolidating between $85,000 and $88,000 this week. A K33 report explains how the markets are relatively calm and shaping up for volatility as traders absorb the tariff announcements. PlanB’s S2F model shows that Bitcoin looks extremely undervalued compared to Gold and the housing market.

The Best brokers to trade EUR/USD
SPONSORED Discover the top brokers for trading EUR/USD in 2025. Our list features brokers with competitive spreads, fast execution, and powerful platforms. Whether you're a beginner or an expert, find the right partner to navigate the dynamic Forex market.