Top 3 Price Prediction Bitcoin, Ethereum, Ripple: ETH discovers momentum, while BTC and XRP stuck in quicksand
- Bitcoin price gains 1.66% for the week but registers the lowest weekly volume since the beginning of April.
- Ethereum price logs a 17.05% gain for the week, marking the best week since the beginning of April, but volume evaporates.
- XRP price jumps 7.28% for the week, holds crucial $0.65 level, but weekly volume is the lowest since October 2020.

Bitcoin price creates a new line in the sand between $35,000-$35,000 as the 50-day simple moving average (SMA) converges. Ethereum price about to collide with the 50-day SMA while trading around the 50% Fibonacci retracement of the March 2020-May 2021 advance at $2,237. XRP price slips into a new trading range between $0.650-$0.740 after triggering a rising wedge pattern on July 1.
Bitcoin price questions abound, but answers difficult to find
Two weeks ago, Bitcoin price staged an impressive rebound from the dominant $30,000 level, marking the third time in the previous six weeks. Due to the velocity of the rebound and solid weekly close in the form of a bullish hammer candlestick pattern, it appeared that BTC was communicating a keen interest and robust demand from prominent investors.
Adding to the optimism was the complete Elliot five wave down pattern and the bullish momentum divergence on the daily Relative Strength (RSI), combined with the Mayer Multiple showing that BTC was cheap relative to its long-term trend.
However, Bitcoin price failed to capitalize on the momentum and closed last week with a 1.66% gain, despite triggering the hammer pattern with a trade and daily close above $35,741 on June 29. The weekly volume was the lowest since the beginning of April, showing an absence of a bid and a return to uncertainty.
Since June 22, Bitcoin price has printed higher lows, creating a minor rising trendline while struggling to accumulate traction above $35,000-$35,500, thereby printing mildly higher highs. Overall, the price action has been corrective, with the 50-day SMA now converging, adding downward pressure on BTC and presenting a new technical barrier for the flagship cryptocurrency.
At this point, Bitcoin price needs a daily close above the 50-day SMA at $36,359 and the anchored VWAP from October 21, 2020, at $37,732 before consideration can be given to a new long position.
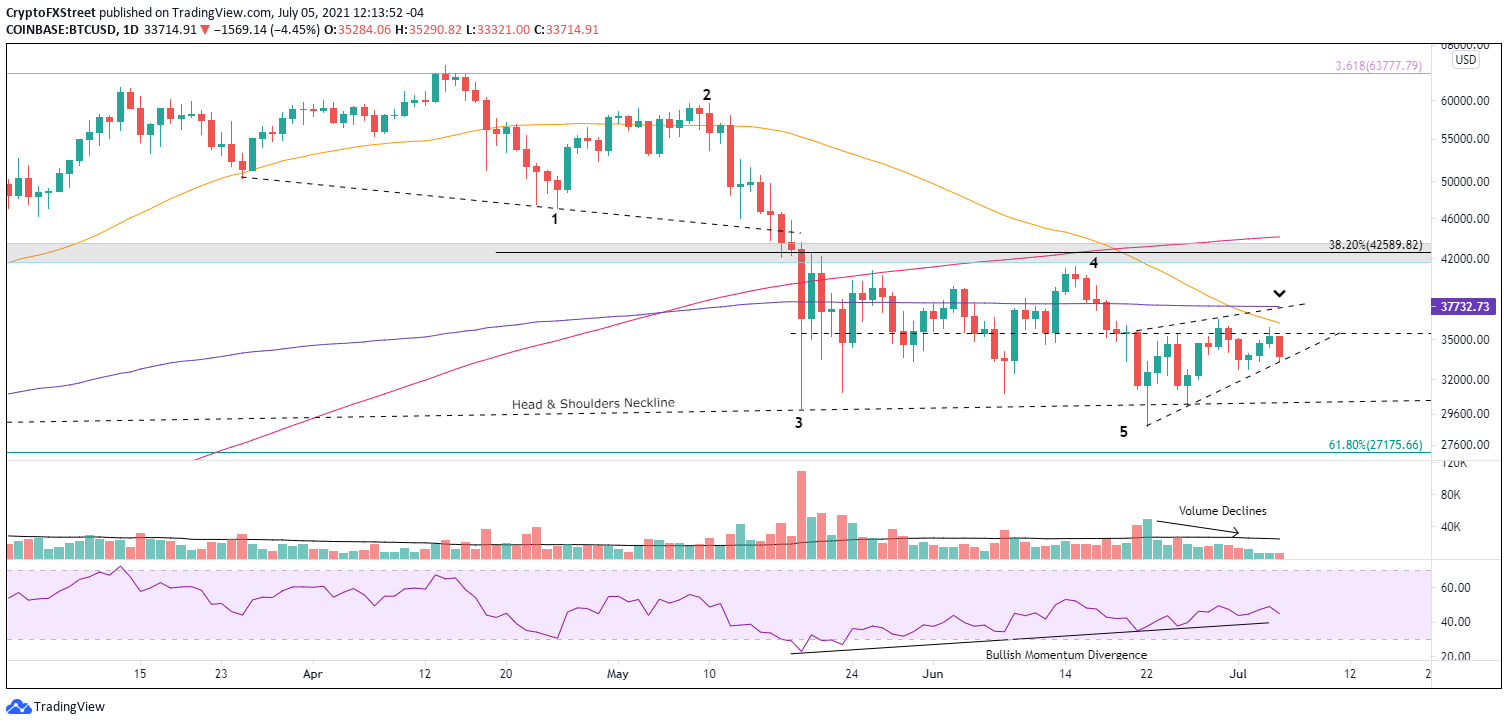
BTC/USD daily chart
It is worth reiterating that Bitcoin price did trigger the neckline of a larger head-and-shoulders pattern on June 22. The pattern will remain active until BTC trades above the right shoulder high of $41,332. Moreover, the digital asset did confirm a bearish Death Cross pattern on June 19 when the 50-day SMA crossed below the 200-day SMA.
On June 28, the probabilities were stacked in favor of further upside. Still, this past week has put the burden of proof back on the bulls as BTC lost conviction and momentum, both critical to overcoming the growing resistance at $35,000-$35,500. For now, Bitcoin price is trading like it is quicksand.
Ethereum price positive as the London hard fork comes into focus
The positive response of Ethereum price to the outstanding support framed by the 200-day SMA at $1,878, the 2020 rising trend line at $1,793, the 61.8% retracement of the March 2020-May 2021 advance at $1,730 and the May 23 low of $1,728 created a hint of optimism for enthusiastic ETH investors and short term speculators on June 22.
On June 28, Ethereum price closed above the February high of $2,041, enlisting the first positive step towards higher prices. Since capturing $2,041, ETH closed above the 50% retracement level of the March 2020-May 2021 advance at $2,237 on two occasions and closed last week with a 17.05% gain.
Today’s Ethereum price decline tests the 50% retracement level again as the 50-day SMA rapidly converges with ETH, elaborating a new obstacle for the international settlement token.
Overall, Ethereum price action has been a bullish divergence from Bitcoin. Still, the underlying issue of conviction manifested through volume also remains a problem. It raises the probability that the improving price structure may be a temporary diversion before a resumption of the ETH weakness.
A daily close above the 50-day SMA at $2,411 and the upper trend line of a new descending triangle around $2,640 would mark important technical milestones for the bullish narrative.
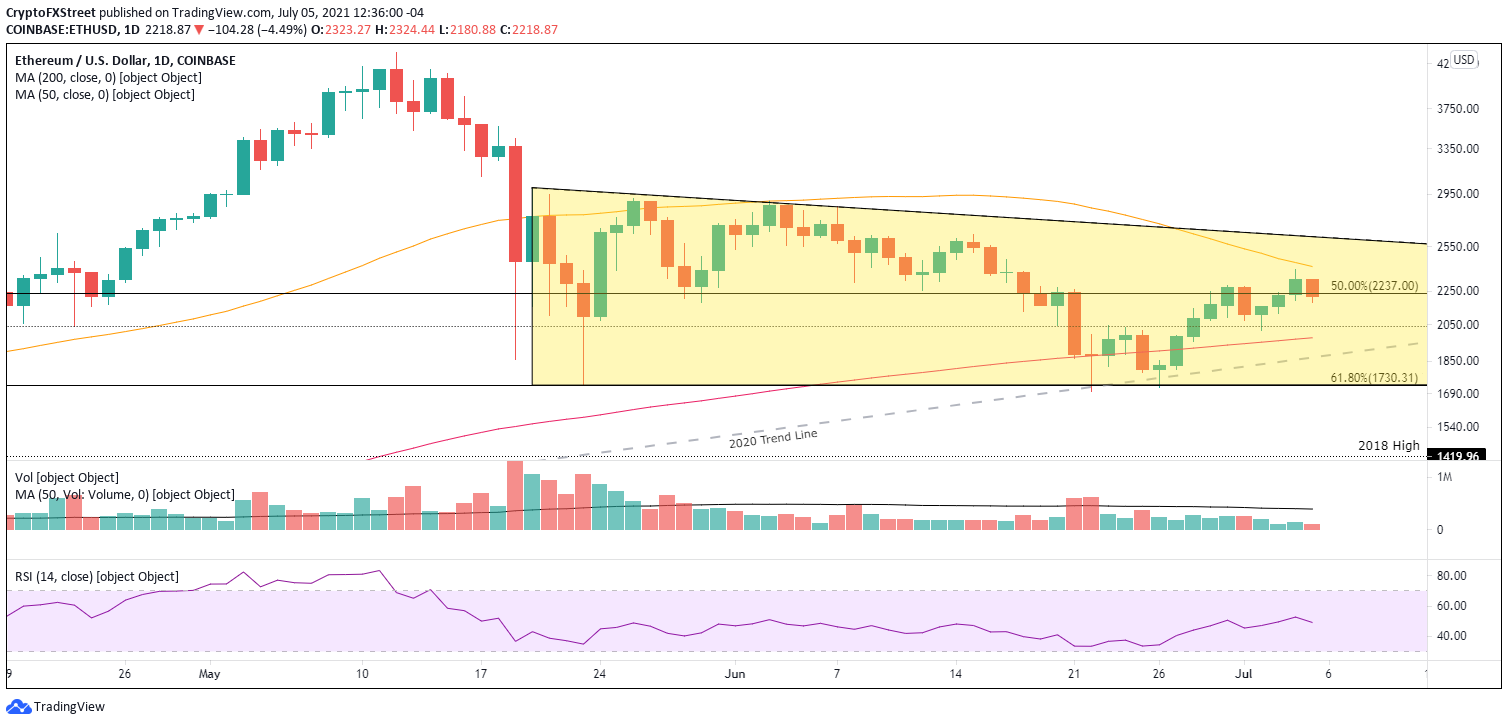
ETH/USD daily chart
If Ethereum price closes below the 2020 rising trend line at $1,885 and the 61.8% retracement level of the March 2020-May 2021 advance at $1,730, ETH may explore the support established by the 2018 high at $1,419, yielding a 36% decline from the current price.
On a relative basis, Ethereum price stood out last week among the crypto majors. Still, it should not diminish the insistence on seeing volume confirmation and strong closes above dominant resistance levels. Additionally, descending triangle patterns are defined as continuation formations, lifting the probability that Ethereum price could eventually resolve to the downside.
XRP price trendless with no catalyst on the horizon
To review, at the June 22 low XRP price had declined 70% and a remarkable 50% from the June 1 high, liquidating the May 23 low of $0.652, a level fortified by weekly highs in late 2020 and February 2021. Nonetheless, Ripple realized three important technical milestones that provoked a 45% rebound into June 29: a test of the 78.6% retracement of the December 2020-April 2021 advance at $0.555, an undercut of the 50-week SMA at $0.540 and registered an oversold reading on the daily RSI for the first time since late December 2020.
The 45% rebound was noteworthy, but it lacked the impulsiveness that characterizes meaningful bottoms and the momentum to enable XRP price to conquer the massive resistance around $0.740-$0.760. The result was a rising wedge formation triggering on July 1, quickly putting the support level of $0.650 in play. Ripple has been holding the critical level for the last four days.
The Ripple rising wedge pattern’s measured move is approximately 30%, suggesting that XRP price will push through the 78.6% retracement level of $0.555 and the June 22 low of $0.512 before bottoming at around the measure move target of $0.477.
It is important to note that XRP price has no visible support below the measured move target, raising the pressure on bullish Ripple speculators.
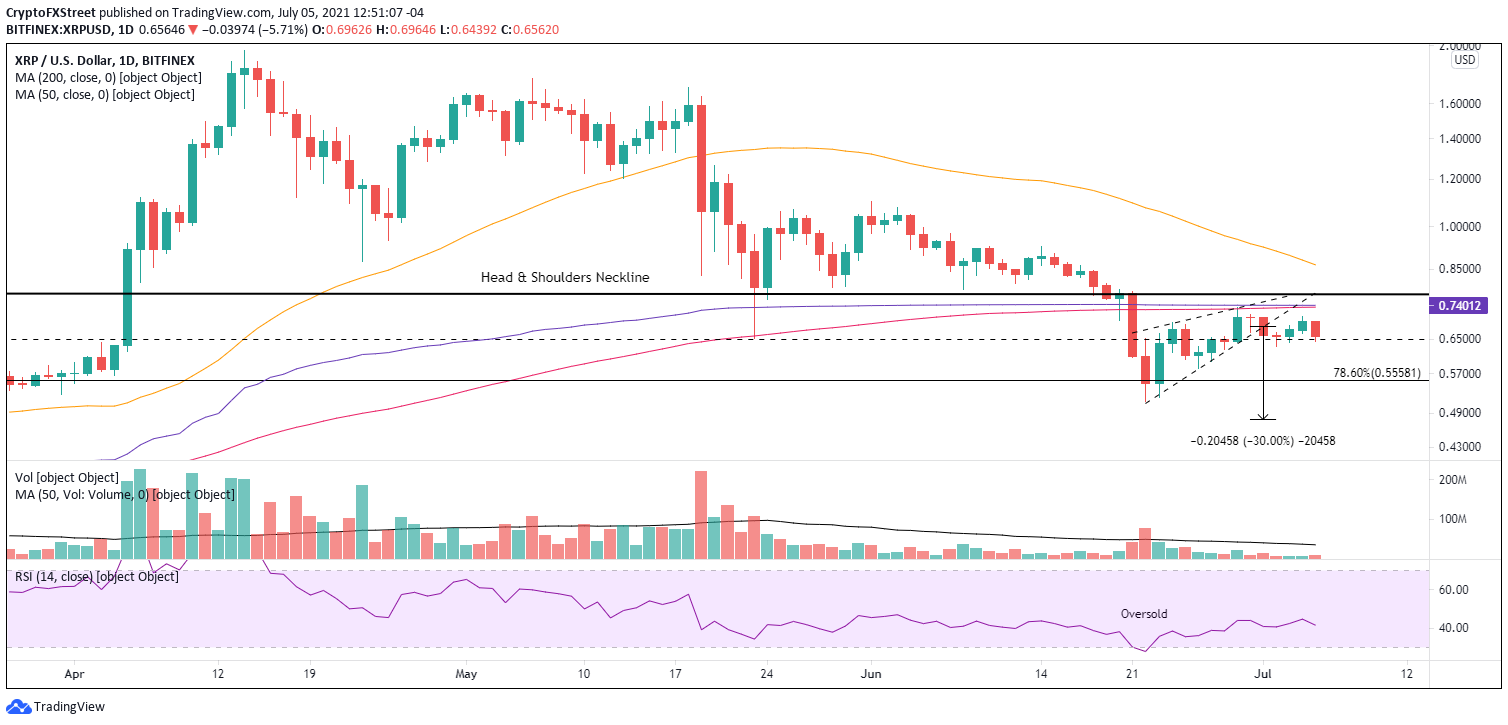
XRP/USD daily chart
Due to the clarity of the price structure from the June 22 low and the definitive resistance in the range of $0.740-$0.760, Ripple needs a daily close above $0.760 to unravel the dominant bearish narrative.
An emerging scenario that has been discussed in the past is for XRP price to fall into a trading range between $0.555 and $0.760, thereby offering potent trading conditions for swing traders due to the fortified support and resistance levels and the attractive 30-40% profit opportunities that lie between. For long-term investors, Ripple is dead money under $0.760.
Here, FXStreet's analysts evaluate where Ripple could be heading next with a brief technical and on-chain analysis on XRP price.
Author

Sheldon McIntyre, CMT
Independent Analyst
Sheldon has 24 years of investment experience holding various positions in companies based in the United States and Chile. His core competencies include BRIC and G-10 equity markets, swing and position trading and technical analysis.


