Top 3 Price Prediction Bitcoin, Ethereum, Ripple: Disbelief running hot as cryptos ascend
- Bitcoin price consolidates after tagging $23,000.
- Ethereum moves in unison with BTC and eyes the $2,000 level.
- XRP price rallies by 8% on the day.
The crypto market continues to consolidate after the unexpected rally witnessed in January. While many investors may be in disbelief of the crypto's potential, the technical analysis sheds light on previous bull run scenarios that align with the current.
Bitcoin price could have more fuel in the tank
Bitcoin price trotted into the $23,000 price zone over the weekend and has since returned under a profit-taking consolidation. As the market cools off, traders have another decision to make. Will they add to their positions, or is it time to call an end to the surging rally?
Bitcoin price currently auctions at $22,837, down 2% from the new monthly high formed at $23,371.80. The Relative Strength Index (RSI), an indicator used to gauge trend potential by assessing previous swing points, shows a bearish divergence between the newfound monthly high and the previous one that occurred on January 15 when Bitcoin breached $21,000.
The divergence is a sign that the trend is getting overextended, which could be an enticing signal for the bears to take advantage of. Still, traders should be cautious as the diversions on the other side are extremely over territory. Bitcoin is notoriously known for trending overbought territory for weeks towards higher prices while the RSI makes lower highs.
For instance, the Bitcoin price reached 80 on the RSI in January of 2021 upon BTC's first encounter with the $40,000 price zone. Bitcoin diverged for several weeks while climbing to $60,000 by April 2021. Thus, it is imperative that traders review the history of BTC before expecting classical technical analysis concepts to negate the surging trend's potential.
The bulls would not be wrong for entering the market through a pullback that could be on the horizon. A dip could be considered a buying opportunity. So long as the RSI can remain above 40 amidst any future sell-offs, bullish targets are the $30,000 and potentially $35,000 liquidity levels.
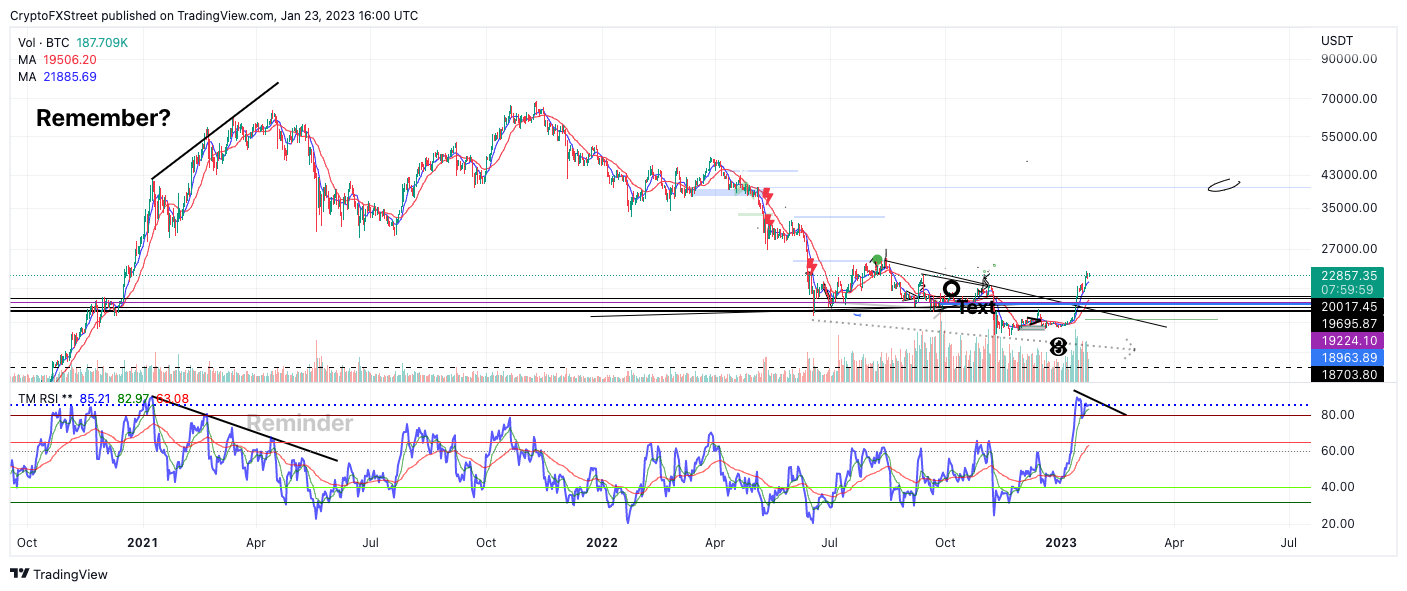
BTC/USDT 1-day chart
Invalidation of the uptrend currently depends on the previous swing high at $18,887 getting breached. This would invalidate the impulsive structure and potentially create a steeper retracement toward the 2020 low at $15,476. The BTC price would decline by 30% if the bears were to succeed.
Ethereum price is cooling down
Ethereum price is undergoing account consolidation after tagging the mid-$1,600 zone late last week. Like Bitcoin, the RSI is overbought and shows a bearish divergence between highs at $1,675 and $1,566.
Still, there is significant liquidity to collect as November's monthly high at $1,680 was not tagged during the previous rally. As the price consolidates 2% below the liquidity level, it is hard to believe market makers would rally the ETH price so close to the bakery without eating the pie.
Ethereum price currently auctions at $1,636. Traders should expect a rise in the coming hours, with resistance to show up near the psychological $1,700 price zone. Ultimately, if ETH can surpass the $1,700 barrier, then $2,000 could become a tangible reality in the coming days.
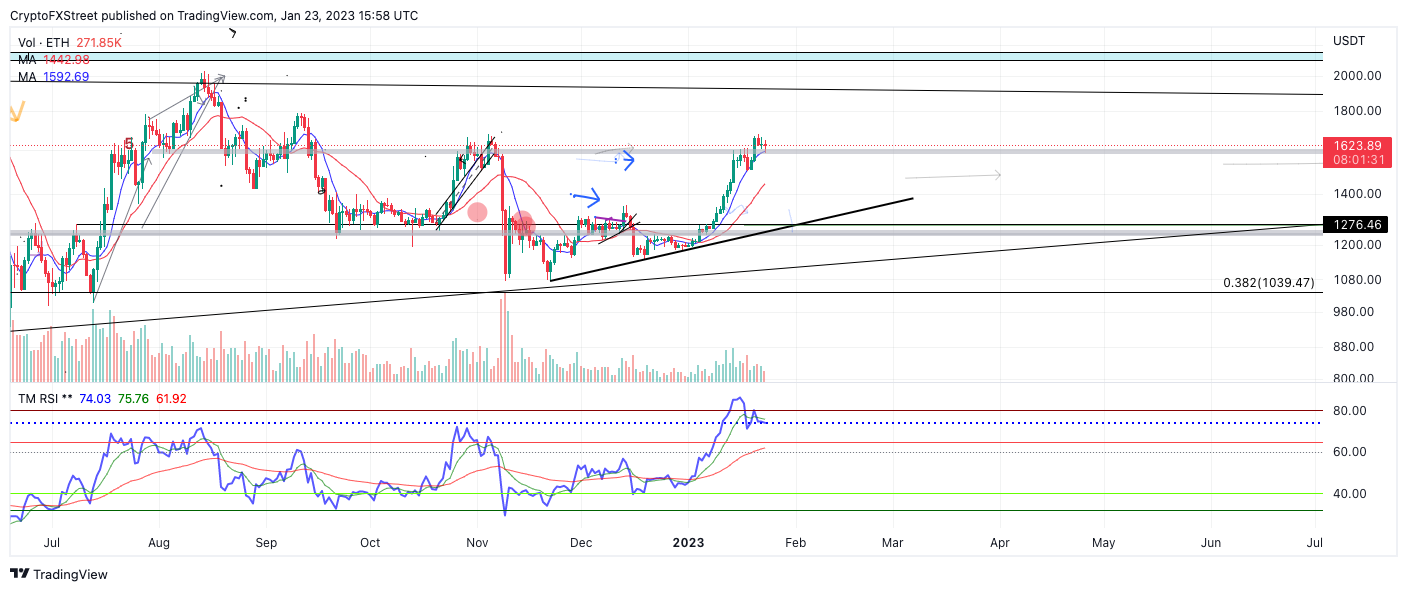
ETH/USDT 1-day chart
Invalidation of the uptrend depends on the swing point at $1,349 remaining untagged. If the level is breached, the ETH price could decline further toward the $1,100 barrier resulting in a 30% decline from the current market price.
XRP price headed higher
XRP price has decoupled from the other two cryptocurrencies (BTC & ETH) as the bulls have prompted an 8% rise on the day. On January 23, while Bitcoin and Ethereum sparred over new price fluctuations, the digital remittance token soared into new highs, tagging old liquidity levels near the $0.42 zone
XRP price currently auctions at $0.421 as profit-taking has occurred post-surge. Another key difference between Ripple and the other two currencies is that the Relative Strength Index has not broken out into overbought territory on the daily time frame. Despite the surge, which is now a 40% ride since the January 1 low at $0.30, the RSI remains suppressed beneath the 70 levels. This suggests that XRP's move to the upside could be a part of a much larger correction within an overall downtrend. So long as the RSI remains suppressed beneath 70, caution should be applied.
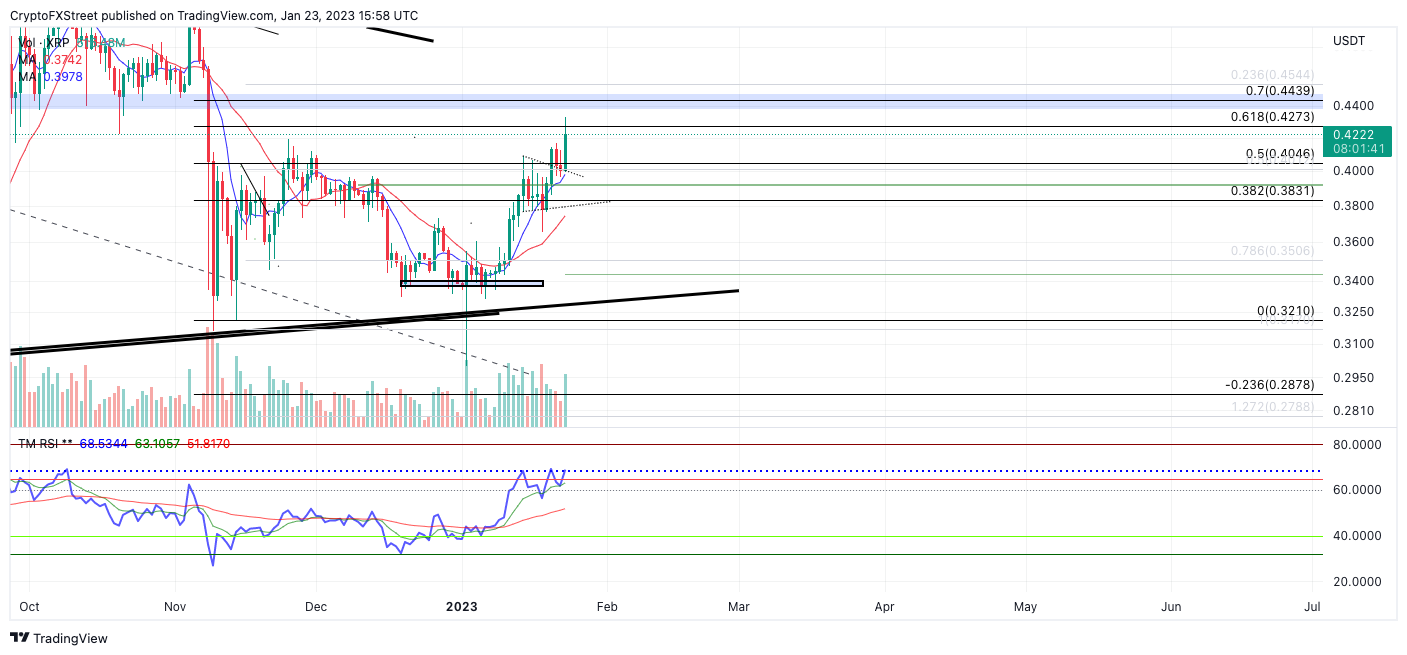
XRP/USDT 1-day chart
Previous outlooks have maintained that XRP would rise in the short term, ideally to target the $0.427 level tag on Monday and potentially the $0.44 liquidity zone. The second target is 5% away from XRP’s current price, and invalidation of the uptrend could arise if the bears happen to breach the 8-day exponential moving average at $0.398.
Author

Tony M.
FXStreet Contributor
Tony Montpeirous began investing in cryptocurrencies in 2017. His trading style incorporates Elliot Wave, Auction Market Theory, Fibonacci and price action as the cornerstone of his technical analysis.


