- Bitcoin price retests the parallel channel’s lower trend line, threatening a make-or-break scenario.
- Ethereum price invalidates the $2,800 to $3,000 support cluster, hinting at a crash to $2,541,
- Ripple price digs deeper into the $0.626 to $0.689 buy zone, indicating that bulls are slowly losing control.
Bitcoin price approaches close to the last defensive support level, putting the fear back in retail traders’ minds. Likewise, Ethereum and Ripple have also crawled closer to significant barriers, suggesting that they are ready to follow suit.
Bitcoin price reevaluates directional bias
Bitcoin price has been describing an ascending parallel channel on a three-day time frame for roughly three months. It has connected the higher highs and higher lows formed from January 14, to outline the channel’s formation.
The last two times BTC tagged the lower trend line, it recovered and rallied explosively. Interestingly, both these times, the candlestick bodies closed above the 200 three-day Simple Moving Average (SMA).
This time around, things are different as BTC has dropped slowly below the 200 three-day SMA at $40,084 and tagged the lower trend line of the ascending parallel channel. Such a development indicates that the bulls are losing control.
A bullish engulfing candlestick on the three-day chart would alleviate the bearish pressure and trigger an upswing. In such a case, investors can expect BTC to retest the 50-day and 100-day SMA at $42,035, $41,001.
Flipping these hurdles into support levels could see the big crypto rally toward the yearly open at $46,198 and in some cases, the $50,000 psychological level.
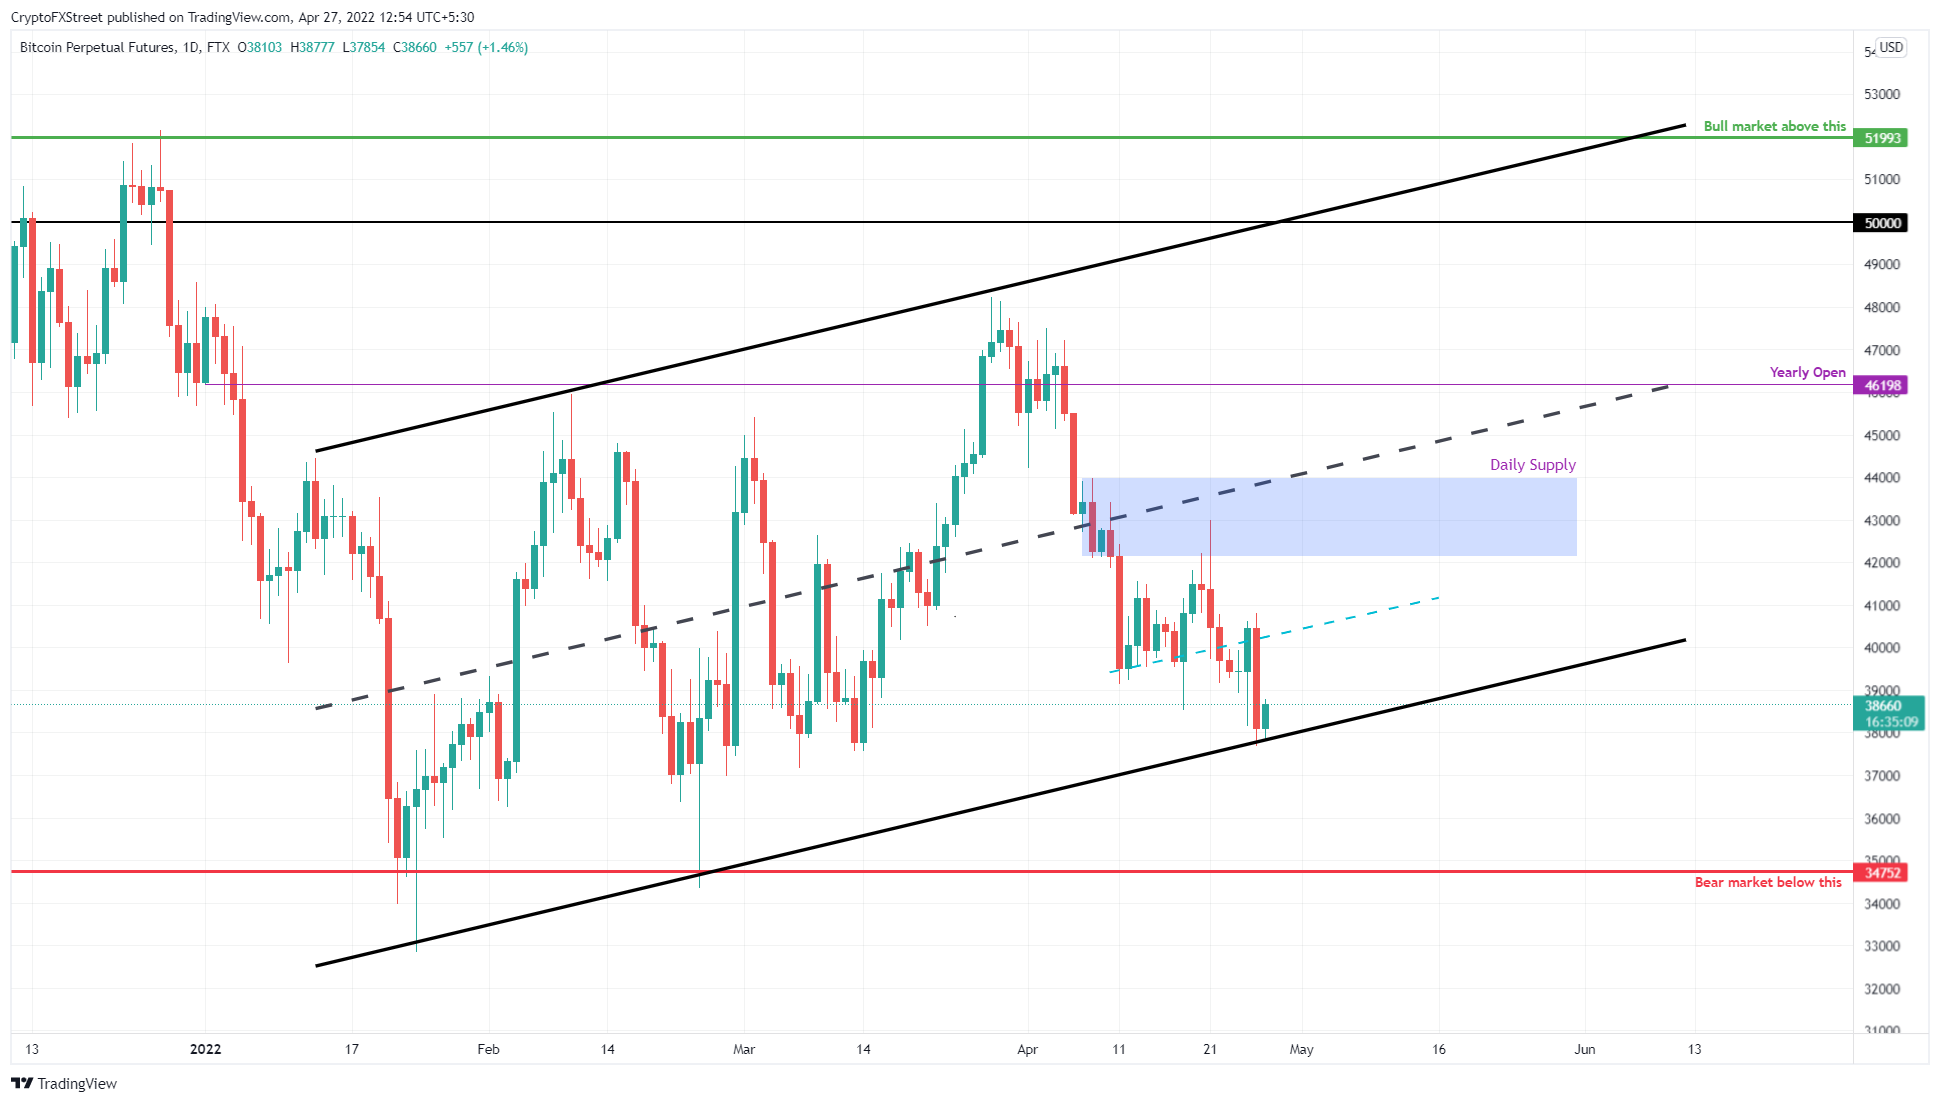
BTC/USDT 3-day chart
A daily candlestick close below the $34,752 support level will invalidate the ascending parallel channel and the bullish thesis.
Ethereum price treads on delicate floors
Ethereum price pushed deep into the support cluster, extending from $2,800 to $3,000, indicating a short-term spike in selling pressure. Additionally, yesterday’s daily candlestick close was below the lower limit of the said cluster, invalidating it.
While a recovery seems to be in progress, investors need to be cautious as BTC is also hovering above the last line of defense. A spike in buying pressure is likely to propel ETH to retest the 100-day SMA at $2,908 and the 50-day SMA at $3,036.
If these hurdles were not enough, Ethereum price needs to overcome the 2022 volume point of control at $3,129 to make a run at the 200-day SMA at $3,472. Investors can expect a local top to form around this level.
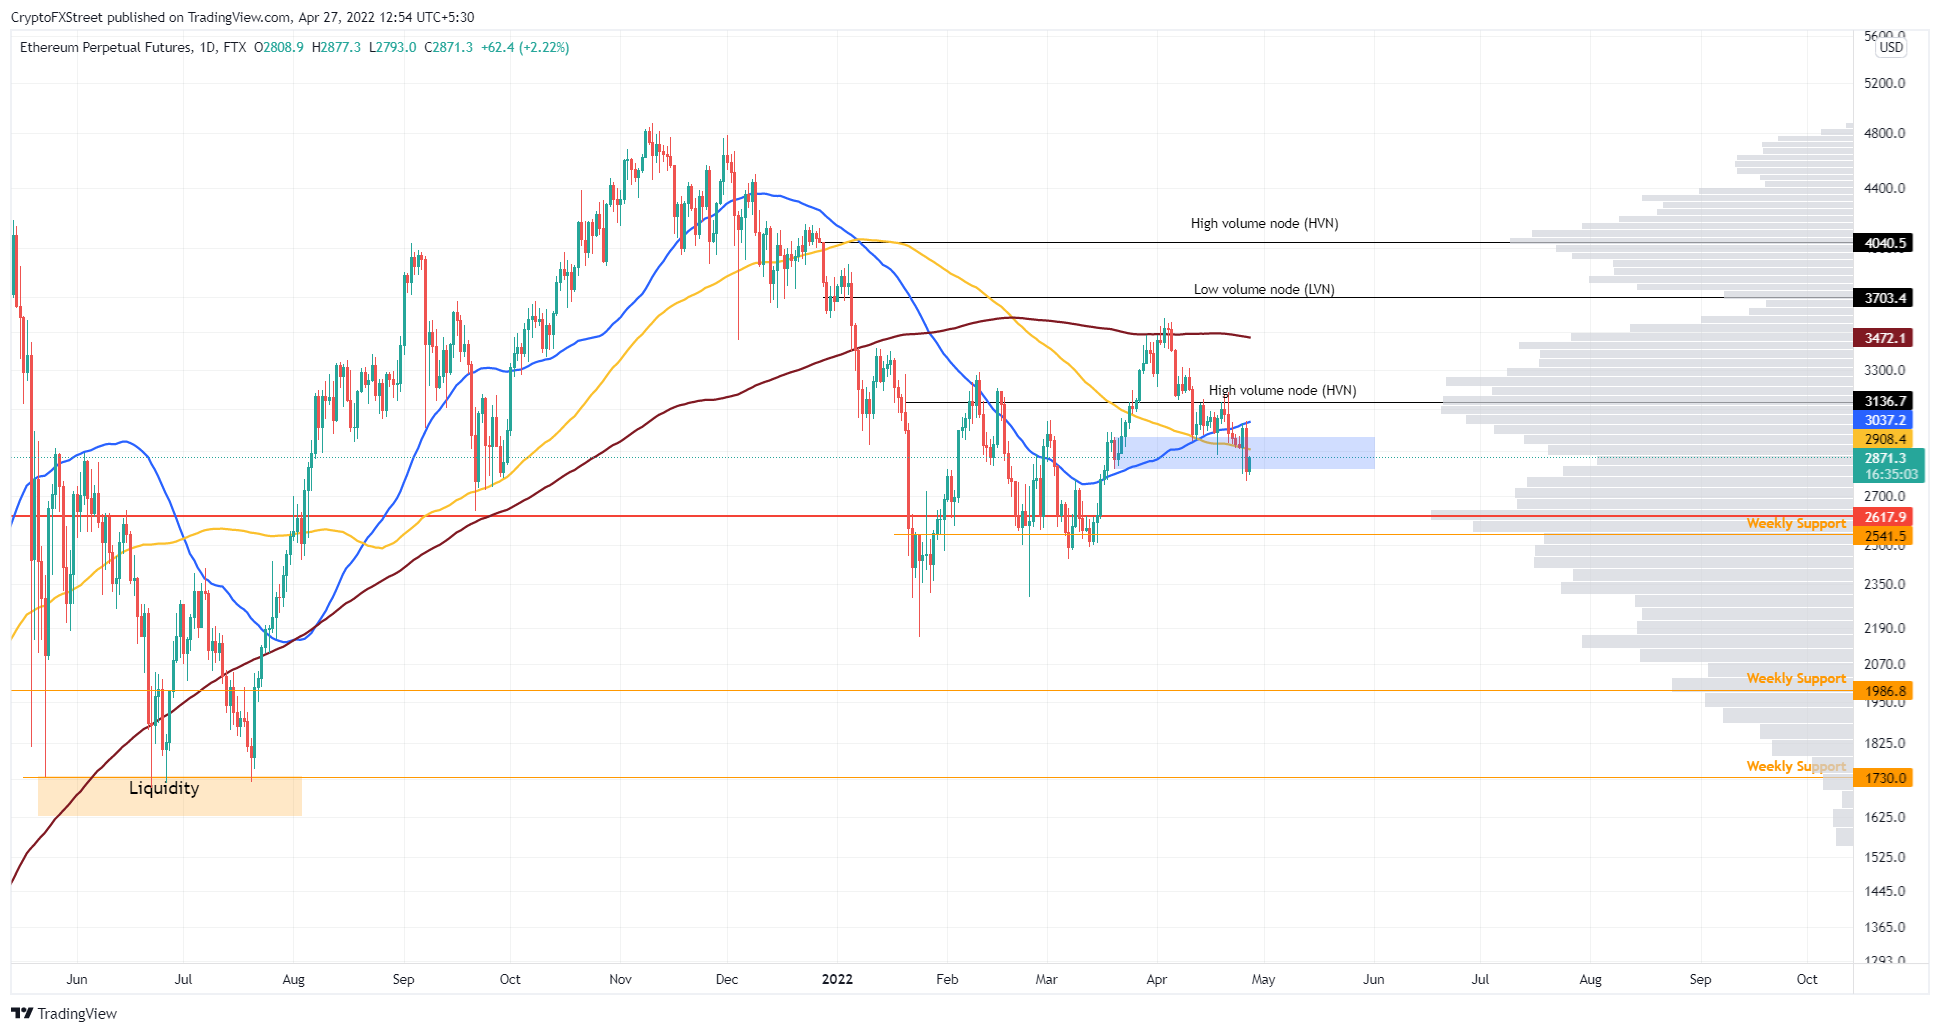
ETH/USD 1-day chart
Regardless of the short-term bullishness, a daily candlestick close below the support cluster’s lower limit at $2,820 will invalidate the bullish thesis by creating a lower low. This move could further trigger a crash to the next high-volume node at $2,584.
Ripple price slides lower
Ripple price has driven lower into the $0.626 to $0.689 buy zone, painting a similar trend seen across Ethereum and Bitcoin. Regardless, the remittance token seems to be holding its own around the $0.626 barrier.
A bounce here could push the XRP price to retest the 50% retracement level at $0.732. Clearing this hurdle will open the path to retest the 2022 volume point of control at $0.768. In total, the ascent would constitute a 17% gain from the current position at $0.652.
Since the point of control is a place where the trade volume for Ripple was the highest, a local top could form there. However, in a highly bullish case, XRP price might extend higher to tag the $0.912 barrier.
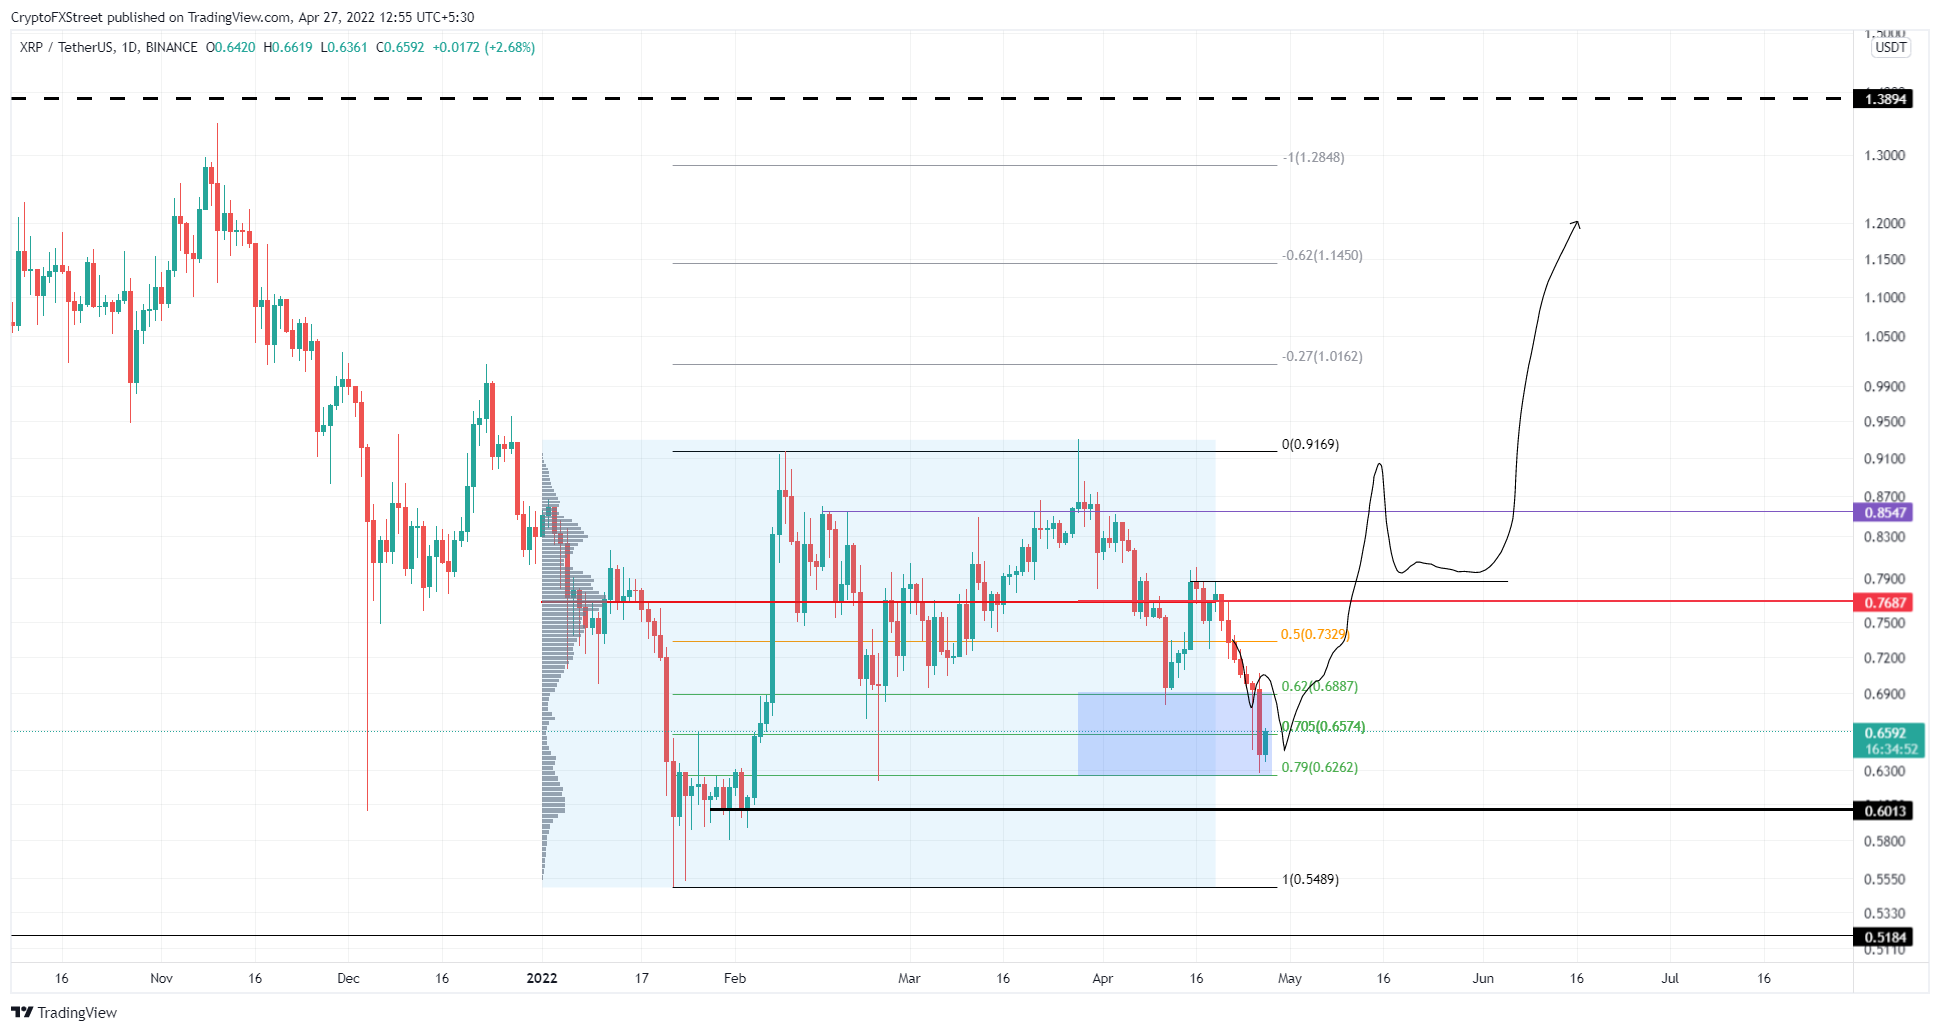
XRP/USD 1-day chart
While the outlook for Ripple price is bullish, a daily candlestick close below the $0.601 support level will produce a lower low and invalidate the bullish thesis. In such a situation, XRP might crash to the $0.548 support level and from there try to reevaluate its directional bias.
Information on these pages contains forward-looking statements that involve risks and uncertainties. Markets and instruments profiled on this page are for informational purposes only and should not in any way come across as a recommendation to buy or sell in these assets. You should do your own thorough research before making any investment decisions. FXStreet does not in any way guarantee that this information is free from mistakes, errors, or material misstatements. It also does not guarantee that this information is of a timely nature. Investing in Open Markets involves a great deal of risk, including the loss of all or a portion of your investment, as well as emotional distress. All risks, losses and costs associated with investing, including total loss of principal, are your responsibility. The views and opinions expressed in this article are those of the authors and do not necessarily reflect the official policy or position of FXStreet nor its advertisers. The author will not be held responsible for information that is found at the end of links posted on this page.
If not otherwise explicitly mentioned in the body of the article, at the time of writing, the author has no position in any stock mentioned in this article and no business relationship with any company mentioned. The author has not received compensation for writing this article, other than from FXStreet.
FXStreet and the author do not provide personalized recommendations. The author makes no representations as to the accuracy, completeness, or suitability of this information. FXStreet and the author will not be liable for any errors, omissions or any losses, injuries or damages arising from this information and its display or use. Errors and omissions excepted.
The author and FXStreet are not registered investment advisors and nothing in this article is intended to be investment advice.
Recommended Content
Editors’ Picks

Bitcoin Weekly Forecast: BTC nosedives below $95,000 as spot ETFs record highest daily outflow since launch
Bitcoin price continues to edge down, trading below $95,000 on Friday after declining more than 9% this week. Bitcoin US spot ETFs recorded the highest single-day outflow on Thursday since their launch in January.

Bitcoin crashes to $96,000, altcoins bleed: Top trades for sidelined buyers
Bitcoin (BTC) slipped under the $100,000 milestone and touched the $96,000 level briefly on Friday, a sharp decline that has also hit hard prices of other altcoins and particularly meme coins.

Solana Price Forecast: SOL’s technical outlook and on-chain metrics hint at a double-digit correction
Solana (SOL) price trades in red below $194 on Friday after declining more than 13% this week. The recent downturn has led to $38 million in total liquidations, with over $33 million coming from long positions.

SEC approves Hashdex and Franklin Templeton's combined Bitcoin and Ethereum crypto index ETFs
The SEC approved Hashdex's proposal for a crypto index ETF. The ETF currently features Bitcoin and Ethereum, with possible additions in the future. The agency also approved Franklin Templeton's amendment to its Cboe BZX for a crypto index ETF.

Bitcoin: 2025 outlook brightens on expectations of US pro-crypto policy
Bitcoin (BTC) price has surged more than 140% in 2024, reaching the $100K milestone in early December. The rally was driven by the launch of Bitcoin Spot Exchange Traded Funds (ETFs) in January and the reduced supply following the fourth halving event in April.

Best Forex Brokers with Low Spreads
VERIFIED Low spreads are crucial for reducing trading costs. Explore top Forex brokers offering competitive spreads and high leverage. Compare options for EUR/USD, GBP/USD, USD/JPY, and Gold.