Top 3 Price Prediction Bitcoin, Ethereum, Ripple: Cryptos hit market bottom, but downtrend not completely broken
- Bitcoin price is on track to tank towards $39,780 but looks to be building a small floor as the RSI bottoms out.
- Ethereum price action bounces off $3,018 and looks ready to start a minor reversal towards $3,391.
- XRP bears could get trapped as bulls make U-turns and stand ready to enter back above the ascending trend line.

Bitcoin price action has been on the back foot for most of the week, together with most cryptocurrencies. Investors are worried about the FED tightening monetary policy going forward and geopolitical tensions that could risk escalating into a full-scale war, such as between the US and Russia, with Europe caught in the middle. Bitcoin this morning looks ready to start building a floor, with $44,088 in sight as a near-term profit target. For Ethereum, a similar and more clear story is unfolding where $3,018 holds as a floor, with the monthly S1 support pivot and more upside set towards the intersection between the 200-day Simple Moving Average (SMA) and the red descending trend line. For Ripple, the headwinds are weighing more on XRP price action which is making a break below the short-term ascending trend line. Bears are being pushed back against that same trend line this morning, in a bear trap targeting $0.88 to the upside.
Bitcoin price sees RSI bottoming out as bulls stick around for the entry when tailwinds pick up speed
Bitcoin (BTC) price saw bulls pushed back at $44,088 when an attack above got rejected and price action got pushed to the downside, back towards $39,780. Bulls are standing pat, however, and hanging around to jump on the Bitcoin train once it takes off, with global markets finally shaking off the headwinds that are making headlines this week. Proof of that is in the Relative Strength Index (RSI), which keeps hovering below 40 and shows buyers are present and buying into short dips as they arise.
Once global markets take off and European and US futures can book gains this could open the door to a quick reversal higher. Cryptocurrencies could benefit from a spillover effect where investors will pick up cryptocurrencies that are trading near-monthly or even quarterly lows. In such a scenario the RSI would pop above 50 and attract more investors, with Bitcoin price getting squeezed upwards towards $44,088 – and $50,019 where the 55-day SMA would cross back above the 200-day SMA, forming a golden cross, the best bullish signal to have to start a solid longer-term uptrend.
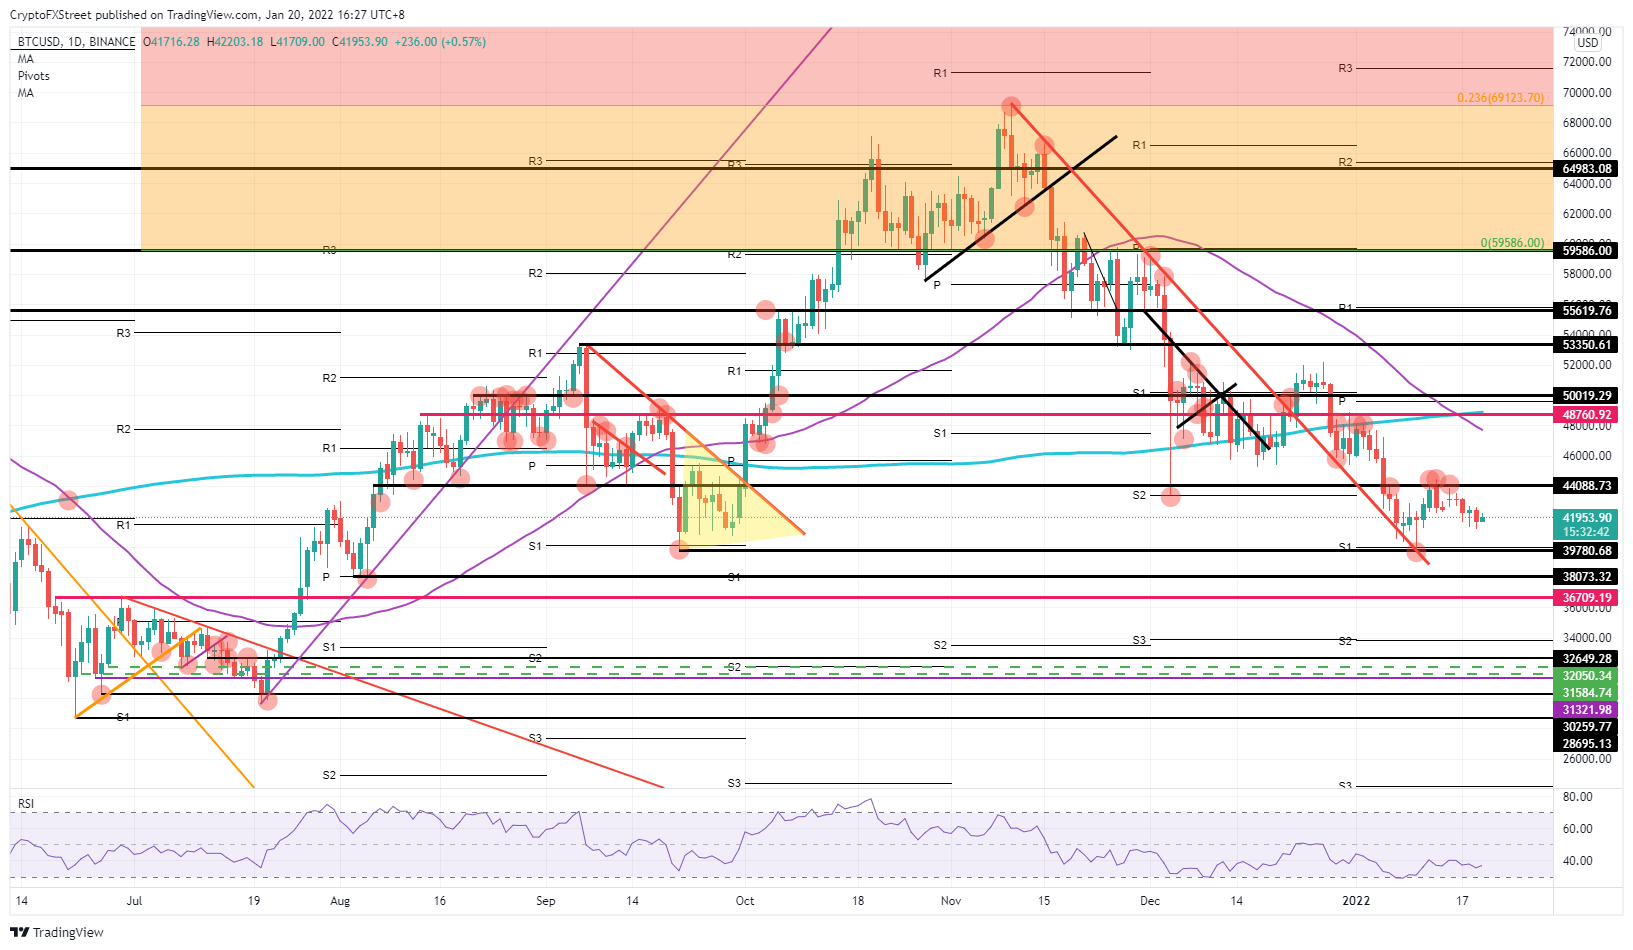
BTC/USD daily chart
Any uptick could still constitute a false breakout, however, and see Bitcoin price forming a false bottom. Bitcoin price might then break through the false bottom and touch base at $39,780 and even dip lower as bearish momentum gathers pace, ticking $36,709. If headwinds start to weigh further with, for example, Russia starting a war, or US equities getting into correction territory, Bitcoin price could correct back down to $34,000, with the monthly S2 support level as an element halting the downtrend.
Ethereum takes a stab at bears and tries to break above yesterday’s high
Ethereum (ETH) price is in a slightly different pattern to Bitcoin. There is no bottoming out here but rather a bounce off a technical floor around $3,018, made up of the monthly S1 support level and a historical support level. The uptick looks promising and is reflected in the RSI, which is undergoing a bullish knee-jerk reaction, pointing to demand from buyers outstripping sellers.
As long as ETH price can thrive off the tailwinds in global markets, it could go into the end of the trading week with gains that would bring ETH price towards $3,391 in the first phase. Although all-in-all Ethereum would still be in a downtrend, price action would be very close to the red descending trend line and the 200-day SMA intersection at $3,490. This would set the stage for Ethereum to get out of the downtrend either at the weekend or at the beginning of next week if global markets can build further on the change to risk-on.
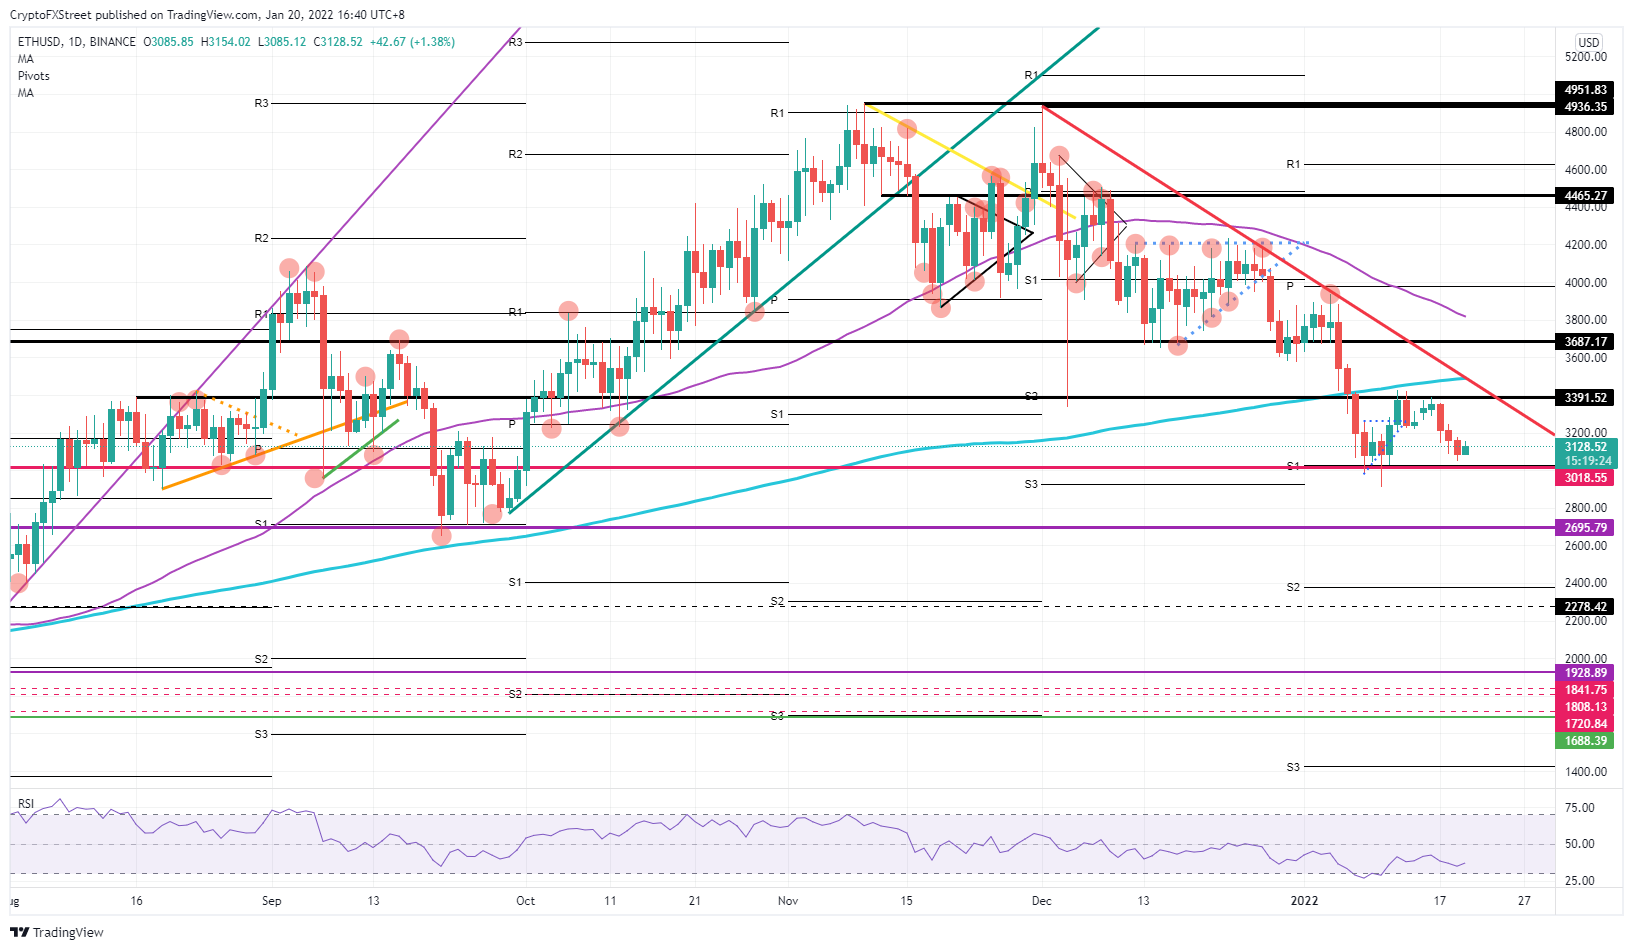
ETH/USD daily chart
Negative headlines, however, could easily break any fragile growth spurts that seem to emerge in today’s trading session, from either economic data, geopolitical news or monetary tightening. A fall back towards $3,018 would be the first reaction with pressure mounting for a nosedive towards $2,695, as the $3,000 level will hold quite a lot of stop losses that will get triggered in the selloff. This could bring some more Grimm price action for ETH in the days to come after the break below $3,000.
XRP price has bulls attempting to perform a bear trap with a U-turn up to $0.84
Ripple (XRP) saw a break and close below the green ascending trend line, which did not help bulls to build a case for an entry to the upside. Although the RSI is nudging back up today and seeing investors entering in large numbers as they sell, volume is being overtaken by buying volume, which pumps up the price to the upside. Expect a break above the green ascending trend line once the US session gains traction.
XRP bulls are expected to play this in two phases. The first would see price pierce the pennant formation and $0.78. This ground could be covered on Friday, with $0.84 attainable going into the weekend. Should XRP price break above that monthly pivot and the 55-day SMA coming in at this level, that would put bulls in the driving seat for Monday when markets open higher and price action could get lifted to $0.88.
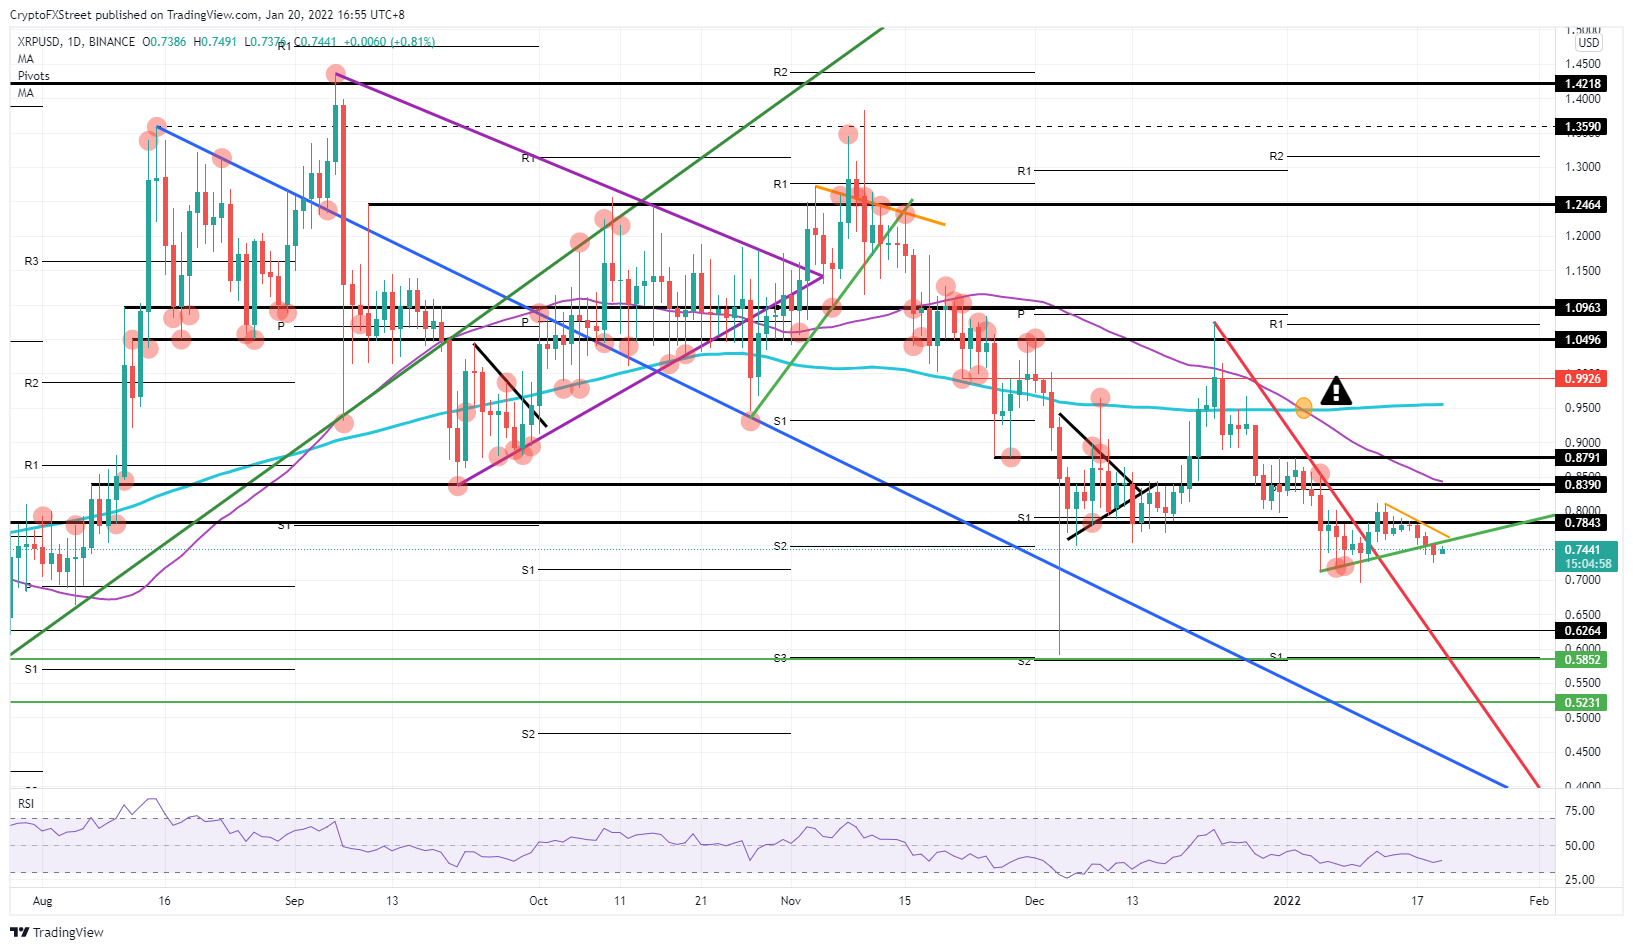
XRP/USD daily chart
As one of the primary vital events next week will be the FED rate decision, many market participants will want to stay out of the markets until after the meeting. Expect bulls to face resistance from bears around $0.78 with a good chance they could be rejected there, and see price fall back towards $0.70. As this area has only been tested on thin volumes, expect this sell-off to see continuation towards $0.62 or even $0.59, with the monthly S1 support level catching any falling knives as happened on December 04.
Author

Filip Lagaart
FXStreet
Filip Lagaart is a former sales/trader with over 15 years of financial markets expertise under its belt.