Top 3 Price Prediction Bitcoin, Ethereum, Ripple: Cryptos going vertical!
- Bitcoin price has risen by 6% and has re-entered the $20,000 price zone.
- Ethereum price rallies back to $1,450, a 22% increase since January 1.
- XRP price is up 3% on the day and aims to rise above $0.40.

The crypto market has made a full u-turn and is charging north impulsively. The vertical incline being displayed could extend towards much higher targets.
Bitcoin price back to $25,000?
Bitcoin price is up 6% on the day, making the trending relief rally a 20% gainer since January 1. The daily spike (now the largest daily gainer of the month) has gone completely vertical, breaching past a trendline that halted previous uptrend attempts throughout the fall.
Bitcoin price currently auctions at $20,017. Zooming out, the previous range shows converging trendlines from the June 18 low and August 15 high, as the BTC price failed to break each side of the range throughout the summer and fall. Elliott Wave practitioners suggest that an "Ending Diagonal" as a possible explanation for the confining range.
If the recently breached trend line is a part of an ending diagonal pattern (commonly found near market reversals) the bullish target zones could be the fialnals origin point above the August high resulting in an additional 25% rally from Bitcoin's price today.
A Fibonacci retracement level from the bullish cross of the 8-day exponential moving average and 21-day simple moving average at $16,655 and the $25,000 high shows resistance levels at $20,430 and potentially $21,440. These levels could act as temporary resistance points before BTC ultimately moves toward the anticipated target zone.
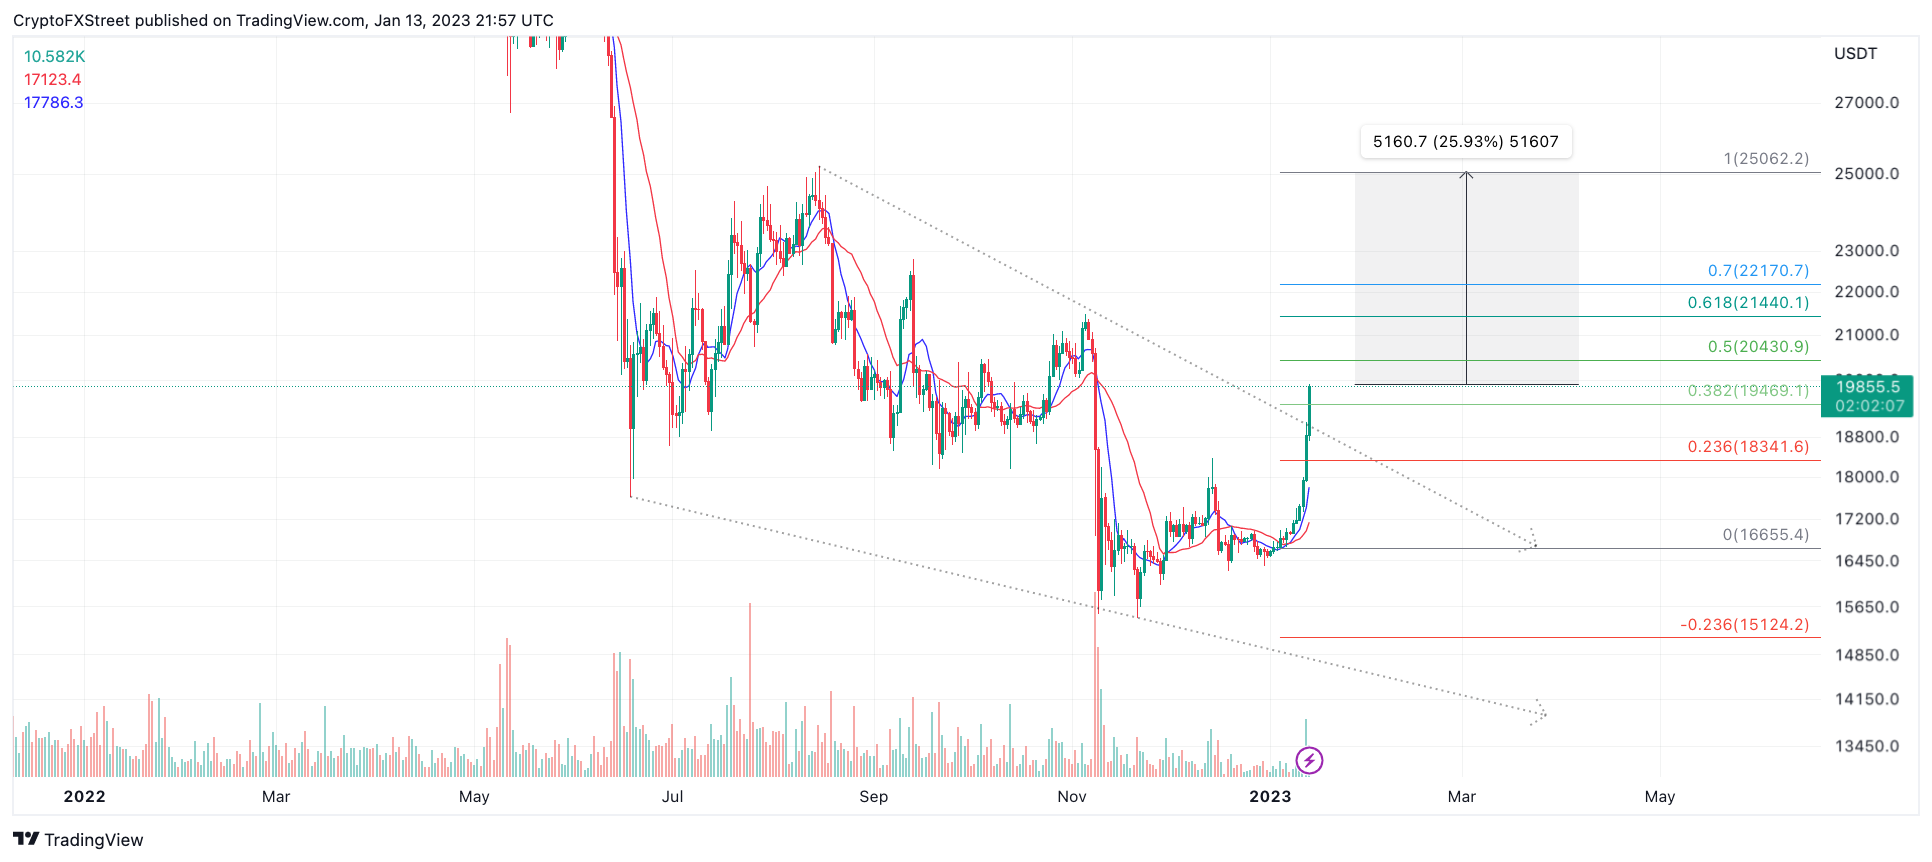
BTC/USDT 1-Day Chart
Invaliartion of the trend s subject to interpretation. Day traders could place their stop loss under the trendline at $17,000, while the conservative Elliott Wave approach would be a breach below the 2022 low at $15,476.
Ethereum price is in profit
Ethereum price has confirmed the bullish bias mentioned throughout the winter and has hit the ideal target at $1,450. Since the beginning of the month, analysts have been calling for a potential challenge of the mid-$1,400 barrier after ETH crossed over the $1,230 support zone.
Ethereum price currently trades at $1,458. Traders participating in the bullish trade are well in profit as ETH now bolsters a 22% gain since January 1. The next key targets are near $1,600. The price zone is a critical liquidity level that has remained untagged since ETH fell from $1660 to $1,073 during the first week of November.
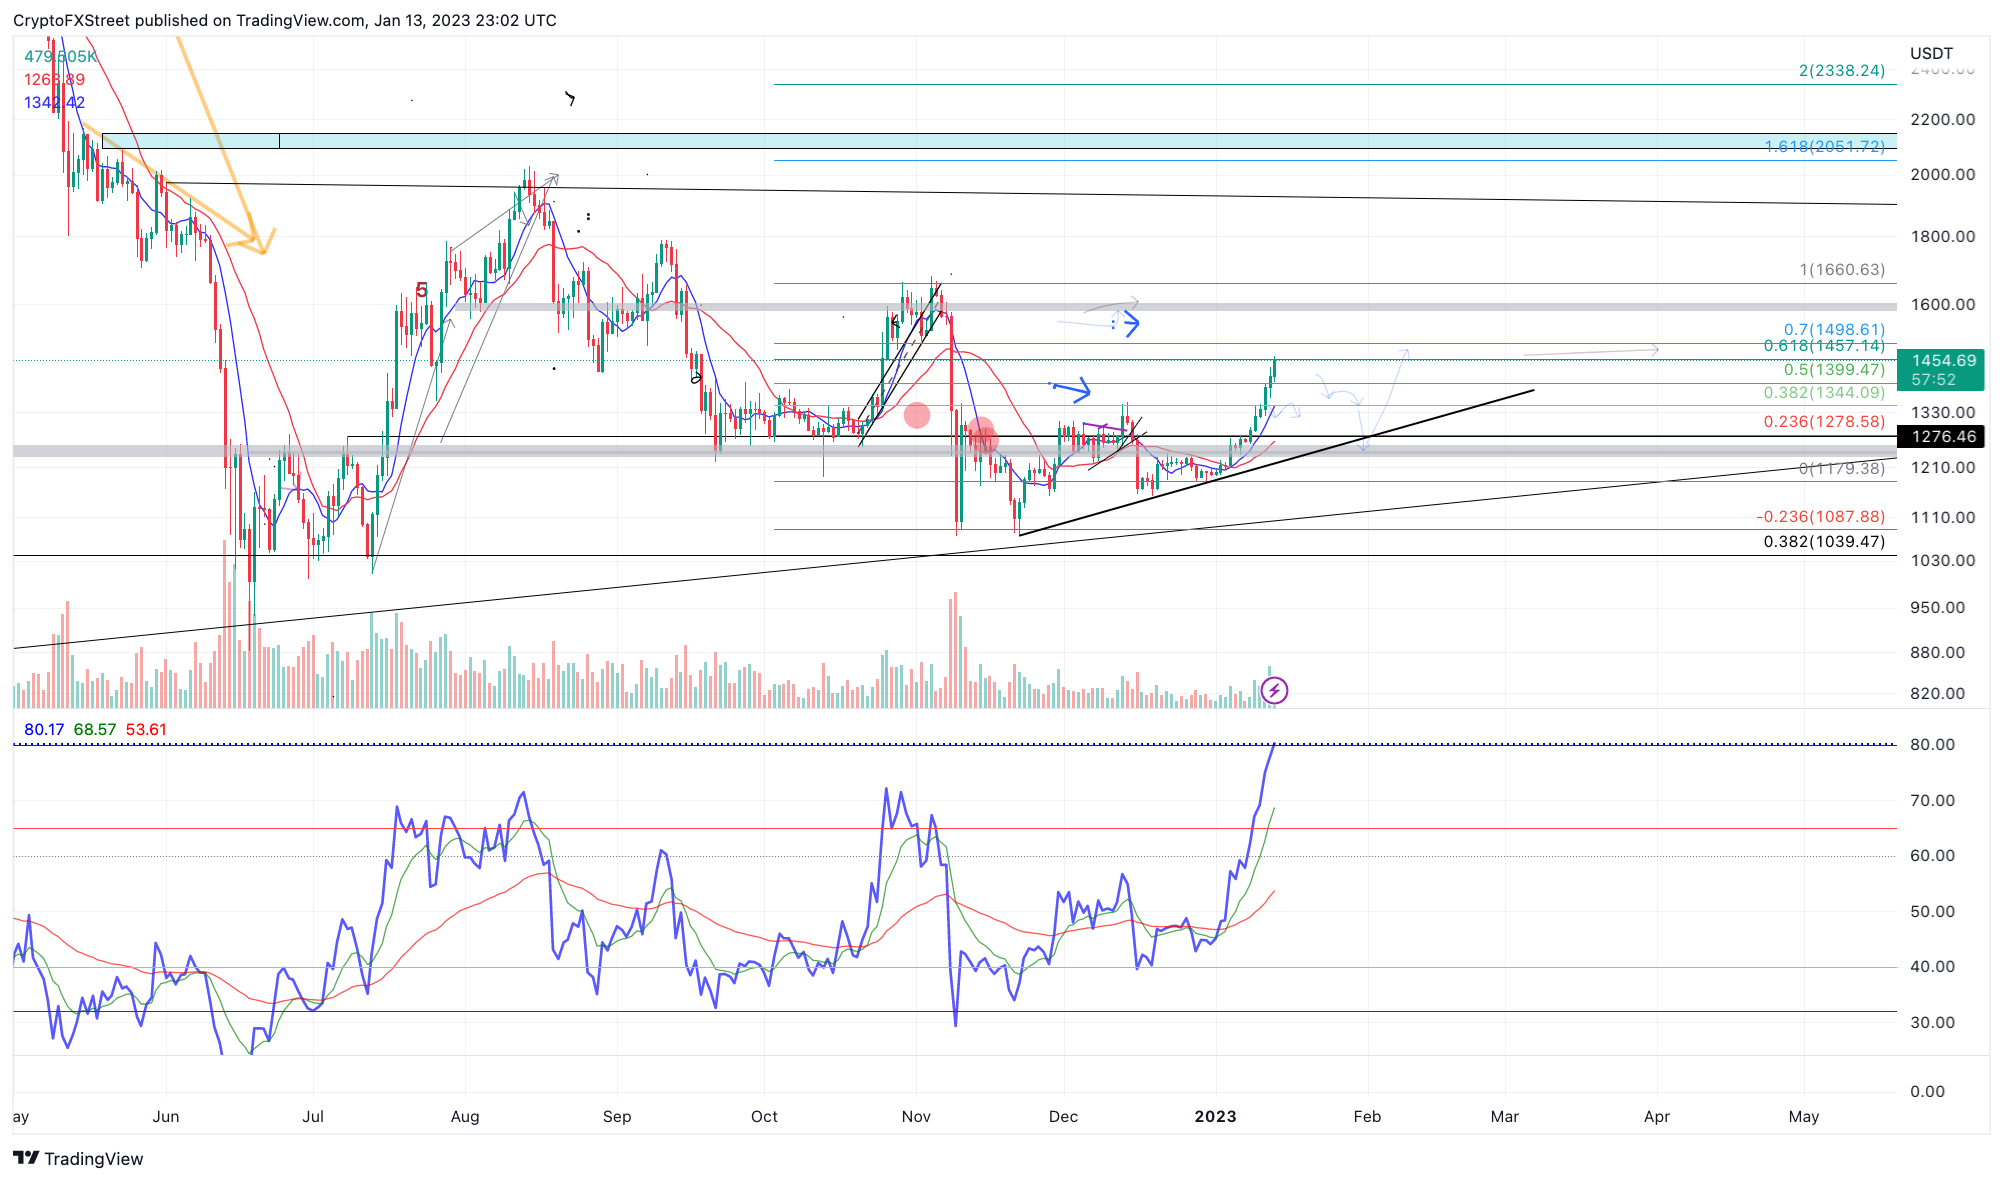
ETH/USDT 1-Day Chart
Invalidation of the trade idea could be placed under the $1,344 pivot point established during the recent trend. A barrier breach could induce a larger retracement targeting the $1,250 zone as support. The ETH price would decline by 15% if the bears were to succeed.
XRP price finally takes off
XRP price continues to ascend as the bulls are up 3% on the daily, bringing the ongoing rally to a 29% increase in market value since January 1. On January 11, the largest influx of volume this year accompanied the developing trend, as 1.6 billion transactions were accounted for on all exchanges during XRP's 7% uptick. The spike in volume is a positive affirmation to suggest bulls' enthusiasm and the beginning stages of a much larger bullrun.
XRP price currently auctions at $0.384. Unlike BTC and Ethereum, The Relative Strength Index has not yet broken out into overbought territory above 70 level on daily timeframe. Breaking out past 70 would be an ideal bullish signal to suggest that Ripple is unfolding a larger impulsive wave. Since it has not yet breached the barrier, the XRP price could be trading range bound, placing a cap above the current uptrend's potential.
Since the trend has gone vertical, much like ETH and BTC, the XRP could be lagging in terms of time instead of strength. Therefore the conservative bullish target at $0.44(mentioned in previous outlooks) still stands a fair chance of being tagged.
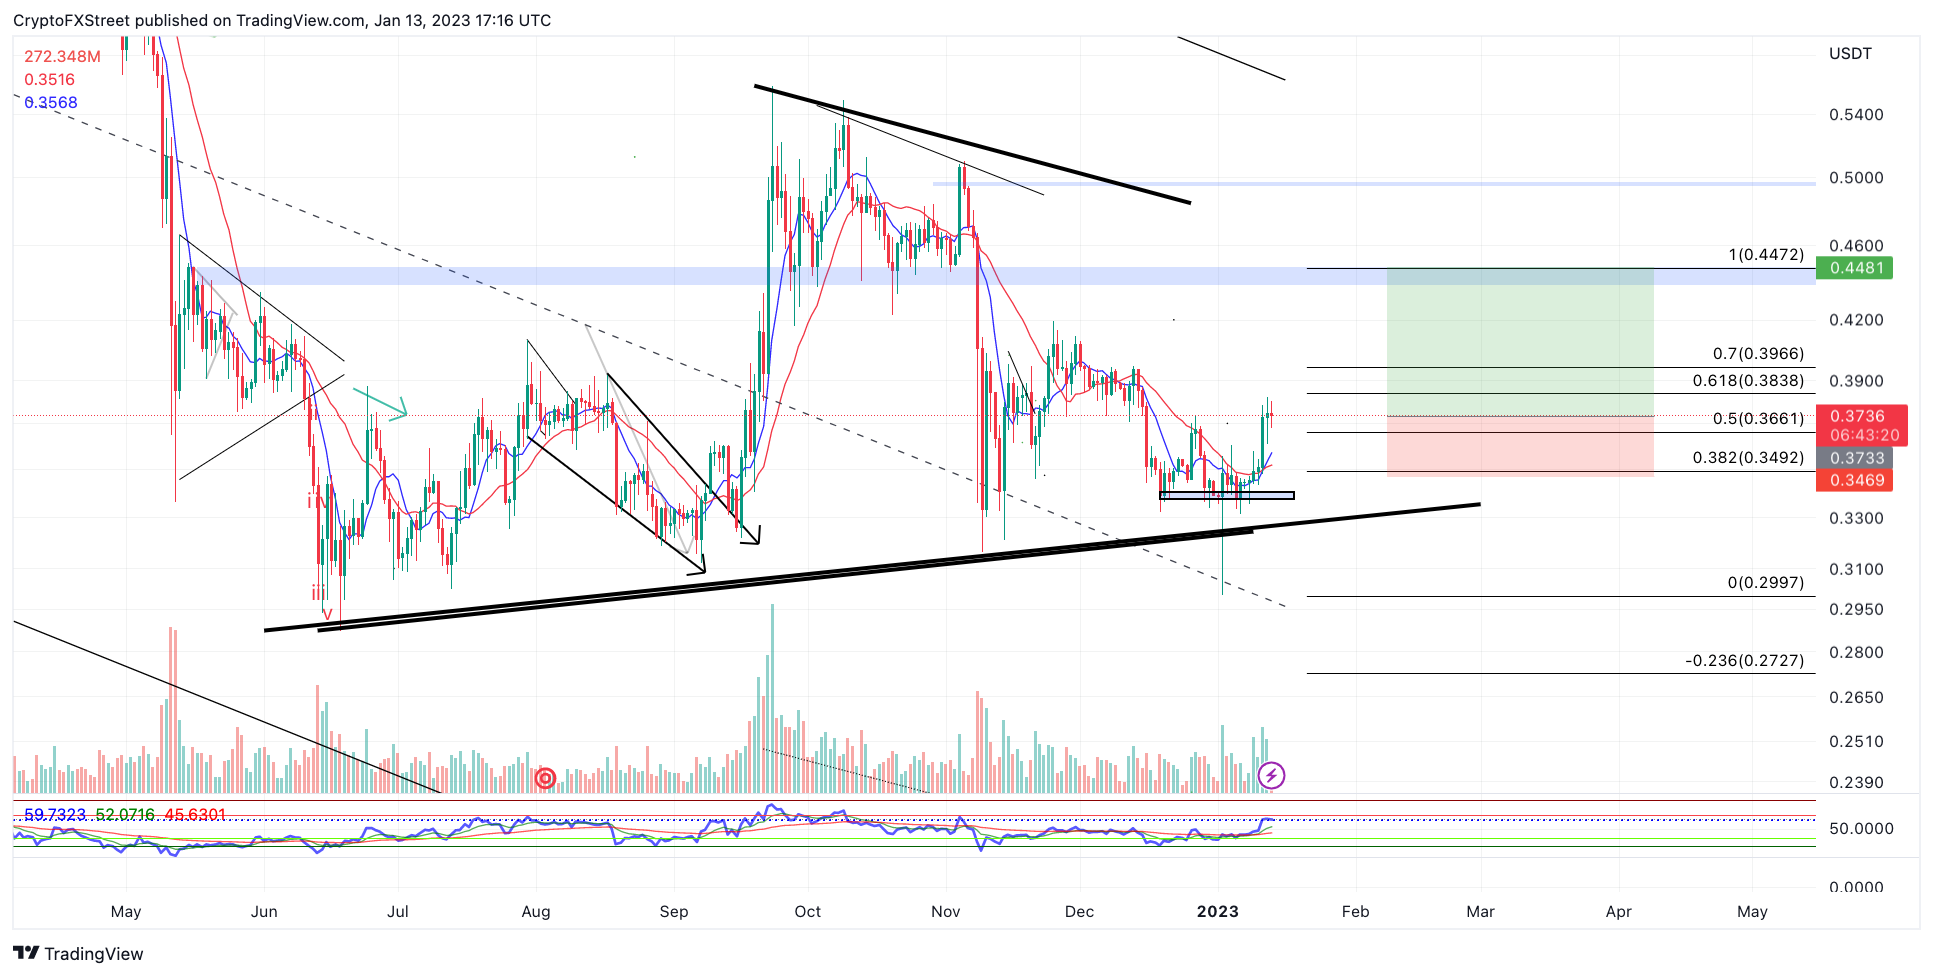
XRP/USDT 1-Day Chart
The earliest evidence of uptrend failure could be a breach of the recently crossed 8-day exponential moving average at $0.35. A tag of the low could induce a second attempt at the $0.30 low resulting in a 20% decrease from XRP's current market value.
Author

Tony M.
FXStreet Contributor
Tony Montpeirous began investing in cryptocurrencies in 2017. His trading style incorporates Elliot Wave, Auction Market Theory, Fibonacci and price action as the cornerstone of his technical analysis.


