- Bitcoin price undergoes a technical rejection as investors book some profit.
- Ethereum price action keeps respecting the bullish triangle with a test on the ascending trend line.
- XRP has investors taking profit after breaking above the 55-day SMA.
Bitcoin price is undergoing a fade to the downside as investors cash in on the Christmas rally. Ethereum price, in its turn, is correcting after bulls got rejected from breaking out of a triangle on Tuesday. Going into Christmas, XRP should see bulls defending the 200-day Simple Moving Average (SMA) as investors book profits after breaking above the 55-day SMA earlier in the Asian session this morning.
Bitcoin price undergoes correction after rejection on the monthly S1 support
Bitcoin (BTC) price was in a nice rally going into Christmas but the trend looks to be hitting a curb at the time of writing as investors book profits and BTC price starts to fade and pull-back. BTC bulls tried to break above $50,155 but the advance got checked, and the opening price this morning during the Asian session already pointed to some sharp profit-taking. Expect BTC to look for support now while bulls hope to keep price action above $50,000 going into the weekend.
BTC bulls will need to watch out as liquidity starts to die down going into the holiday season. Expect the first level of support at $47,565 where the 200-day SMA lies, although it may not provide that much support given it has been chopped up by price action breaking above and below multiple times over the last few days. Instead, look for $47,065 to do the trick as this has held some importance in the past and provided support for higher lows over recent days.
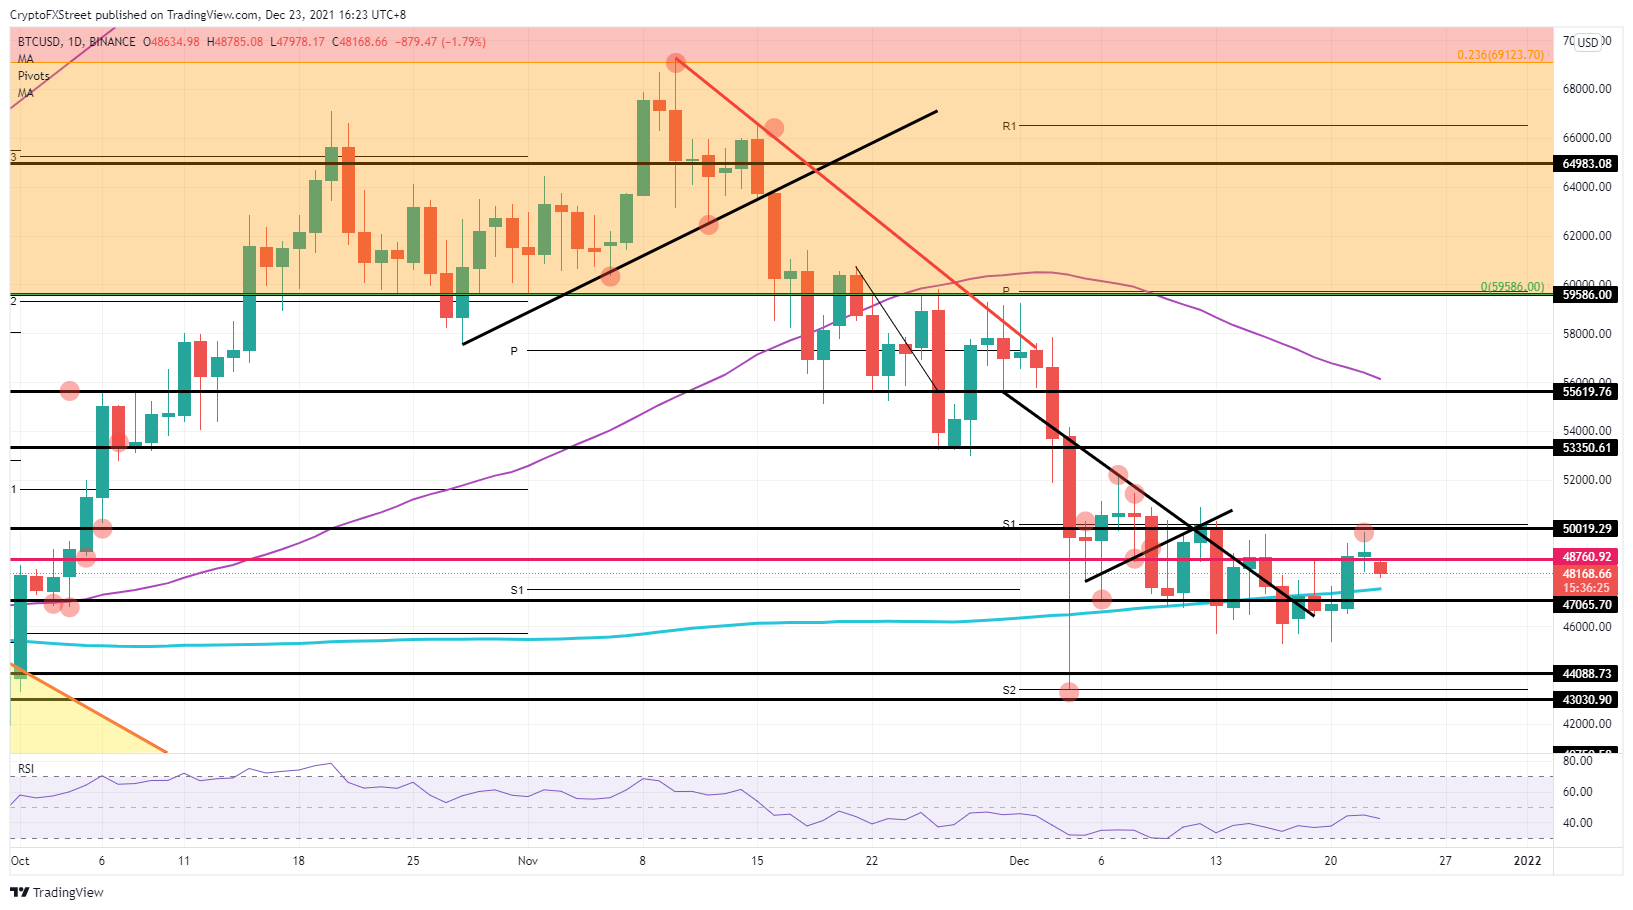
BTC/USD daily chart
Expect bulls to try and reclaim $50,000 going into the last week of trading this year, but with profit-taking and investors pulling their positions during the holidays, expect to see more selling pressure that could trigger another leg lower BTC price. That would bring $44,088 and $43,040 back into play with the monthly S2 support level in the middle of that range. By then the Relative Strength Index (RSI) is also likely to be firmly in oversold territory.
Ethereum price under short-term pressure with failure to uphold $4,000
Ethereum (ETH) price is still trading in a bullish triangle but bulls have failed to deliver a strong signal to the markets because of their inability to consolidate above $4,000. Instead, ETH price is fading to the downside, with price action further drifting away from $4,000. For now, the sloping side of the bullish triangle (dotted ascending blue line) is keeping price action in play and is still performing a squeeze to the upside. But it is hanging by a thread as investors are gently starting to pull out of their investments just before the start of the holiday season.
ETH prices could see more downward pressure as investors continue with their profit-taking. A break below the ascending trend line would accelerate the trend of investors pulling out of ETH, resulting in more downside towards $3,687. This level kicked off the bullish triangle and will be a profit target for short sellers to squeeze bulls out of their initial entry position. If more headwinds arise or cryptocurrencies experience more divestment before the holidays, even $3,391 could be on the cards, which would mean a 14% devaluation.
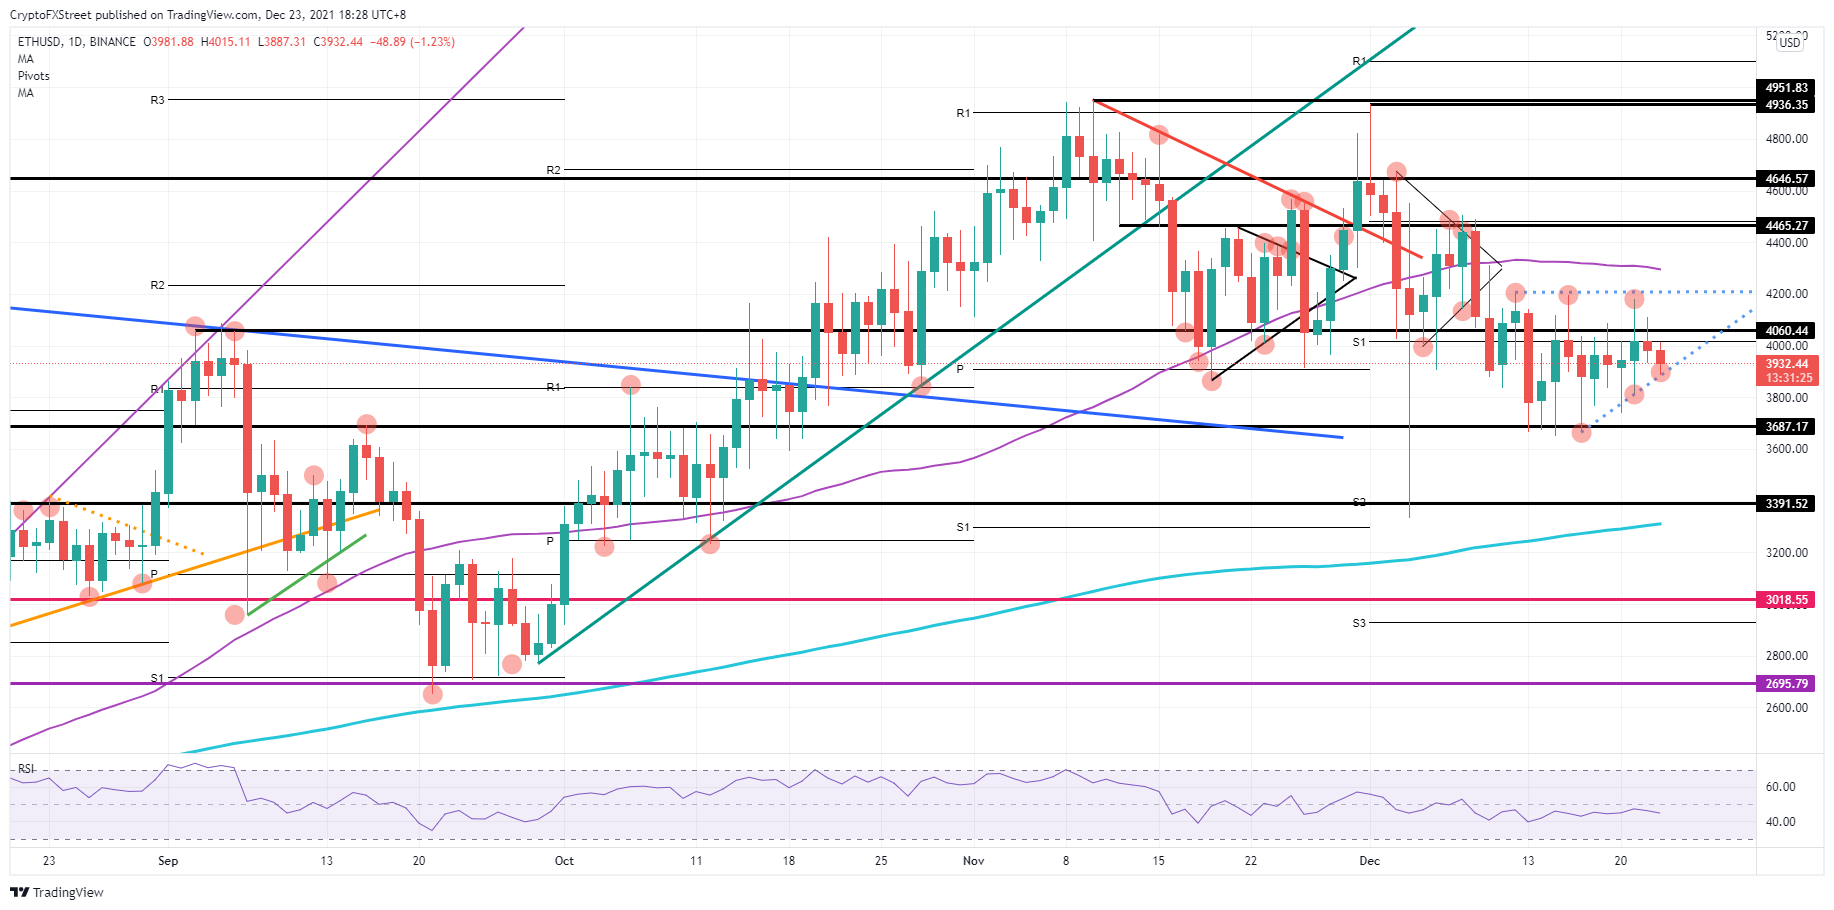
ETH/USD daily chart
If the bullish triangle plays out, expect price action to bounce off the sloping bottom edge and for bears to get pushed up against $4,200. A punch through that level could see a breakout higher as sellers capitulate. Although bulls would quickly face the 55-day SMA at $4,300, expect to see an accelerated push to the upside as thin liquidity enables them to quickly cover significant ground towards $4,465.
XRP price caught between two technical price levels
Ripple (XRP) price investors are taking some profit from other cryptocurrencies after breaking above the 55-day SMA at $1.00. This should come as no surprise as XRP price action already rallied 23% in the last few days. Investors will want to cash in and diminish some risk over the holiday period.
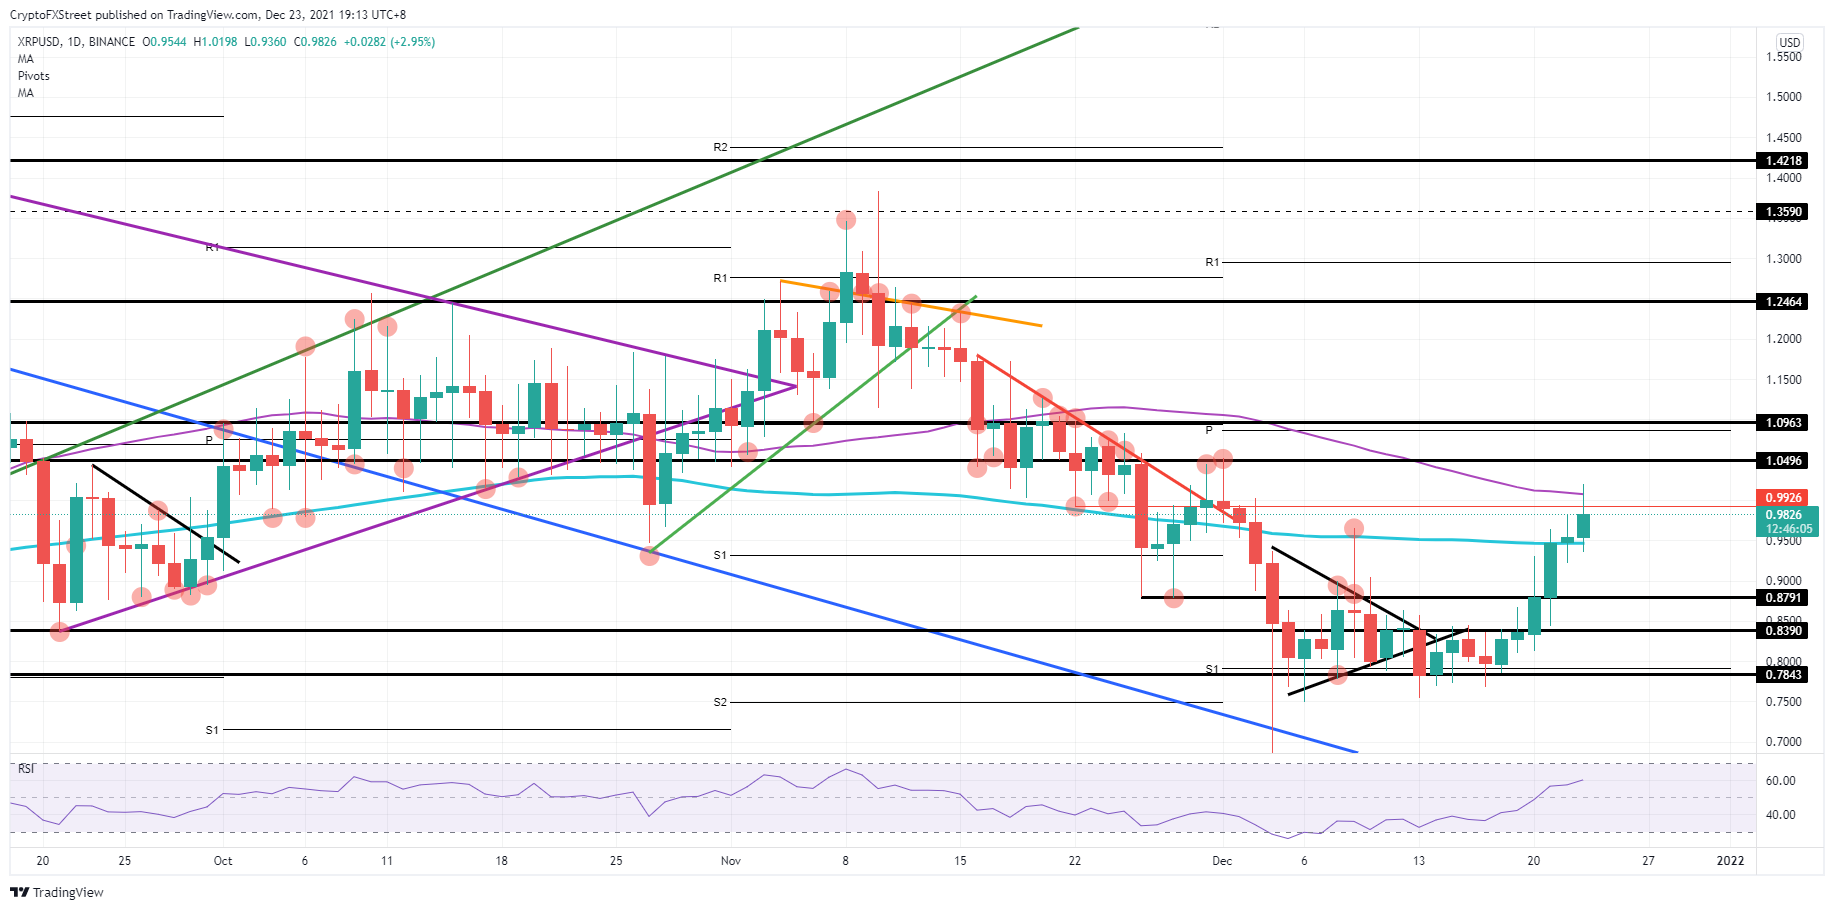
XRP/USD daily chart
Expect XRP price to be supported by the 200-day SMA at $0.95, which already has proven critical at previous highs and lows where it got supported or rejected on previous attempts. This way, XRP has the best outlook for a fresh start that favors bulls going into the new year. Expect a further continuation to lead to a break above the 55-day SMA, and then target $1.10, with the monthly pivot as a place for the second leg in the rally to pause.
Information on these pages contains forward-looking statements that involve risks and uncertainties. Markets and instruments profiled on this page are for informational purposes only and should not in any way come across as a recommendation to buy or sell in these assets. You should do your own thorough research before making any investment decisions. FXStreet does not in any way guarantee that this information is free from mistakes, errors, or material misstatements. It also does not guarantee that this information is of a timely nature. Investing in Open Markets involves a great deal of risk, including the loss of all or a portion of your investment, as well as emotional distress. All risks, losses and costs associated with investing, including total loss of principal, are your responsibility. The views and opinions expressed in this article are those of the authors and do not necessarily reflect the official policy or position of FXStreet nor its advertisers. The author will not be held responsible for information that is found at the end of links posted on this page.
If not otherwise explicitly mentioned in the body of the article, at the time of writing, the author has no position in any stock mentioned in this article and no business relationship with any company mentioned. The author has not received compensation for writing this article, other than from FXStreet.
FXStreet and the author do not provide personalized recommendations. The author makes no representations as to the accuracy, completeness, or suitability of this information. FXStreet and the author will not be liable for any errors, omissions or any losses, injuries or damages arising from this information and its display or use. Errors and omissions excepted.
The author and FXStreet are not registered investment advisors and nothing in this article is intended to be investment advice.
Recommended Content
Editors’ Picks

IRS says crypto staking should be taxed in response to lawsuit
The IRS stated that rewards from cryptocurrency staking are taxable upon receipt, according to a Bloomberg report on Monday, which stated the agency rejected a legal argument that sought to delay taxation until such rewards are sold or exchanged.

Solana dominates Bitcoin, Ethereum in price performance and trading volume: Glassnode
Solana is up 6% on Monday following a Glassnode report indicating that SOL has seen more capital increase than Bitcoin and Ethereum. Despite the large gains suggesting a relatively heated market, SOL could still stretch its growth before establishing a top for the cycle.

Ethereum Price Forecast: ETH risks a decline to $3,000 as investors realize increased profits and losses
Ethereum is up 4% on Monday despite increased selling pressure across long-term and short-term holders in the past two days. If whales fail to maintain their recent buy-the-dip attitude, ETH risks a decline below $3,000.

Crypto Today: BTC hits new Trump-era low as Chainlink, HBAR and AAVE lead market recovery
The global cryptocurrency market cap shrank by $500 billion after the Federal Reserve's hawkish statements on December 17. Amid the market crash, Bitcoin price declined 7.2% last week, recording its first weekly timeframe loss since Donald Trump’s re-election.

Bitcoin: 2025 outlook brightens on expectations of US pro-crypto policy
Bitcoin price has surged more than 140% in 2024, reaching the $100K milestone in early December. The rally was driven by the launch of Bitcoin Spot ETFs in January and the reduced supply following the fourth halving event in April.

Best Forex Brokers with Low Spreads
VERIFIED Low spreads are crucial for reducing trading costs. Explore top Forex brokers offering competitive spreads and high leverage. Compare options for EUR/USD, GBP/USD, USD/JPY, and Gold.