Top 3 Price Prediction Bitcoin, Ethereum, Ripple: Crypto markets to kick-start relief rally


  • Bitcoin price remains struggling between $36,400 and $46,200 with no directional bias.
  • Ethereum price takes steps to sidestep the bearish outlook but has not succeeded yet.
  • Ripple price maintains its bullish outlook and eyes a retest of $1.

Bitcoin price saw a massive spike ahead of the Federal Open Market Committee (FOMC) meeting on March 16. The rally was brief, however, and has been undone, suggesting that BTC is likely to head lower before any noticeable uptrends resume. While Ethereum follows the big crypto’s lead, Ripple and other altcoins are likely to take advantage and rally.

Also read: Gold Price Forecast: XAUUSD consolidating gains around $1,940.00

Bitcoin price attempts a quick run-up

Bitcoin price has tagged the $36,398 to $38,895 demand zone multiple times and shows no signs of breaking out from this consolidation range. This coiling up of price action for BTC is most likely going to resolve lower if ongoing developments in the traditional markets worsen. 

A daily candlestick close below $36,398 will invalidate the said demand zone and open the path for bears to knock BTC down to the weekly support level at $34,752, which is the last line of defense.

A breakdown of this foothold will indicate that Bitcoin price could crash to $30,000 to collect liquidity resting below the equal lows formed in mid-2021.
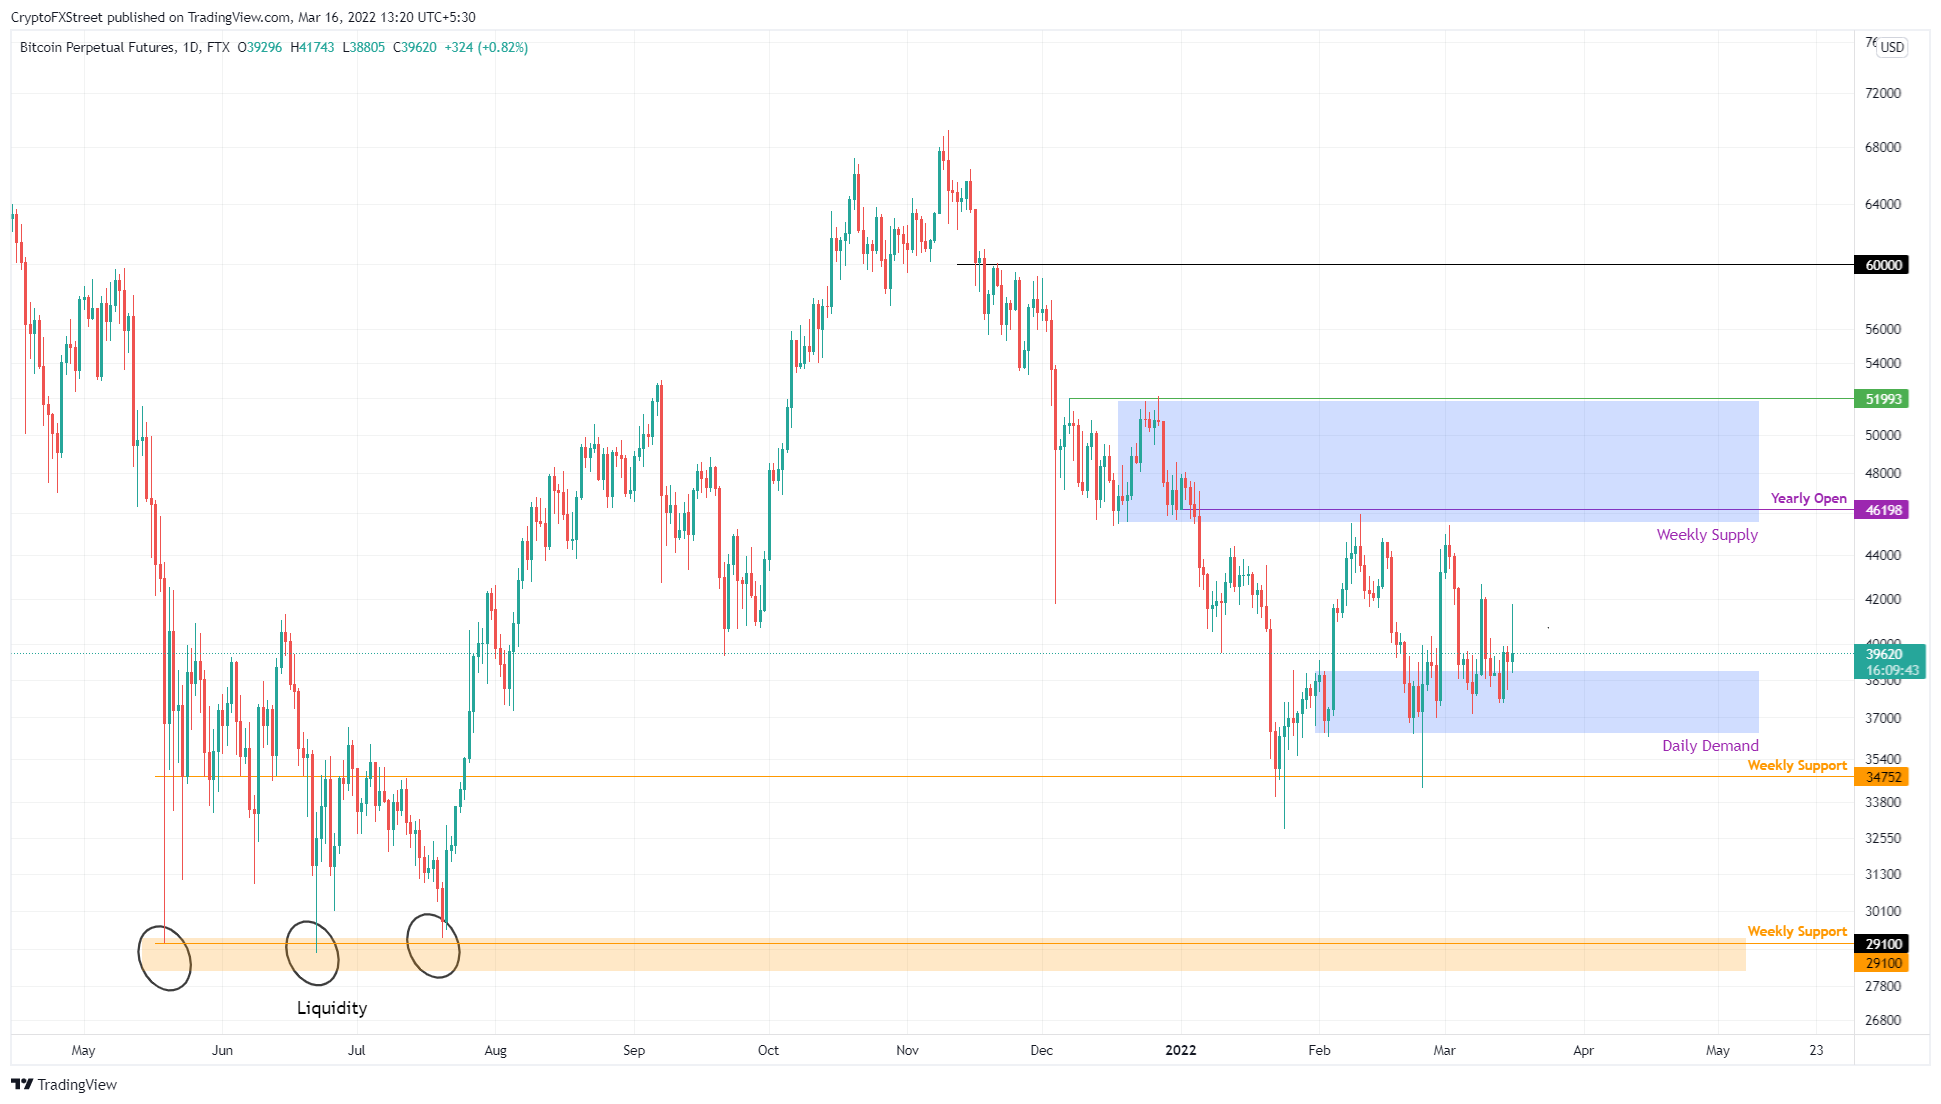
BTC/USD 1-day chart

BTC/USD 1-day chart

While things look bearish for Bitcoin price, a daily candlestick close above $52,000 will create a higher high, invalidating the bearish thesis.

Ethereum price attempts to prevent bearish fate

Ethereum price has set up three lower highs and higher lows, which, when connected using trend lines, reveals a symmetrical triangle. This technical formation forecasts a 26% crash to $1,962, obtained by adding the distance between the first swing high and low to the breakout point at $2,631.

ETH already breached the pattern on March 6, but it has had trouble heading lower due to the weekly support level at $2,541. A decisive move below this level could be the key to seeing ETH head down to the $2,000 psychological level or lower.
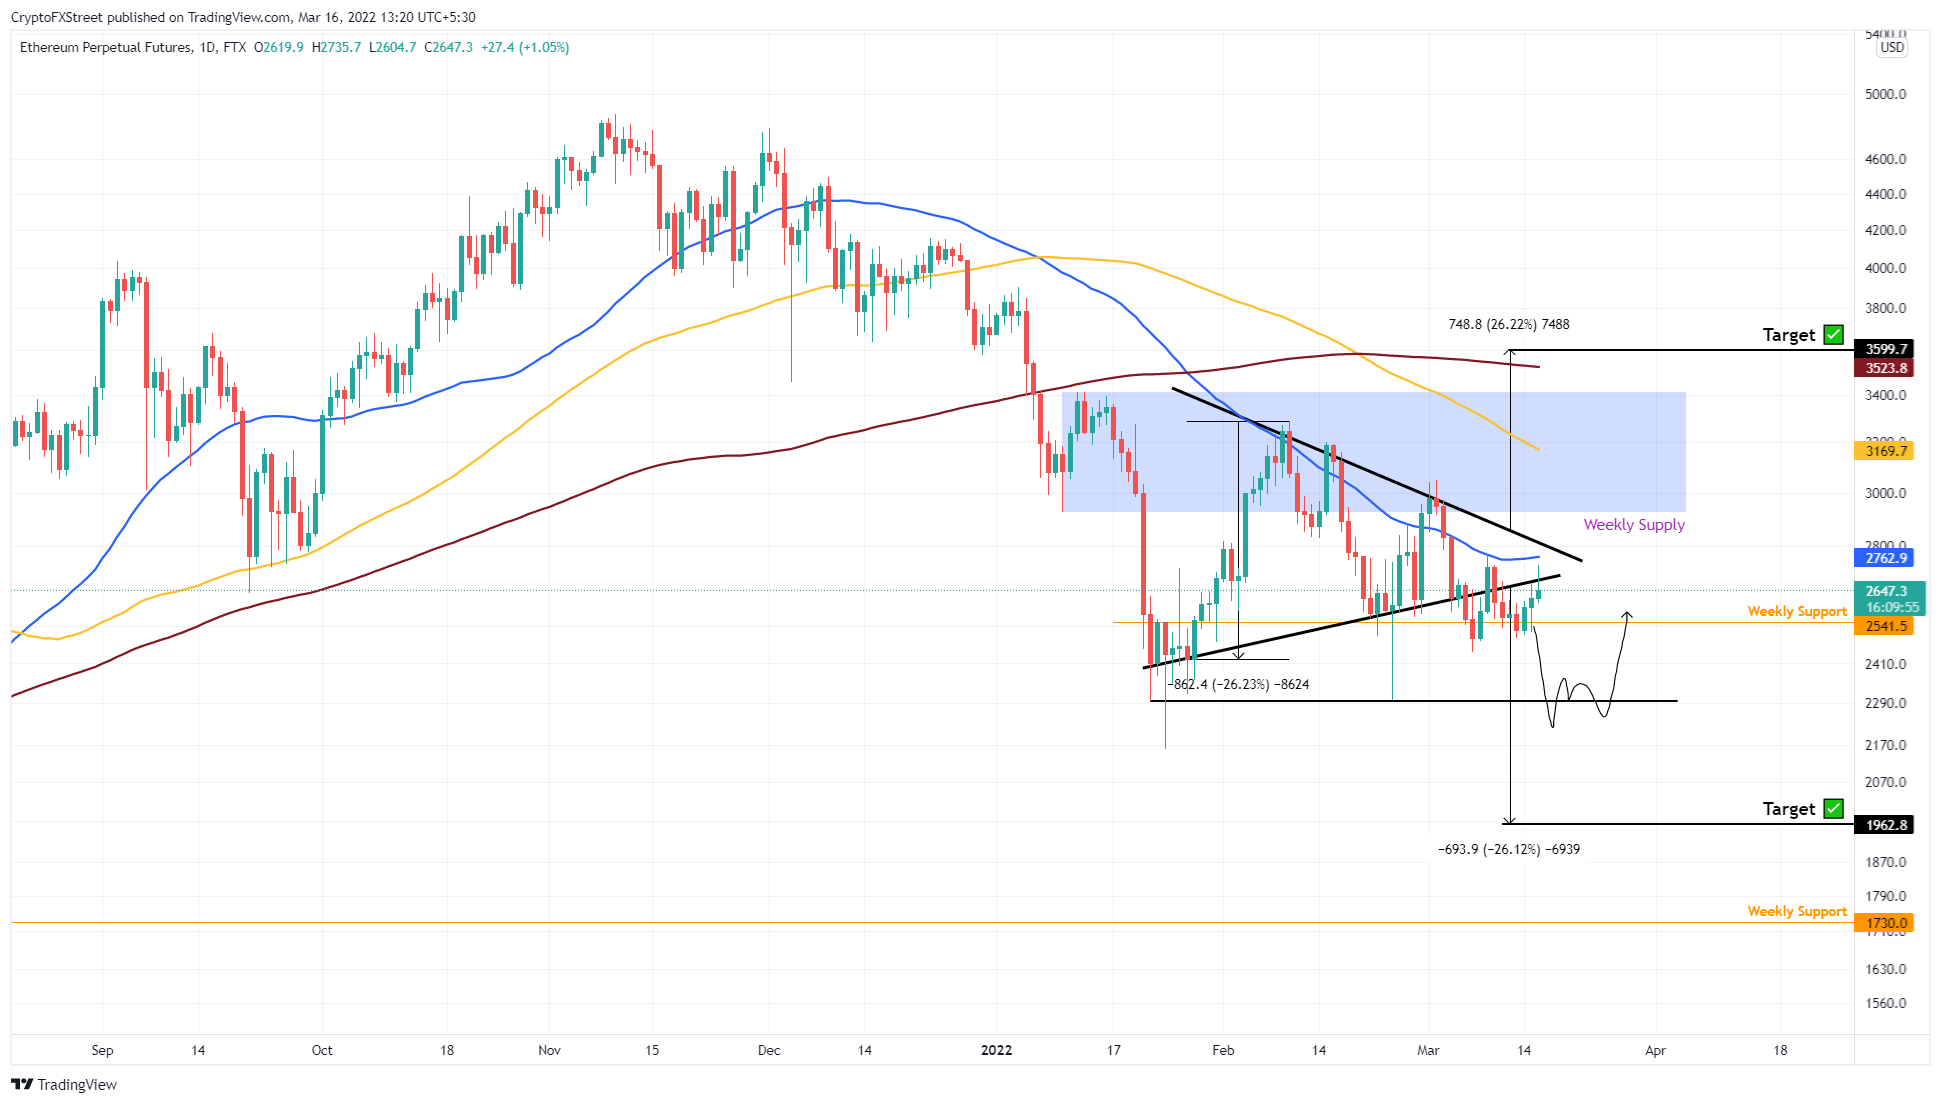
ETH/USD 1-day chart

ETH/USD 1-day chart

A bearish outlook seems the most logical outcome, and a resurgence of buying pressure will have a tough time pushing ETH higher. The resistance levels extending from $2,762 to $3,523 will be a formidable barrier to breach. Only a daily candlestick close above $3,600 will invalidate the bearish thesis for Ethereum price.

Ripple price hangs on

Ripple price formed a bull flag pattern with a bullish outlook – contrary to Ethereum. Moreover, there are multiple support levels starting from $0.705 to $0.546 that suggest less risk of a downside move for the remittance token.

The bull flag forecasts a 31% ascent, obtained by measuring the pole’s length and adding it to the breakout point at $0.767. This technique reveals a target at $1. However, moving to this level will not be easy, and Ripple price might take pit stops at $0.855 and $0.917.
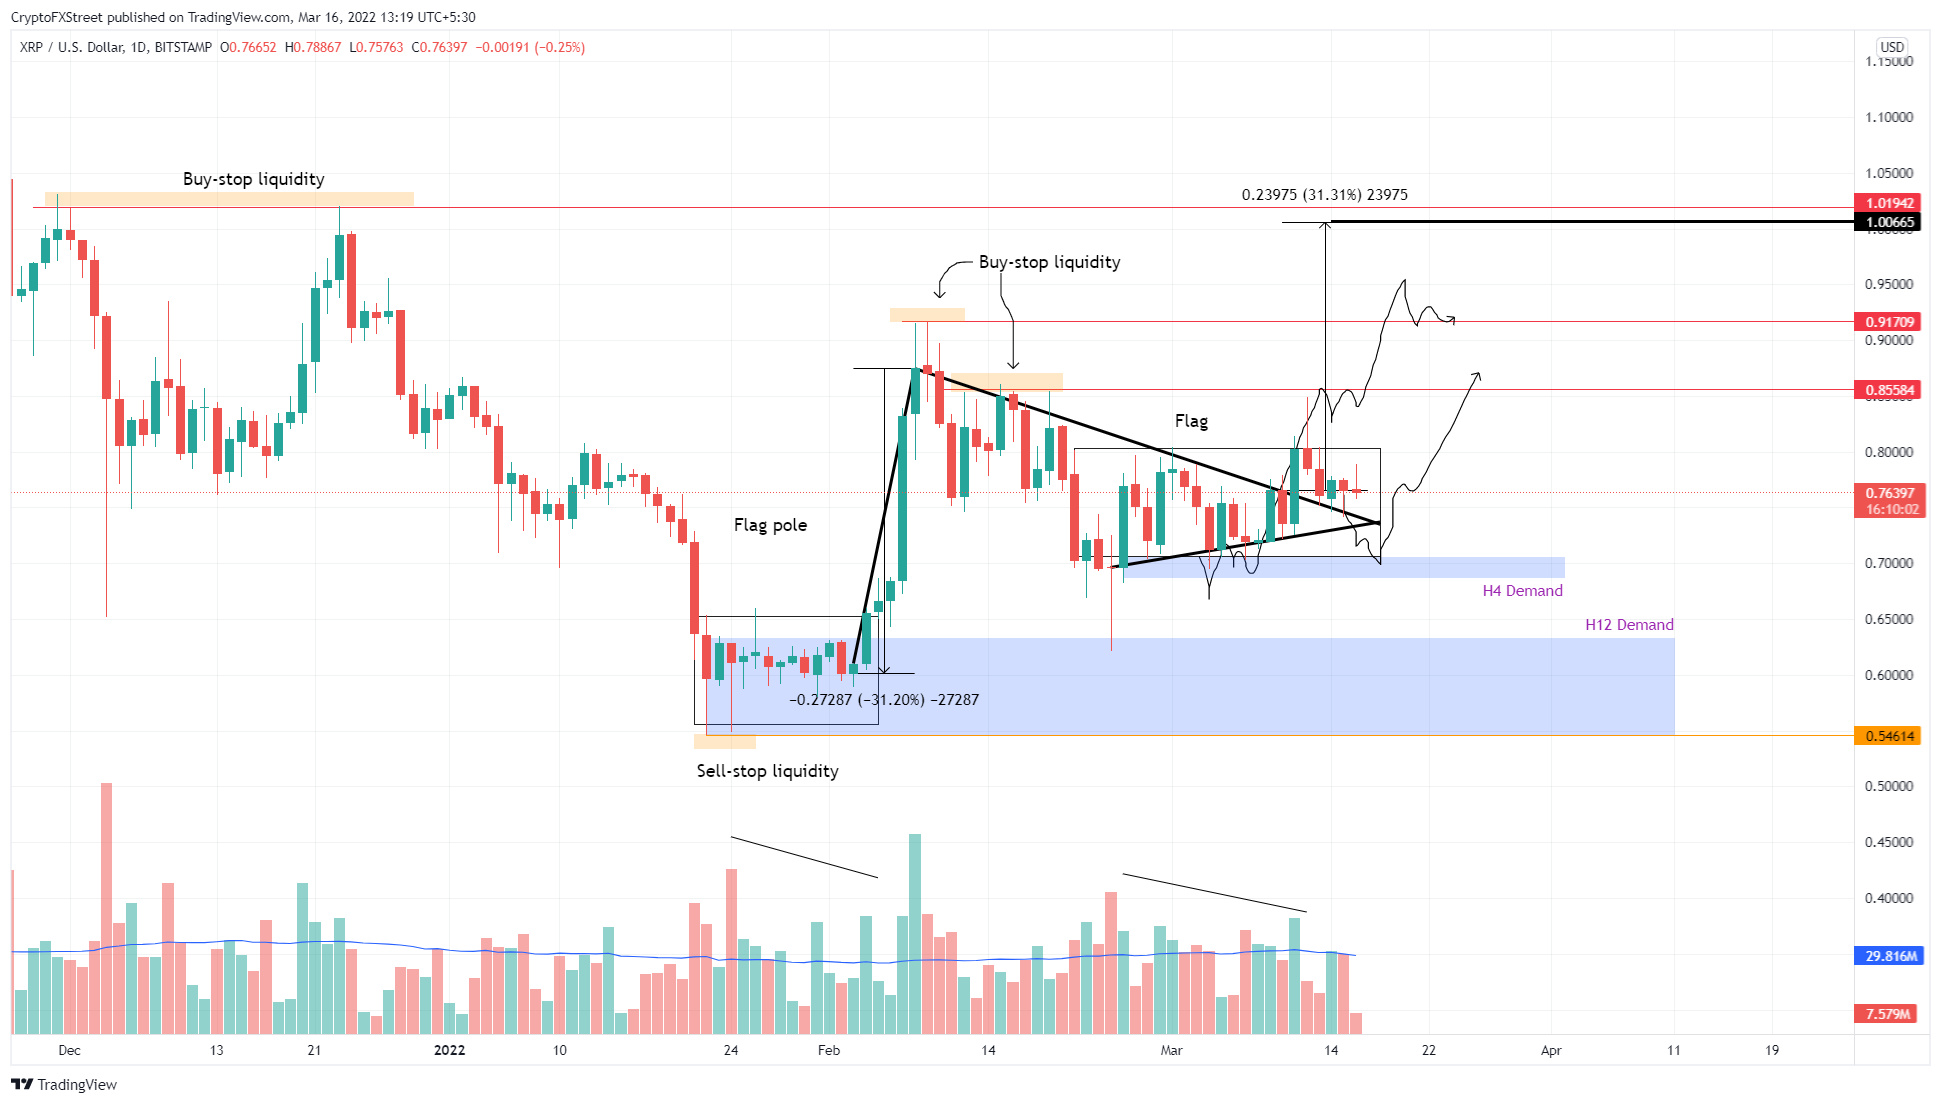
XRP/USD 1-day chart

XRP/USD 1-day chart

Regardless of the bullish outlook for Ripple price, it is highly correlated with Bitcoin. Therefore, a crash in BTC could see XRP price head lower as well. Hence, a daily close below the $0.689 support level will invalidate the demand zone and the bull flag hypothesis, and knock XRP to the next support area, extending from $0.546 to $0.633.

Here, buyers will have another chance at a comeback, but failing to hold above $0.546 will create a lower low and further invalidate the bullish thesis.


Information on these pages contains forward-looking statements that involve risks and uncertainties. Markets and instruments profiled on this page are for informational purposes only and should not in any way come across as a recommendation to buy or sell in these assets. You should do your own thorough research before making any investment decisions. FXStreet does not in any way guarantee that this information is free from mistakes, errors, or material misstatements. It also does not guarantee that this information is of a timely nature. Investing in Open Markets involves a great deal of risk, including the loss of all or a portion of your investment, as well as emotional distress. All risks, losses and costs associated with investing, including total loss of principal, are your responsibility. The views and opinions expressed in this article are those of the authors and do not necessarily reflect the official policy or position of FXStreet nor its advertisers. The author will not be held responsible for information that is found at the end of links posted on this page.

If not otherwise explicitly mentioned in the body of the article, at the time of writing, the author has no position in any stock mentioned in this article and no business relationship with any company mentioned. The author has not received compensation for writing this article, other than from FXStreet.

FXStreet and the author do not provide personalized recommendations. The author makes no representations as to the accuracy, completeness, or suitability of this information. FXStreet and the author will not be liable for any errors, omissions or any losses, injuries or damages arising from this information and its display or use. Errors and omissions excepted.

The author and FXStreet are not registered investment advisors and nothing in this article is intended to be investment advice.

Join Telegram

Recommended content


Recommended Content

Editors’ Picks

Ripple on-chain metrics show bullish signs amidst legal struggle with SEC, XRP eyes recovery

Ripple on-chain metrics show bullish signs amidst legal struggle with SEC, XRP eyes recovery

Ripple made a comeback above $0.48 on Tuesday and hovers above that level in Wednesday’s European session. Ripple on-chain metrics such as transaction volume and Network Realized Profit/Loss have turned bullish, supporting a recovery in the altcoin. 

More Ripple News

Bitcoin price falls amidst German government transfers, miners activity

Bitcoin price falls amidst German government transfers, miners activity

Bitcoin (BTC) extends correction on Wednesday and hovers around $61,000 after finding resistance near the $64,000 level on Monday. Recent on-chain data indicates heightened selling activity from Bitcoin miners early in the week. 

More Bitcoin News

Crypto Today: Bitcoin erases gains from end of June, Ethereum declines while Ripple holds

Crypto Today: Bitcoin erases gains from end of June, Ethereum declines while Ripple holds

Bitcoin wipes out gains from the last week of June and falls below $60,000 on Wednesday. Ethereum and top altcoins ranked by market capitalization erased gains as the inflation outlook worsened. Ripple holds on to recent gains and hovers above $0.48 on Wednesday. 

More Cryptocurrencies News

Three reasons why altcoins could shake off losses this week

Three reasons why altcoins could shake off losses this week

On-chain data from Santiment shows that altcoins are currently in the opportunity zone, or generating buy signals. The top three altcoins in the buy zone are Basic Attention Token (BAT), Chromia (CHR), and Highstreet (HIGH), per Santiment. 

More Altcoins News

Bitcoin: BTC price correction could end in July, according to seasonal data

Bitcoin: BTC price correction could end in July, according to seasonal data

Bitcoin (BTC) price appears poised for a decline this week, influenced by slight outflows in US spot ETFs, selling activity among BTC miners, and a combined transfer of 4,690.28 BTC to centralized exchanges by the US and German governments.

Read full analysis

BTC

ETH

XRP