- Bitcoin price is less than 5% away from reaching its all-time high at $61,788.
- Ethereum bulls show no signs of slowing down even after a 25% run-up in the last week.
- Ripple consolidates near the upper boundary of an ascending parallel channel.
Christine Lagarde, European Central Bank’s president, confirmed that the ECB governing council will reveal in mid-2021 its decision on whether to go forward or not with a digital euro, a Central Bank Digital Currency (CBDC).
Additionally, Lagarde mentioned that the ECB would soon submit the analysis of 8,000 responses from the consultation process regarding CBDC to the European Parliament.
After that, mid-2021, the governing council, on the basis of that consultation and the preliminary work that we are doing, will decide whether we go ahead with experimenting (with Digital Euro).
Lagarde also mentioned that this technical endeavor might take four years.
Bitcoin at make-or-break point
Bitcoin price has surged nearly 16% since it bounced off the 50 Simple Moving Average (SMA) on the daily chart. Now, BTC needs to climb less than 5% to reclaim the all-time high at $61,788 and even set up a new one.
Such a move is likely to trigger FOMO among sidelined investors, adding to the buying pressure and pushing BTC higher.
Adding credence to a positive outlook is the SuperTrend indicator’s buy signal, flashed after the Bitcoin price sliced through $59,200. If buyers continue to pile up, the pioneer cryptocurrency could indeed enter a price discovery phase.
In such a case, a 14% uptick in BTC price toward the 127.2% Fibonacci extension level at $70,780 seems likely. Subsequent areas of interest include $75,450 and $82,200.
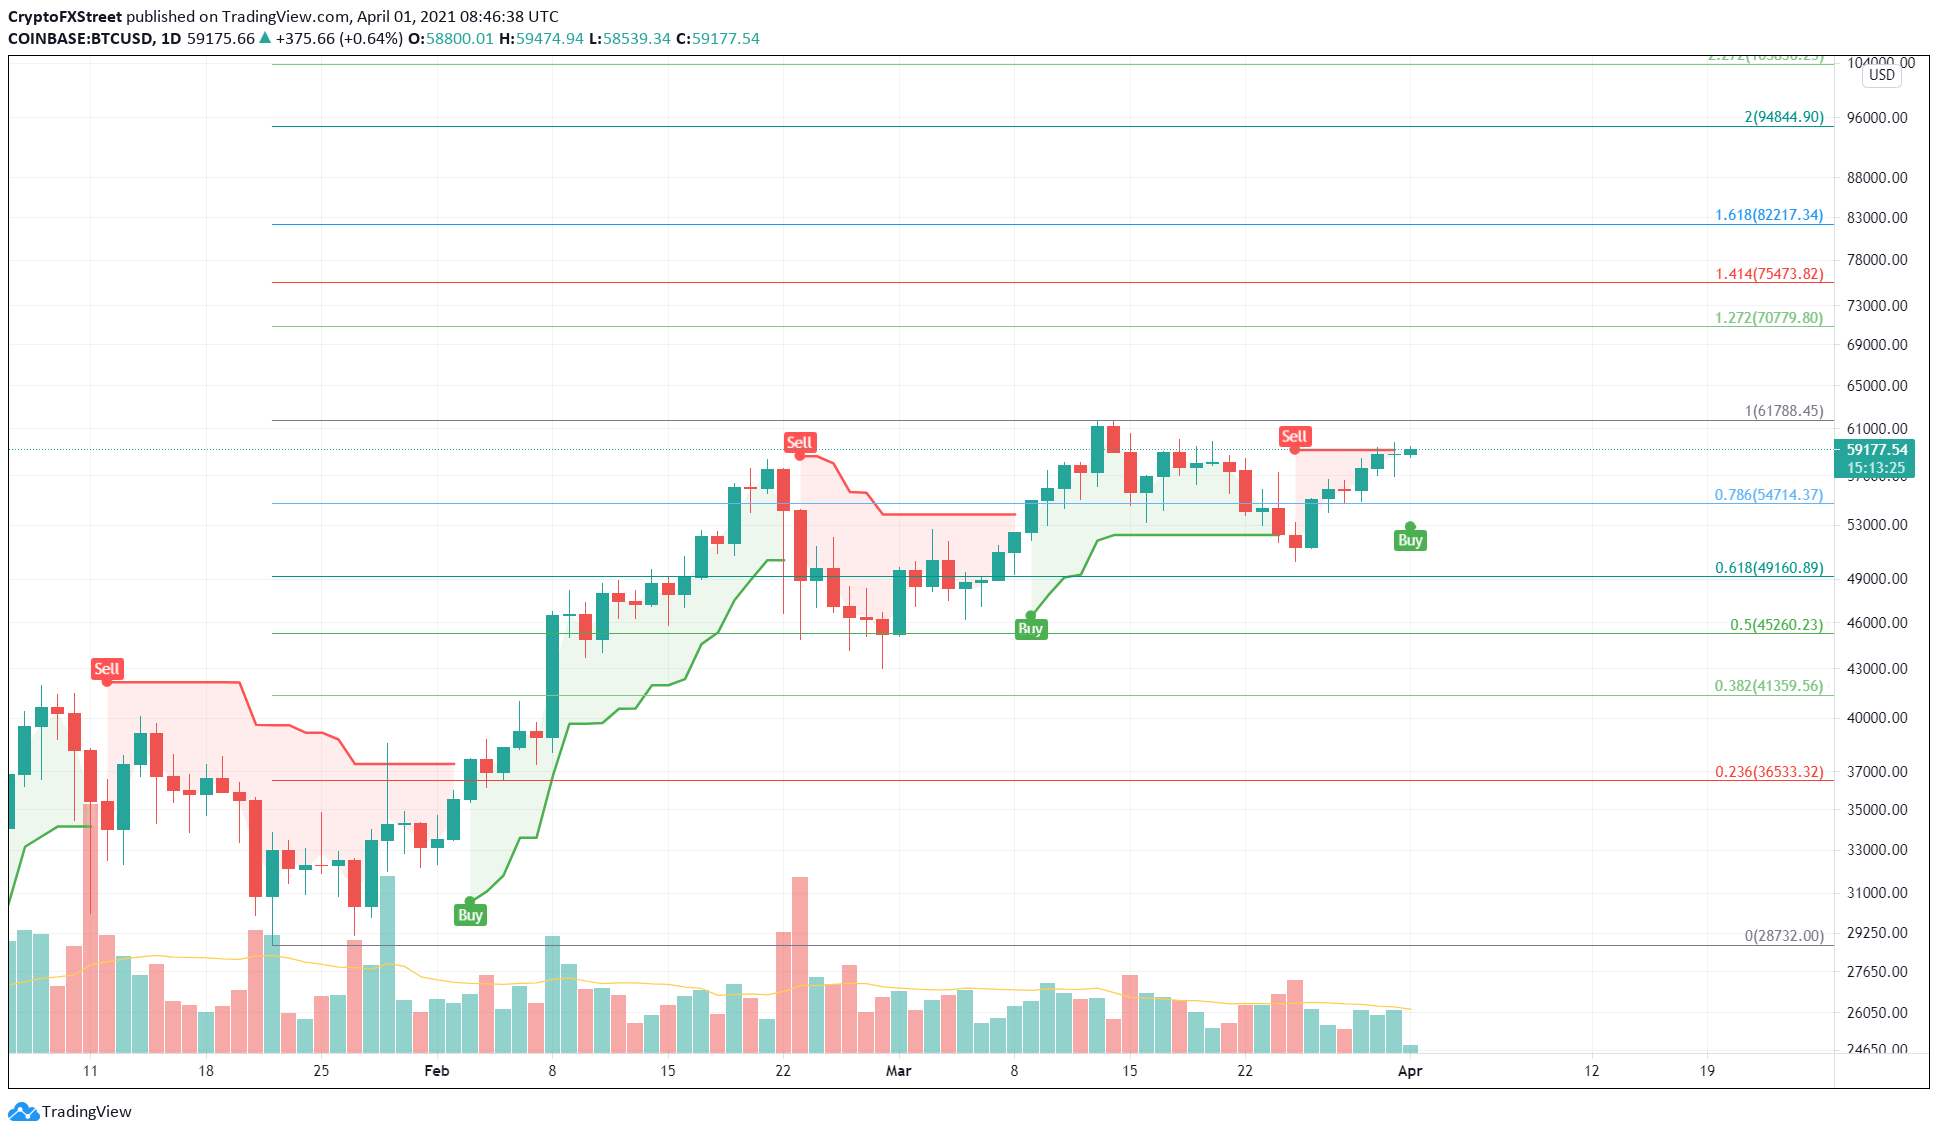
BTC/USD 1-day chart
Regardless of the bullish narrative, if investors decide to book profit near the all-time high, an 8% retracement to $56,700 seems plausible.
The persistence of bearish momentum here could extend the drop to $54,713 or the 78.6% Fibonacci retracement level.
Ethereum investors go on a buying spree
Etheruem price showed a massive burst of buying power around the 38.2% Fibonacci retracement level at $1,578, which resulted in a 25% bounce. This quick run-up has toppled the immediate supply barrier at $1,881, coinciding with the 78.6% Fibonacci retracement level.
Additionally, the SuperTrend indicator has triggered a buy signal after 161 days, which portrays this uptick’s importance for the ETH price.
Therefore, a continuation of this bullish momentum could quickly propel the smart- contracts platform token toward $2,500. Interestingly, this level coincides with the 161.8% Fibonacci extension level.
To do so, Ethereum bulls need to slice through crucial supply barriers that stand at $2,040 and $2,245.
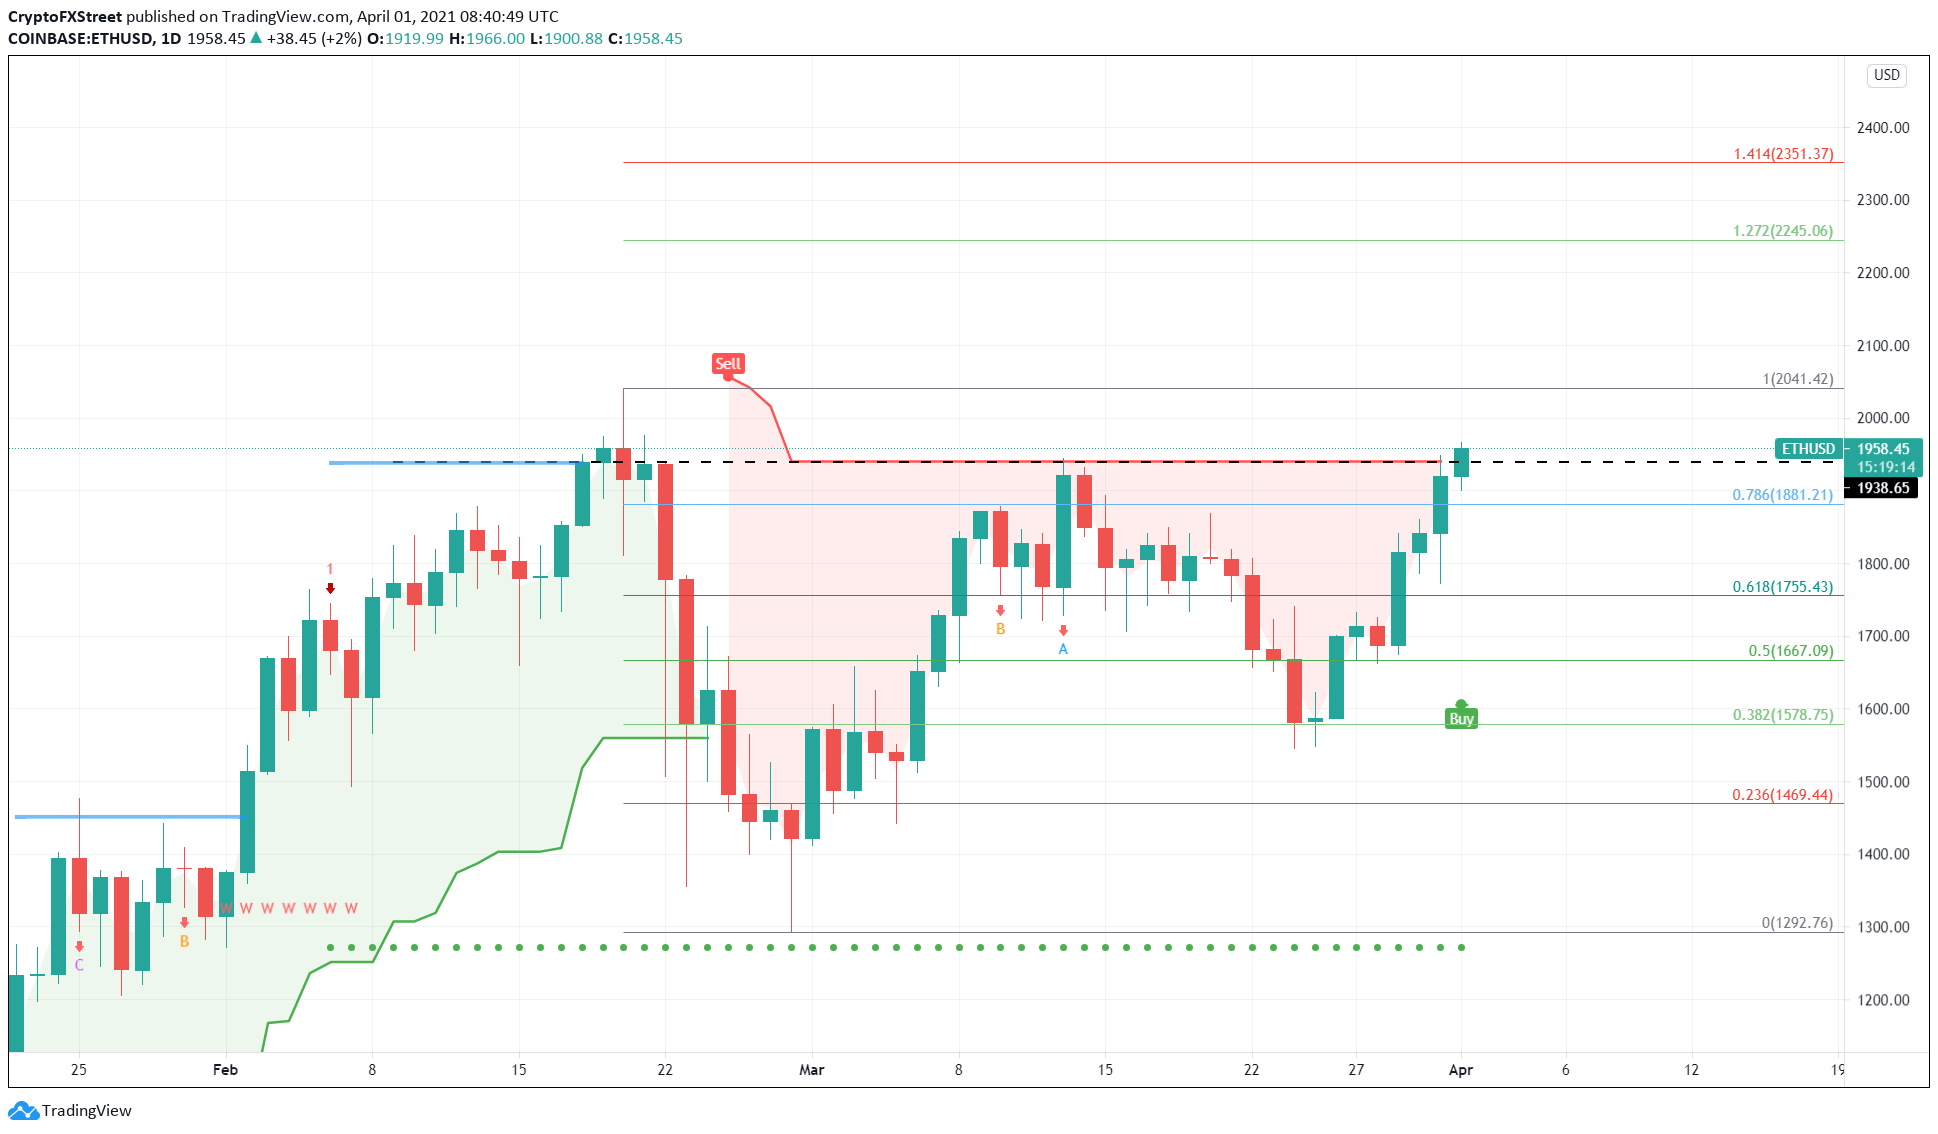
ETH/USD 1-day chart
Investors need to pay attention to Momentum Reversal Indicator’s breakout line at $1,940. A failure to produce a candlestick close above this level could signal buyers’ exhaustion. Here, if investors begin to reallocate their holdings or start booking profits, a downtrend seems likely.
In that case, Ethereum price could first slide 5% to retest the $1,881 demand barrier. If this level is overwhelmed by the sellers, ETH could crash 10% to the 61.8% Fibonacci retracement level at $1,755.
Ripple evaluates pullback as it approaches local top
Ripple price faces exhaustion of the bullish momentum as it approaches the upper trend line of an ascending parallel channel. This development in the XRP price is noteworthy, especially since it has sliced through the 61.8% Fibonacci retracement level at $0.55.
Hence, it is of utmost importance that Ripple buyers manage to keep XRP above this barrier.
However, a breakdown of this level could trigger an 11% crash toward the 50% Fibonacci retracement level at $0.49, a stable demand barrier. If the sellers continue to run amok at this price zone, Ripple could be in for a steep correction.
A breakdown of the lower trend line at $0.49 will signal the start of a downtrend. In such a scenario, the remittances token could slide a total of 21% toward the MRI’s State Trend Support at $0.39.
To do so, sellers need to breach through a crucial demand barrier that stands at $0.43.
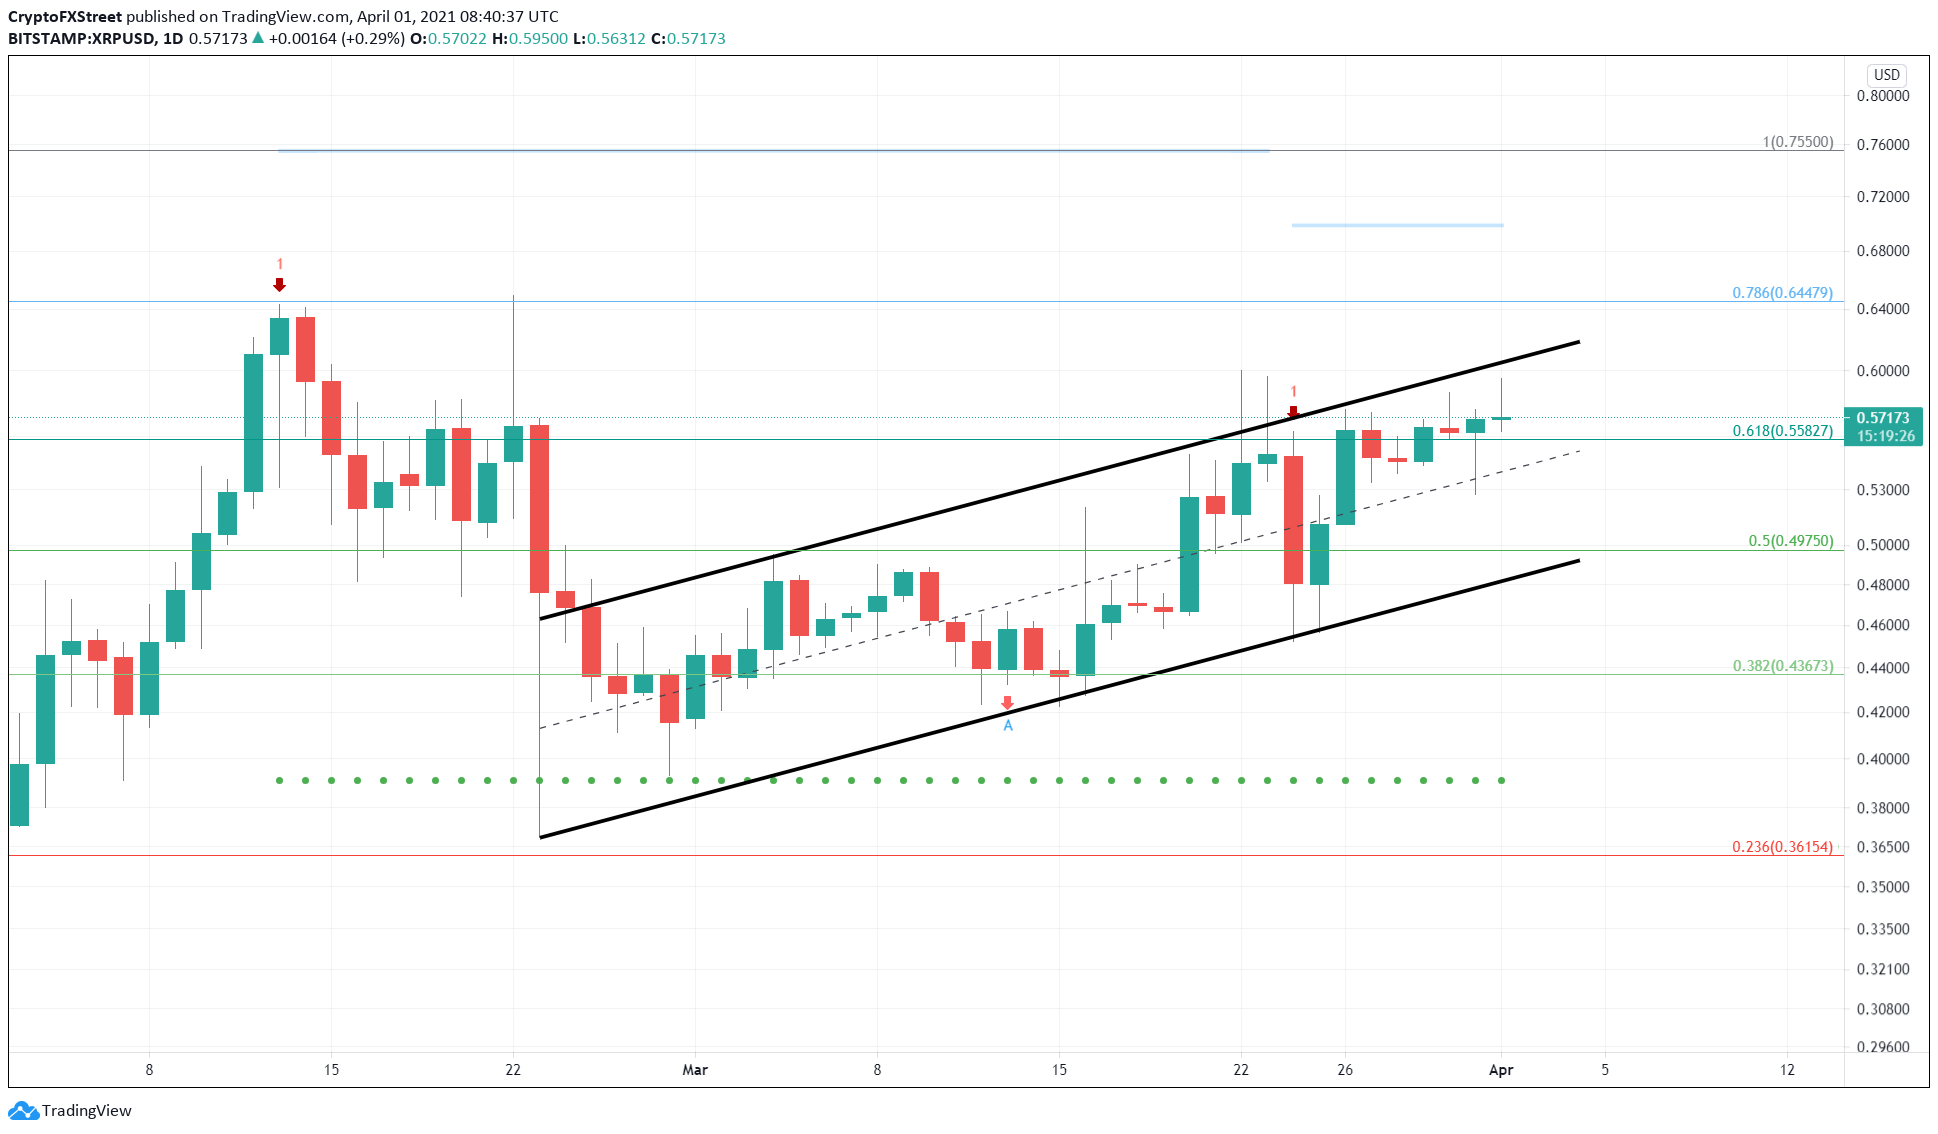
XRP/USD 1-day chart
On the flip side, if buyers manage to keep the XRP price above the 61.8% Fibonacci retracement level at $0.55, things could stay neutral or even turn bullish.
The bearish outlook might face extinction if Ripple pushes beyond the upper trend line at $0.61 in convincing fashion. If this were to happen, the XRP price could ascend 12% to $0.70, which coincides with the MRI’s breakout line.
Information on these pages contains forward-looking statements that involve risks and uncertainties. Markets and instruments profiled on this page are for informational purposes only and should not in any way come across as a recommendation to buy or sell in these assets. You should do your own thorough research before making any investment decisions. FXStreet does not in any way guarantee that this information is free from mistakes, errors, or material misstatements. It also does not guarantee that this information is of a timely nature. Investing in Open Markets involves a great deal of risk, including the loss of all or a portion of your investment, as well as emotional distress. All risks, losses and costs associated with investing, including total loss of principal, are your responsibility. The views and opinions expressed in this article are those of the authors and do not necessarily reflect the official policy or position of FXStreet nor its advertisers. The author will not be held responsible for information that is found at the end of links posted on this page.
If not otherwise explicitly mentioned in the body of the article, at the time of writing, the author has no position in any stock mentioned in this article and no business relationship with any company mentioned. The author has not received compensation for writing this article, other than from FXStreet.
FXStreet and the author do not provide personalized recommendations. The author makes no representations as to the accuracy, completeness, or suitability of this information. FXStreet and the author will not be liable for any errors, omissions or any losses, injuries or damages arising from this information and its display or use. Errors and omissions excepted.
The author and FXStreet are not registered investment advisors and nothing in this article is intended to be investment advice.
Recommended Content
Editors’ Picks

Bitcoin Weekly Forecast: BTC nosedives below $95,000 as spot ETFs record highest daily outflow since launch
Bitcoin price continues to edge down, trading below $95,000 on Friday after declining more than 9% this week. Bitcoin US spot ETFs recorded the highest single-day outflow on Thursday since their launch in January.

Bitcoin crashes to $96,000, altcoins bleed: Top trades for sidelined buyers
Bitcoin (BTC) slipped under the $100,000 milestone and touched the $96,000 level briefly on Friday, a sharp decline that has also hit hard prices of other altcoins and particularly meme coins.

Solana Price Forecast: SOL’s technical outlook and on-chain metrics hint at a double-digit correction
Solana (SOL) price trades in red below $194 on Friday after declining more than 13% this week. The recent downturn has led to $38 million in total liquidations, with over $33 million coming from long positions.

SEC approves Hashdex and Franklin Templeton's combined Bitcoin and Ethereum crypto index ETFs
The SEC approved Hashdex's proposal for a crypto index ETF. The ETF currently features Bitcoin and Ethereum, with possible additions in the future. The agency also approved Franklin Templeton's amendment to its Cboe BZX for a crypto index ETF.

Bitcoin: 2025 outlook brightens on expectations of US pro-crypto policy
Bitcoin (BTC) price has surged more than 140% in 2024, reaching the $100K milestone in early December. The rally was driven by the launch of Bitcoin Spot Exchange Traded Funds (ETFs) in January and the reduced supply following the fourth halving event in April.

Best Forex Brokers with Low Spreads
VERIFIED Low spreads are crucial for reducing trading costs. Explore top Forex brokers offering competitive spreads and high leverage. Compare options for EUR/USD, GBP/USD, USD/JPY, and Gold.