Top 3 Price Prediction Bitcoin, Ethereum, Ripple: Crypto market shrinks while Bitcoin grows
- Ethereum takes the brunt of the falls and gives market share to Bitcoin.
- Pause in the falls before looking for key supports at lower prices.
- Ripple plays dangerously and risks looking for support at the $0.20 level.

The time for price action came yesterday, and after several days of playing tricks, the market showed its true intentions.
The board was dyed red, concentrated mainly in the Altcoin segment and Ethereum as the maximum representative of the sub-segment.
The war for market share, expressed through the dominance charts, confirmed the offensive launched by Bitcoin days ago and sent Ethereum to the critical support level at 12.32, the same level where Ethereum's decline found ground the last six times.
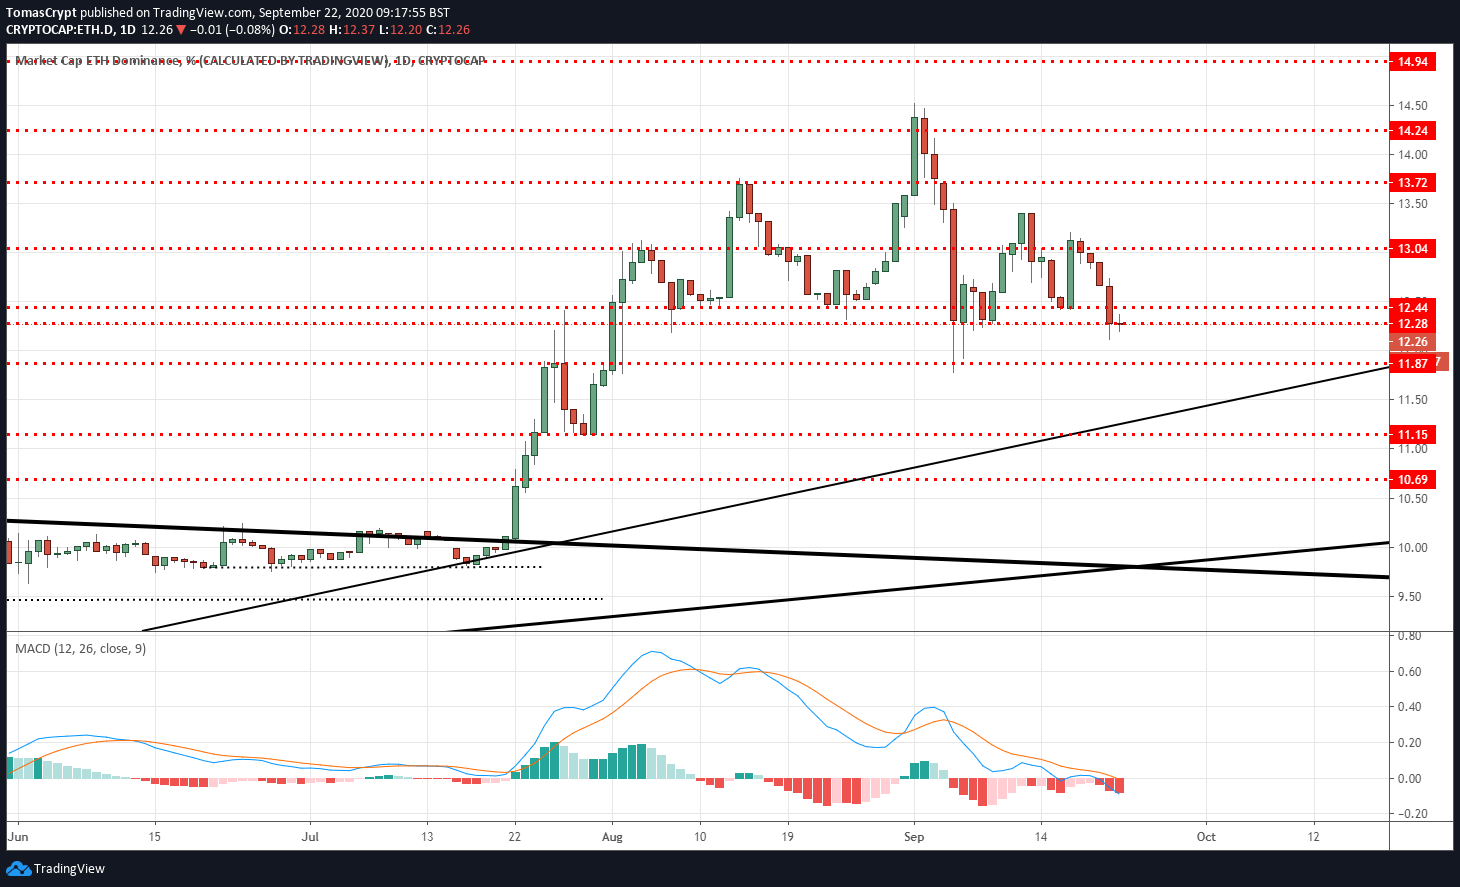
The analysis of the chart gives a high probability that the decline in the market share level for Ether will continue. If this scenario is confirmed, the main target is on the upward trend line that governs the movement in the 11.50 area.
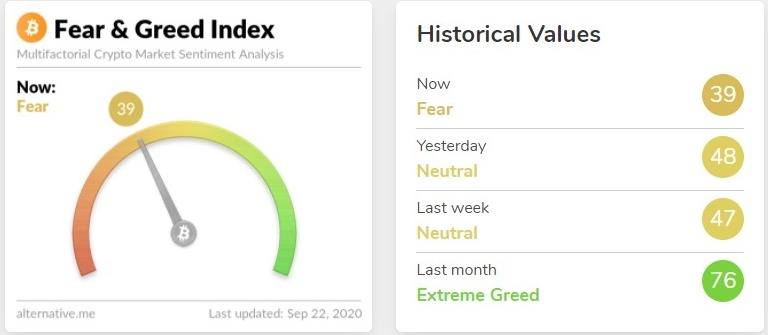
The sentiment level is impacted by the fall and is at 39 today, a drop of over 20% from yesterday's levels.
ETH/BTC Daily Chart
The ETH/BTC pair is currently trading at the price level of 0.03277, the lower end of the range that ETH/USD has been moving in since late July.
Above the current price, the first resistance level is at 0.0348, then the second at 0.0373 and the third one at 0.040.
Below the current price, the first support level is at 0.0325, then the second at 0.0318 and the third one at 0.0307.
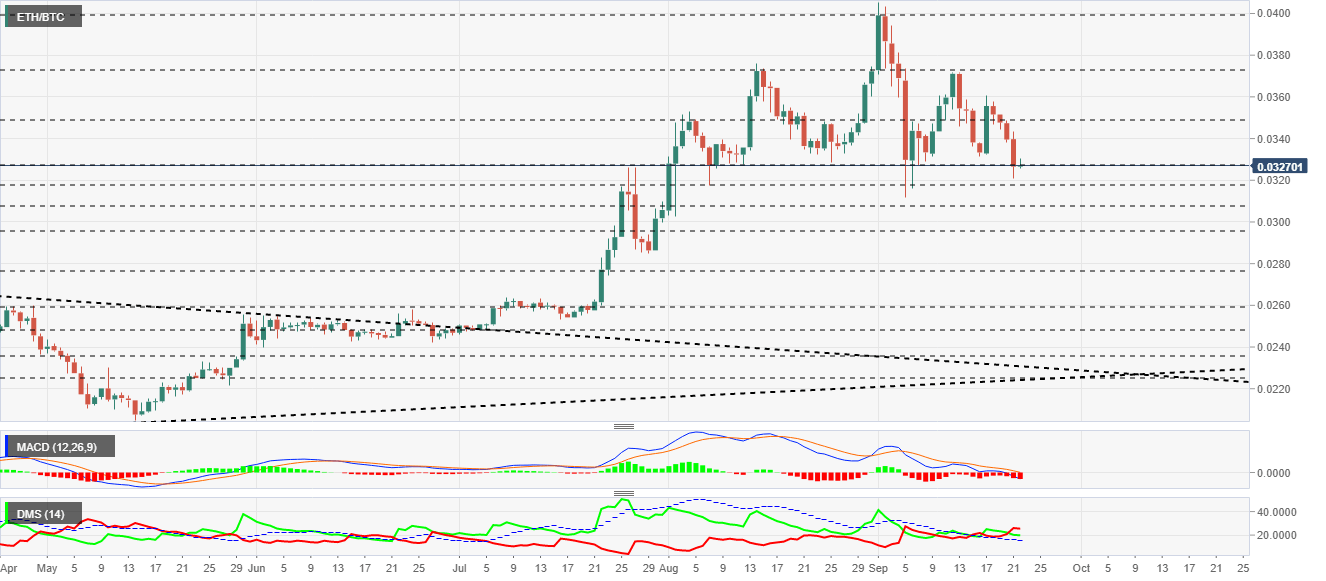
The MACD on the daily chart confirms the bearish cross and enters the negative zone of the indicator. The downward trend strengths as the slope and the separation between the lines are maintained.
The DMI on the daily chart shows bears taking the lead over bulls. Despite the dominance of the sell side, buyers are still above the ADX line, indicating that volatility may be high, without ruling out an attack by the bulls in the short term.
BTC/USD Daily Chart
The BTC/USD pair is currently trading at $10432 and retains the high level of recent months.
Above the current price, the first resistance level is at $11120, then the second at $11350 and the third one at $11850.
Below the current price, the first support level is at $10400, then the second at $10000 and the third one at $9700.
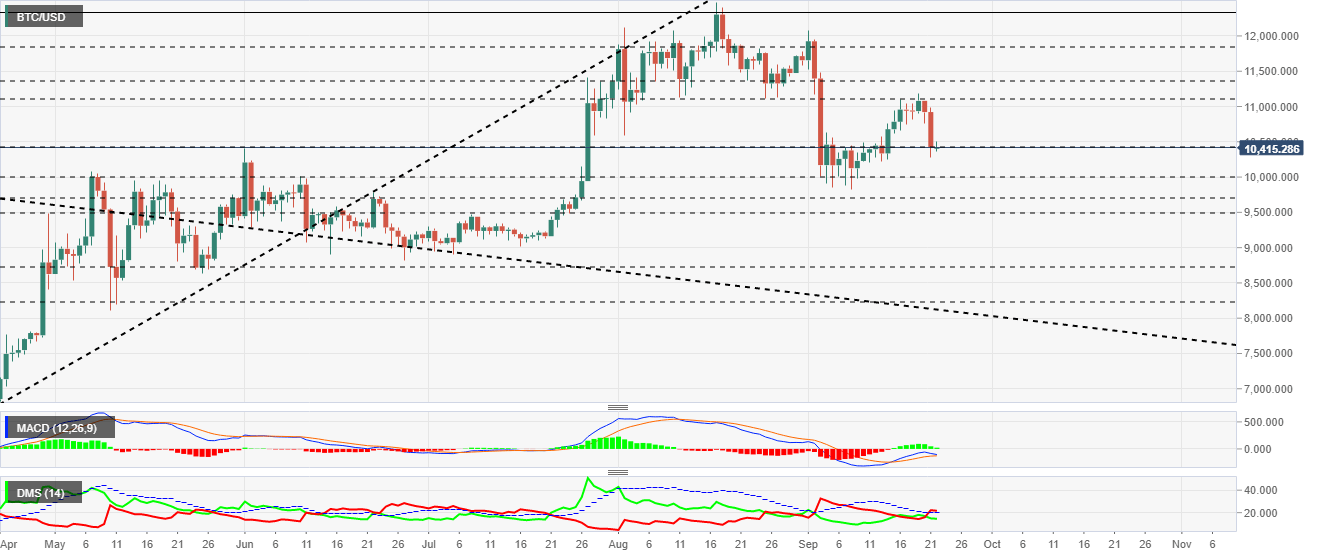
The MACD on the daily chart shows a key profile with the moving averages about to cross over. The current structure leaves open the possibility of a bullish bounce, which would be limited by the presence of the indicator's zero level.
The DMI on the daily chart shows bears taking control of the pair, both by distance from the bulls and by position above the ADX line.
ETH/USD Daily Chart
The ETH/USD pair is currently trading at the $344.6 price level and is moving right along the vital support which if pierced downwards would open the door to further declines, targeting the $250 level.
Above the current price, the first resistance level is at $360, then the second at $385 and the third one at $400.
Below the current price, the first support level is at $340, then the second at $315 and the third one at $290.
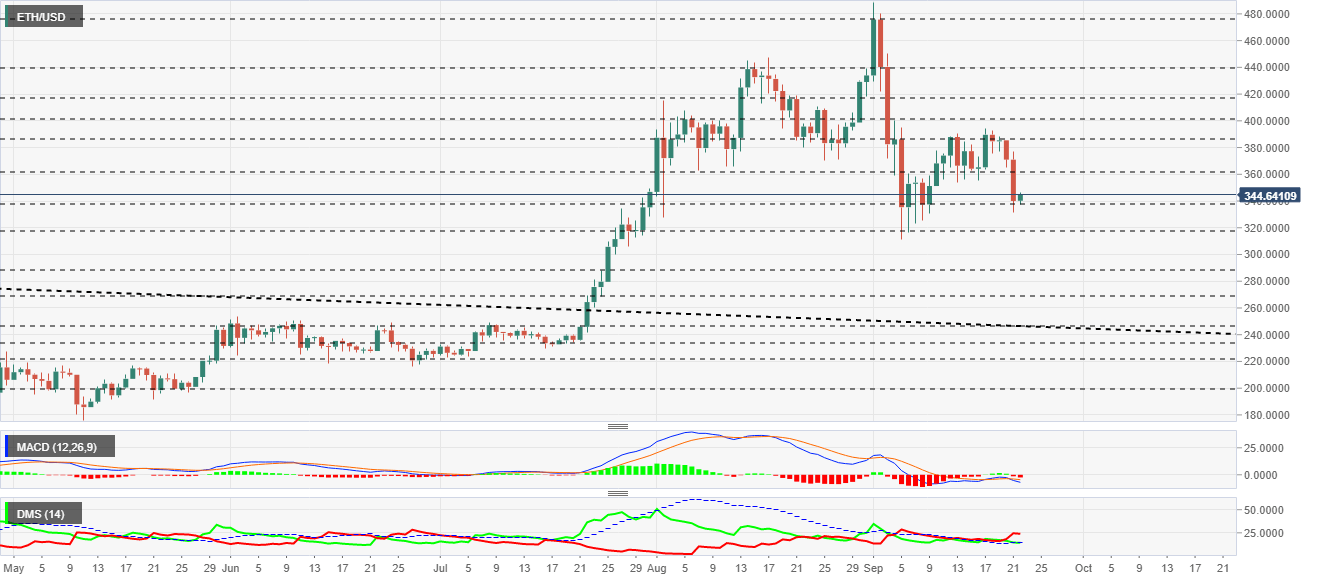
The MACD on the daily chart shows a dangerous downward slope that, if not reverse,d in the next few hours could indicate an upcoming downward movement of the price.
The DMI on the daily chart shows the bears taking advantage of the bulls. The separation between the two sides of the market and the position of the sell-side above the ADX line indicates a significant downward movement ahead.
XRP/USD Daily Chart
The XRP/USD pair is currently trading at a price level of $0.2304 and plays dangerously close to the trend line that has been driving XRP/USD since the lows of the beginning of the year.
Above the current price, the first resistance level is at $0.235, then the second at $0.262 and the third one at $0.285.
Below the current price, the first support level is at $0.23, then the second at $0.215 and the third one at $0.205.
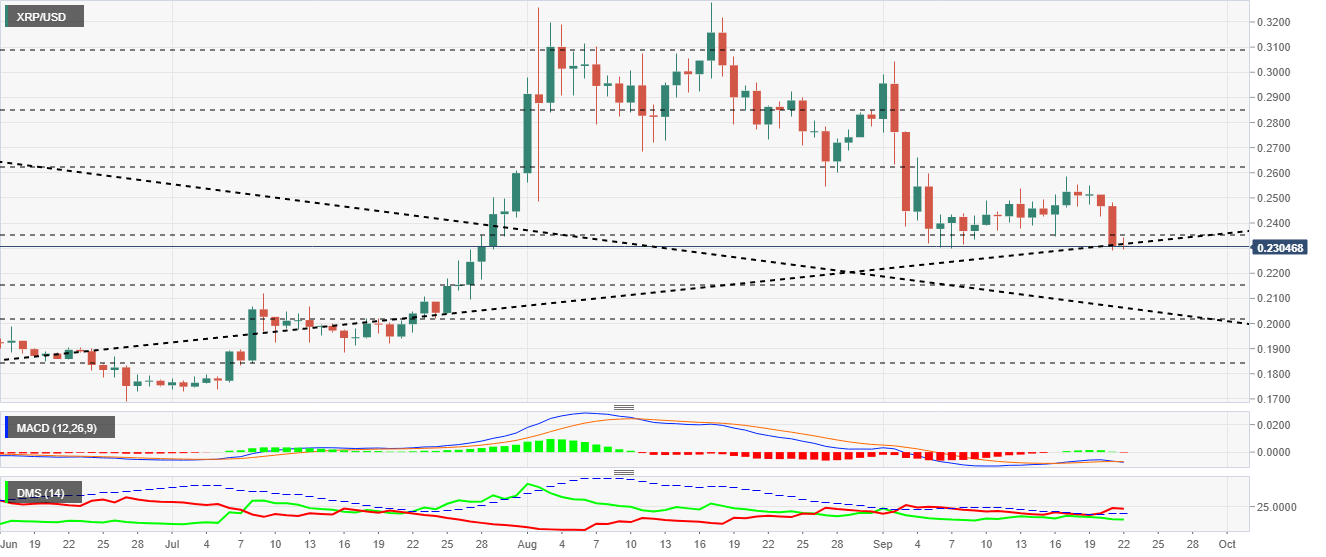
The MACD on the daily chart shows a subtle bearish cross that could shift quickly.
The DMI on the daily chart shows bears taking control of the XRP/USD pair, taking a good lead over bulls. By moving above the ADX line, sellers have activated a pattern that develops with more significant declines in the short term.
Author

Tomas Salles
FXStreet
Tomàs Sallés was born in Barcelona in 1972, he is a certified technical analyst after having completing specialized courses in Spain and Switzerland.


