- The current levels of resistance split opposite scenarios in the medium term.
- Ether reasserts himself as a leader, XRP as a lagger.
- Bitcoin is still the king and can play its trump card at any time.
The cryptocurrency market continues with its already typical endless pauses. This pattern is emphasizing even more that bipolarity of behaviour between the halt and the action.
The high volatility with which the crypto segment moves at certain times collapses before crucial technical levels.
Now is one of those moments that will determine the development of the market in the coming weeks, with bulls and bears facing each other for the control of Bitcoin price.
The Bitcoin and Ether dominance charts are also at critical points that can be in favour of one or the other.
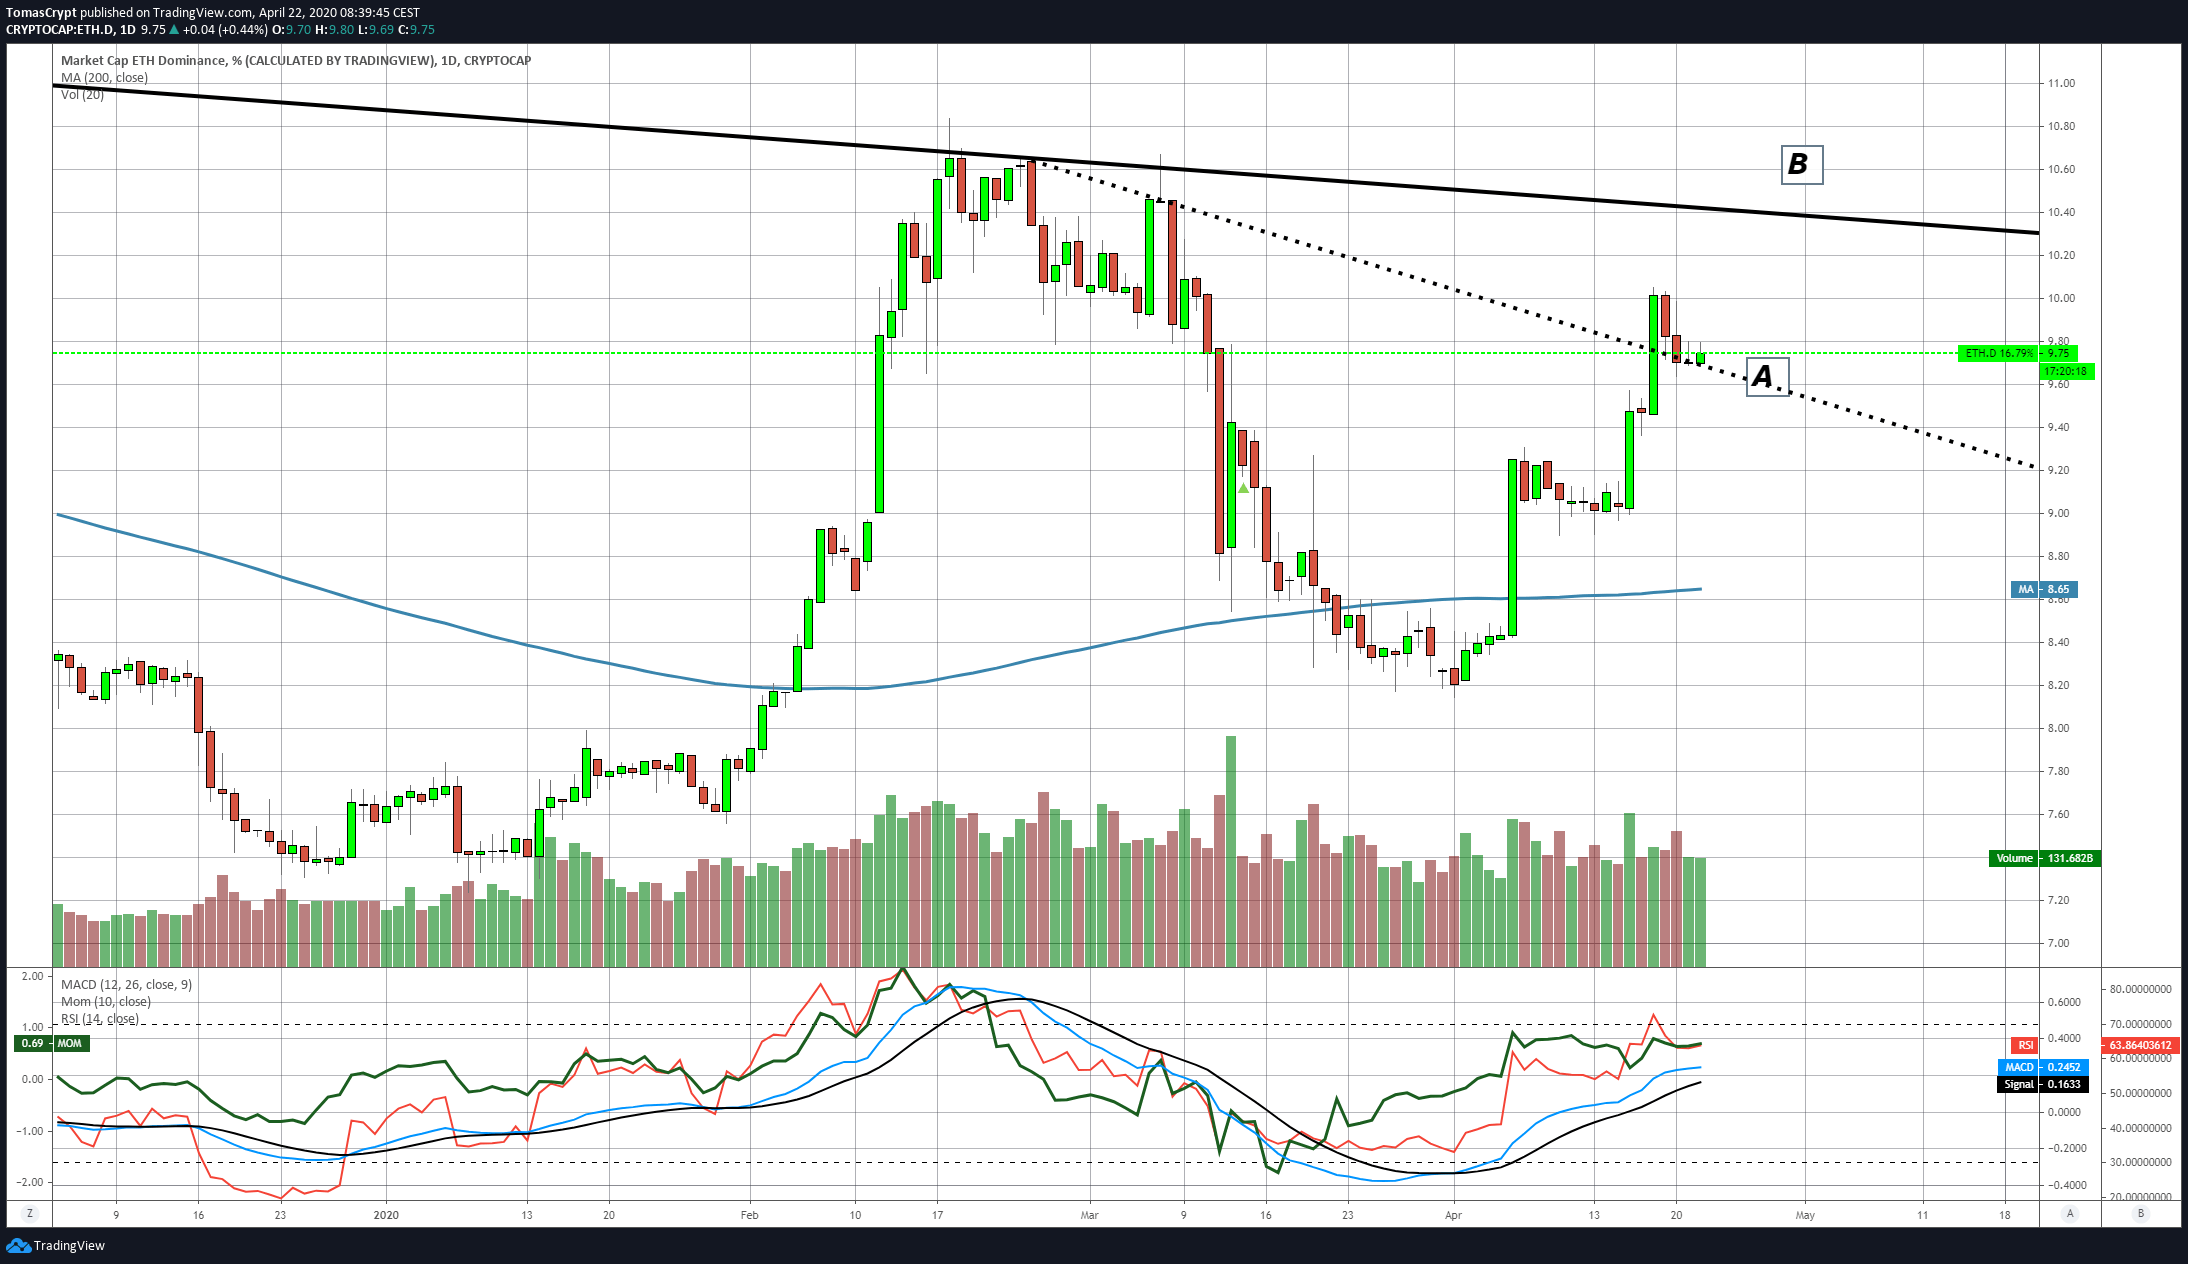 Looking at the Ether's dominance chart, we see that it continues to reinforce the support level given by the accelerating trend line (A) in the face of the lack of strength to attempt the assault on the long-term downward trend line (B).
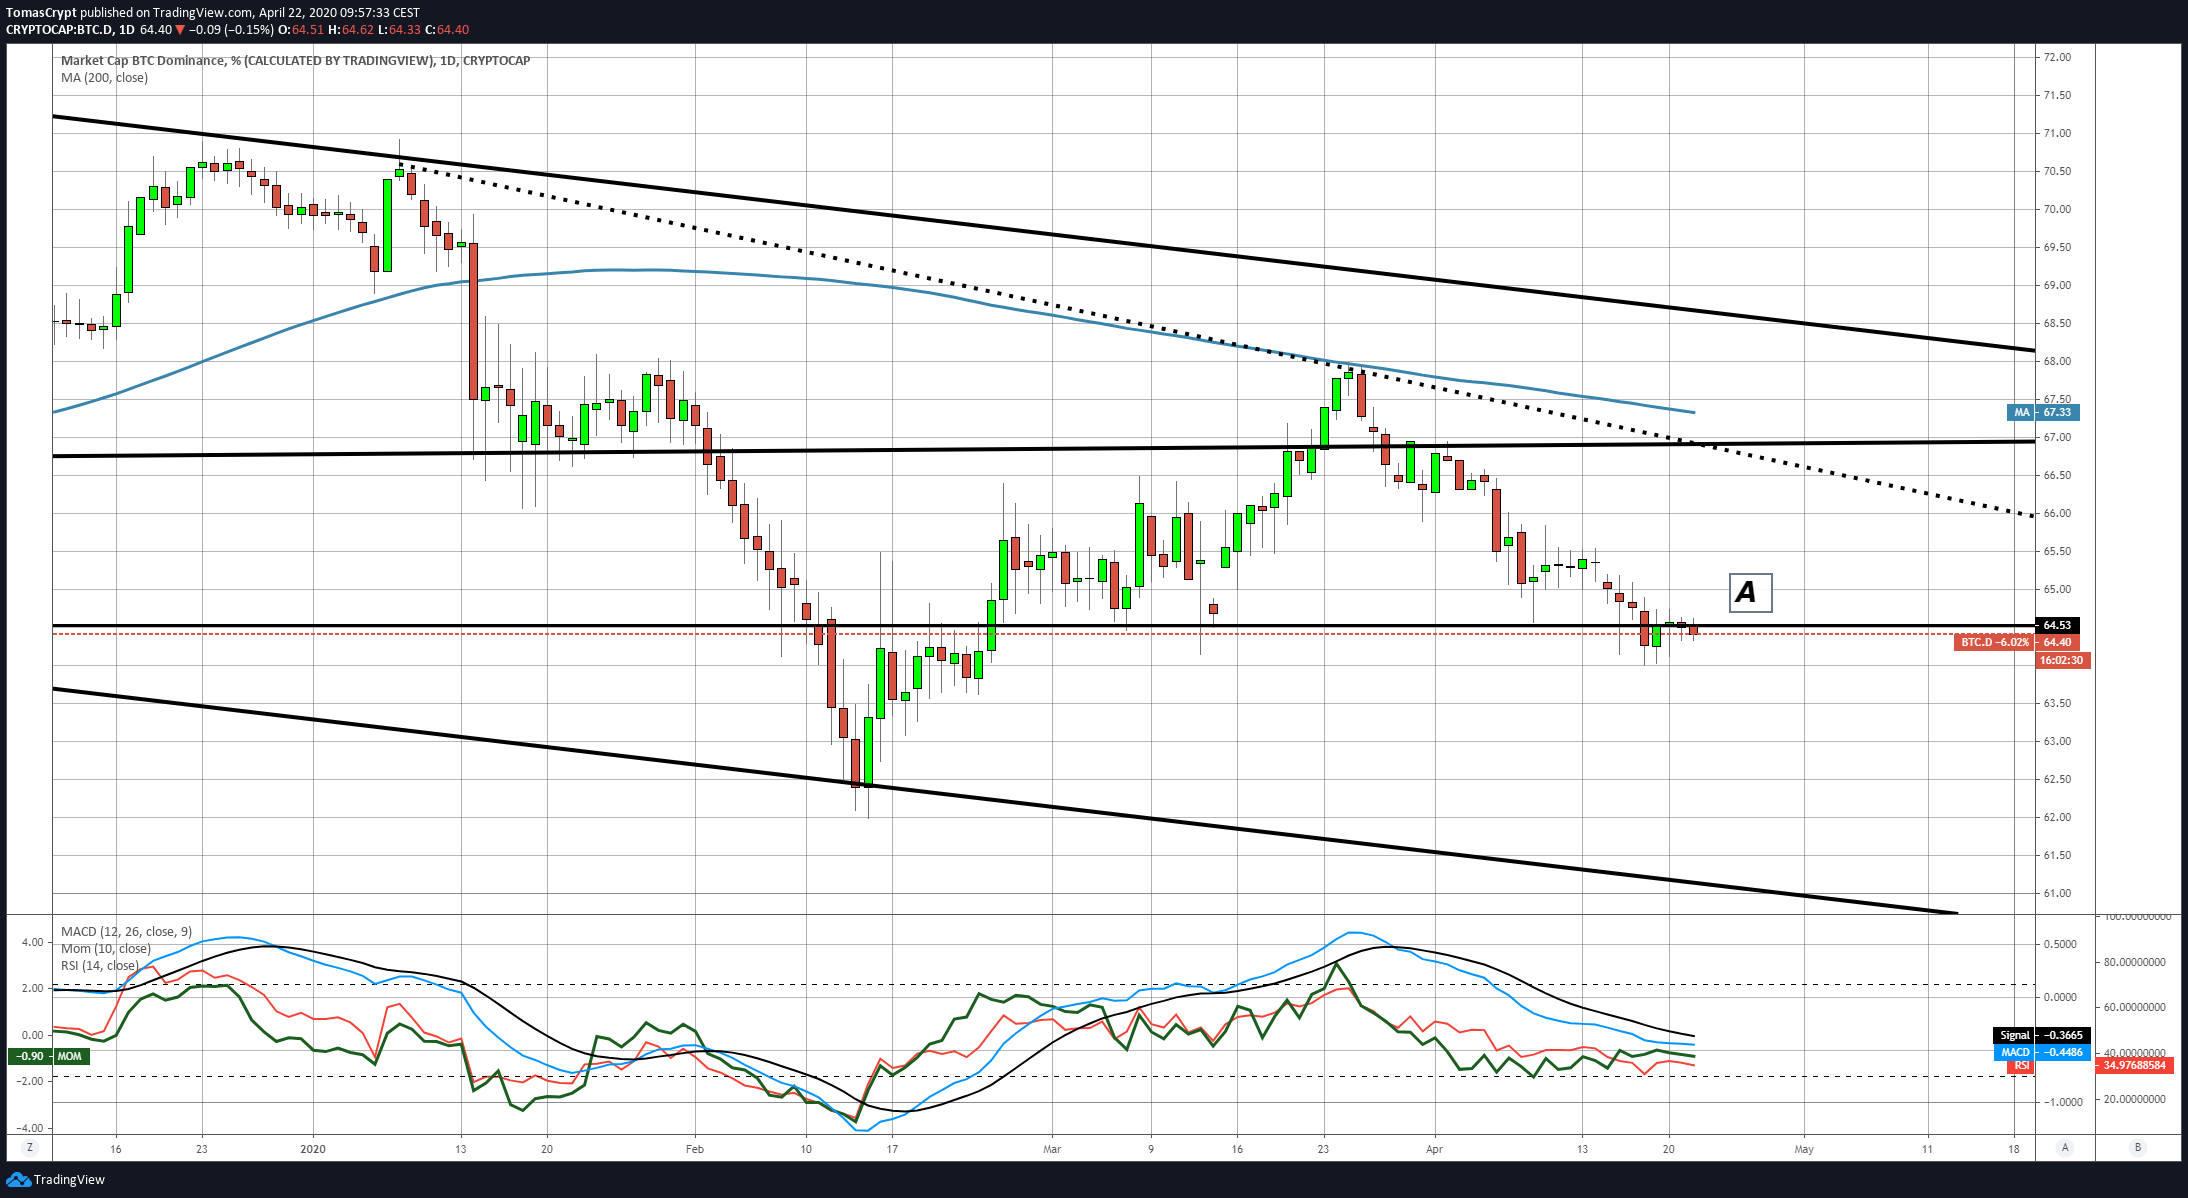
The Bitcoin dominance chart shows that the current level at 64.5 (A), was already significant in the past. Specifically in the Spring and Fall of 2017 and also in the Summer of 2019. As early as 2020, this same support level had implications for the end of the crypto market's upward trend and its subsequent decline.
 Both charts are excellent tools for building future technical scenarios, as is the ETH/BTC pair.
ETH/BTC Daily Chart
The ETH/BTC pair is currently trading at the price level of 0.0251 and is having trouble breaking through the price congestion resistance level at 0.0255. The main moving averages continue to increase the bullish profile and offer important but distant support at the 0.023 level.
Above the current price, the first resistance level is at 0.0255, then the second at 0.0268 and the third one at 0.0275.
Below the current price, the first support level is at 0.023, then the second at 0.0222 and the third one at 0.0214.
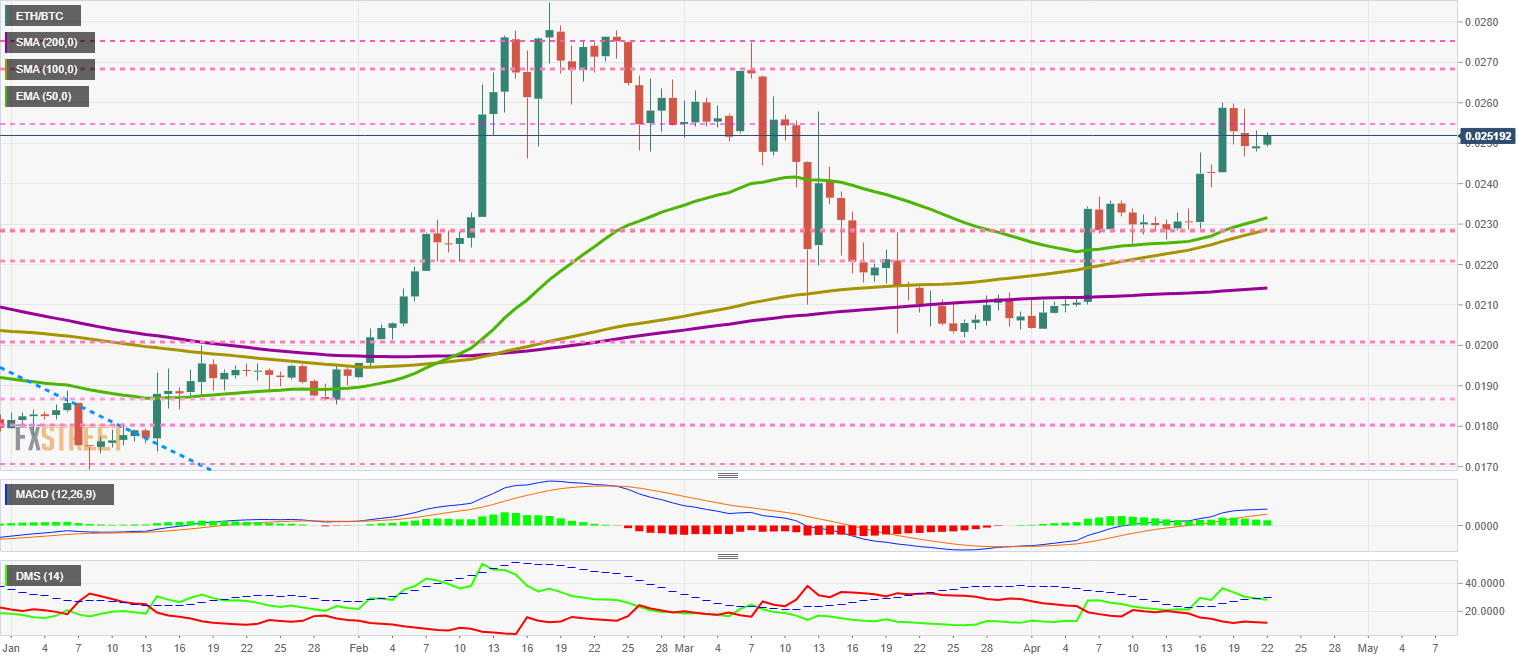
The MACD on the daily chart loses its bullish profile and moves sideways while the exponential average and the signal line get closer. This setup is not a good structure for an upside attempt.
The DMI on the daily chart shows bulls losing support from the ADX line, which could disable the bullish momentum of the ETH/BTC pair if the daily close confirms this downward break.
BTC/USD Daily Chart
The BTC/USD pair is currently trading at the price level of $6968 and remains in the optimal zone to attack the long-term bearish channel ceiling at the price level of $7090. The resistance level worsened by the presence of the EMA50 at the same price level. As if that wasn't enough resistance to the Bitcoin advance, there are multiple price congestion resistance, trend lines, and significant moving averages up to and beyond $8000.
Above the current price, the first resistance level is at $7100, then the second at $7400 and the third one at $7800.
Below the current price, the first support level is at $6700, then the second at $6600 and the third one at $6400.
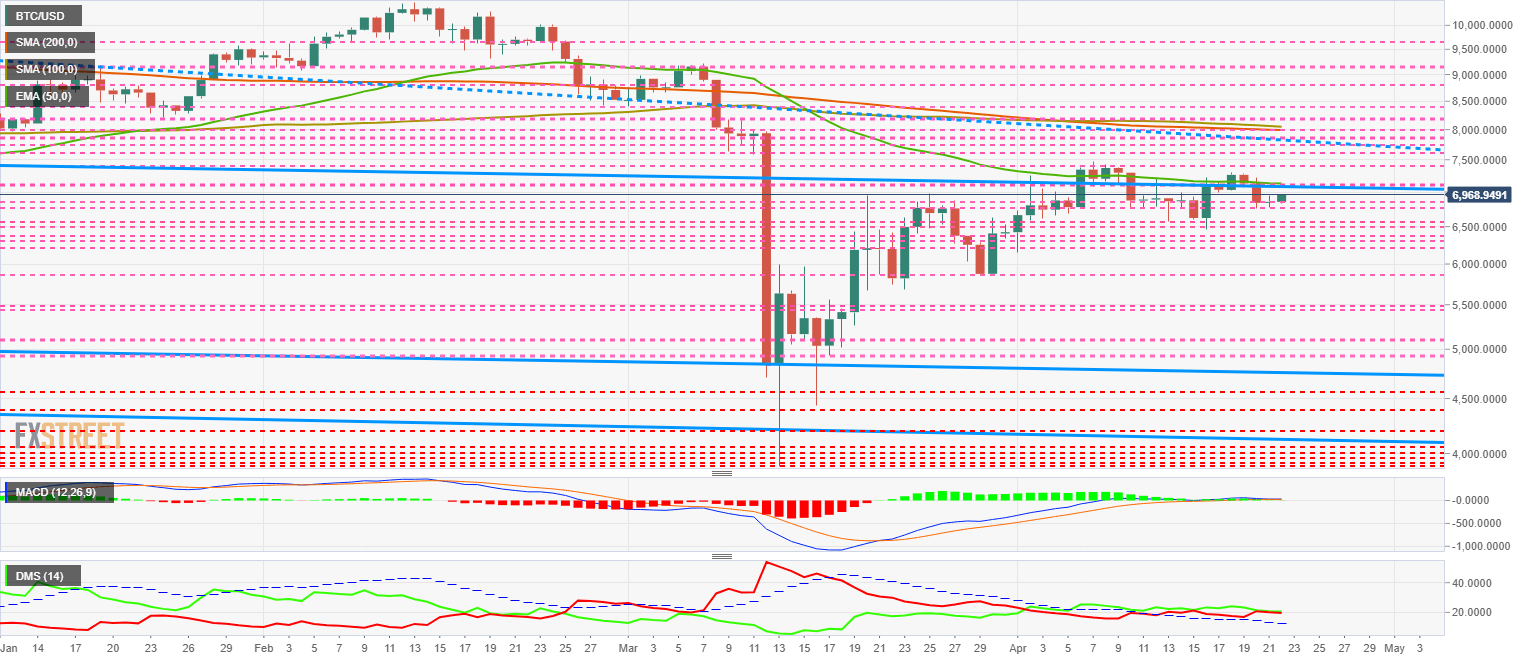
The MACD on the daily chart shows a further day's indicator that lacks direction and strength. Only the presence of support level 0 provides some confidence at the current time.
The DMI on the daily chart clearly expresses the situation I mentioned at the beginning of this article. Both sides of the market have been at similar levels for more than three days, and neither bears nor bulls can take control of the BTC/USD pair.
ETH/USD Daily Chart
The ETH/USD pair is currently trading at the $176 price level and is moving above the SMA200 today. The main moving averages are also increasing the bullish profile and accompanying the Ether price upwards. The critical level to break out of the bullish trend is at $190.
Above the current price, the first resistance level is at $185.7, then the second at $190 and the third one at $195.
Below the current price, the first support level is at $170, then the second at $165 and the third one at $162.
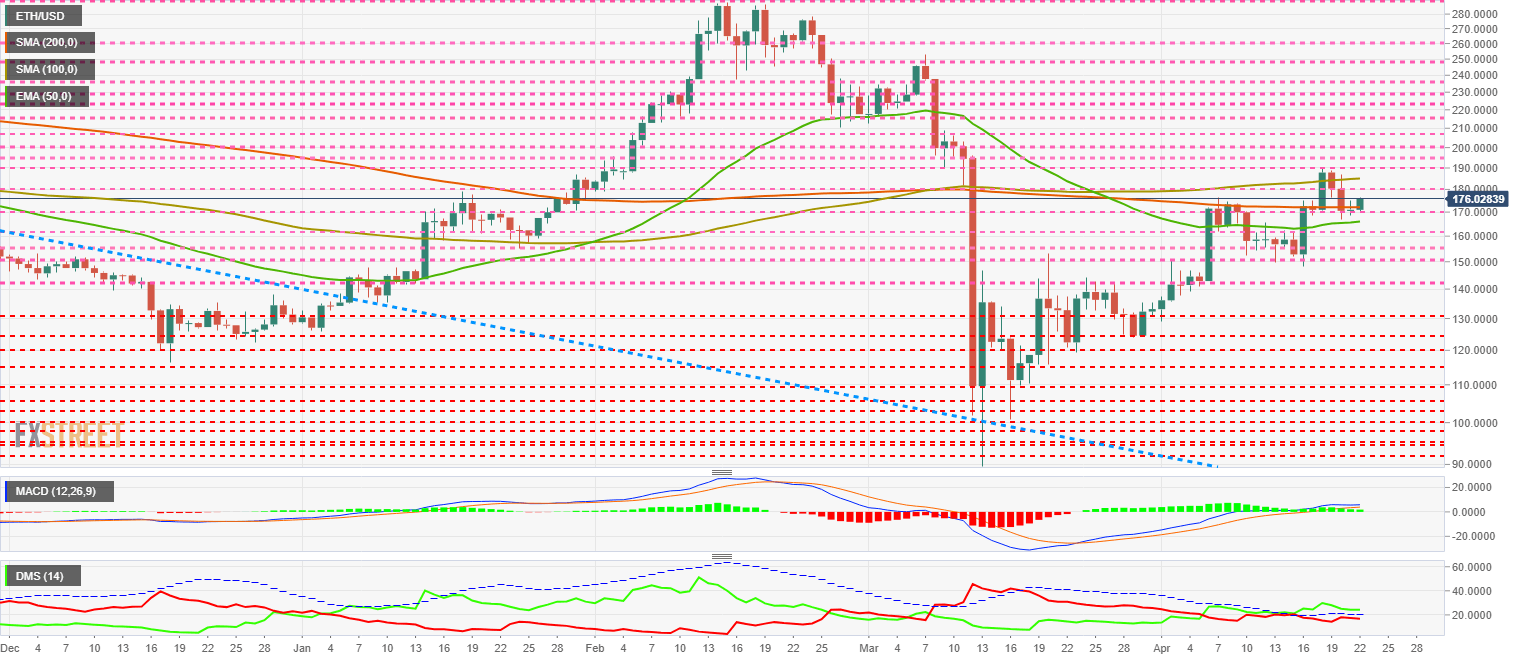 The MACD on the daily chart shows a small improvement from yesterday's levels, both in terms of upward slope and line spacing.
The DMI on the daily chart shows the bulls are weakly controlling ETH/USD, while the bears are retreating today after yesterday's breakout attempt.
XRP/USD Daily Chart
The XRP/USD pair is currently trading at a price level of $0.186 and is pointing to the current positive tone in the crypto market. The main moving averages continue to slide down, complicating the upward development for the Ripple Ltd. token.
Above the current price, the first resistance level is at $0.19, then the second at $0.20 and the third one at $0.22.
Below the current price, the first support level is at $0.181, then the second at $0.171 and the third one at $0.163.
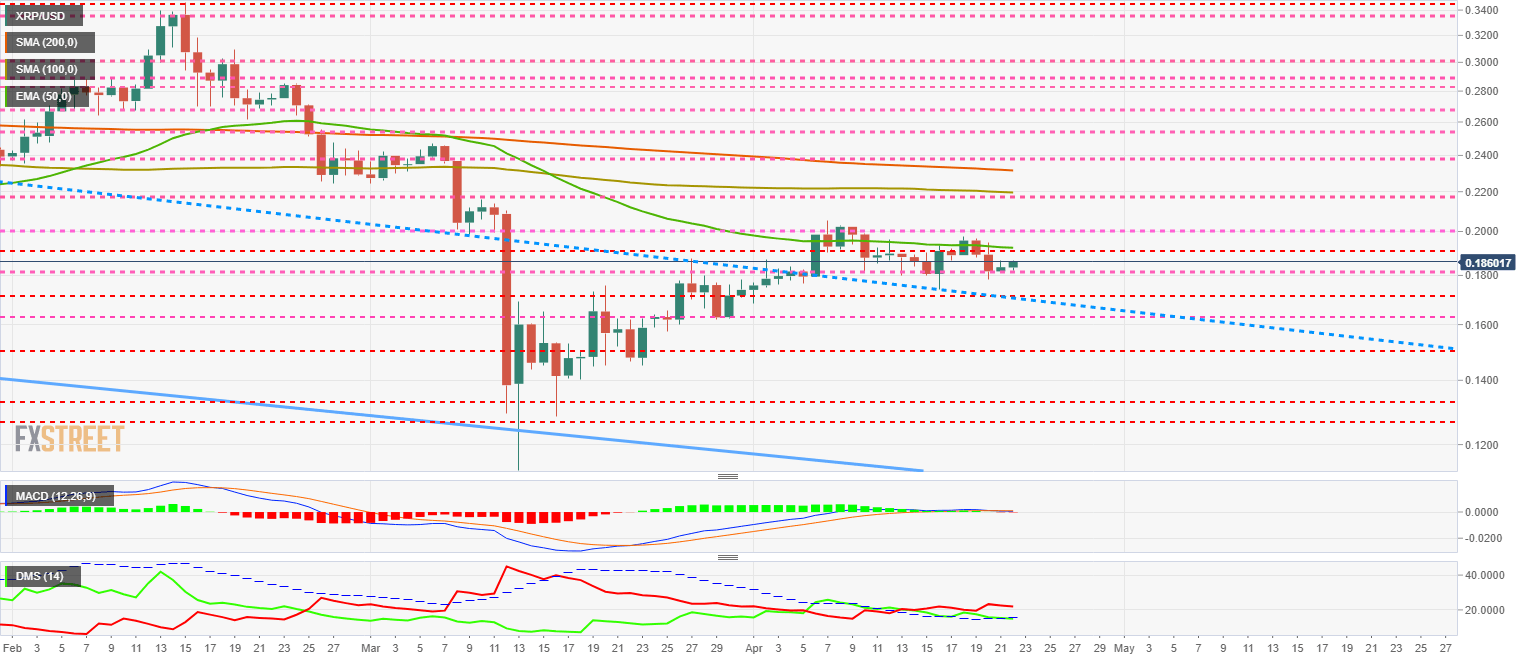
The MACD on the daily chart shows an entirely flat profile with no line spacing. This structure informs the lack of direction and strength in the XRP/USD pair.
The DMI on the daily chart shows the bears reinforcing their control, although more because of the lack of opposition from the bulls.
Information on these pages contains forward-looking statements that involve risks and uncertainties. Markets and instruments profiled on this page are for informational purposes only and should not in any way come across as a recommendation to buy or sell in these assets. You should do your own thorough research before making any investment decisions. FXStreet does not in any way guarantee that this information is free from mistakes, errors, or material misstatements. It also does not guarantee that this information is of a timely nature. Investing in Open Markets involves a great deal of risk, including the loss of all or a portion of your investment, as well as emotional distress. All risks, losses and costs associated with investing, including total loss of principal, are your responsibility. The views and opinions expressed in this article are those of the authors and do not necessarily reflect the official policy or position of FXStreet nor its advertisers. The author will not be held responsible for information that is found at the end of links posted on this page.
If not otherwise explicitly mentioned in the body of the article, at the time of writing, the author has no position in any stock mentioned in this article and no business relationship with any company mentioned. The author has not received compensation for writing this article, other than from FXStreet.
FXStreet and the author do not provide personalized recommendations. The author makes no representations as to the accuracy, completeness, or suitability of this information. FXStreet and the author will not be liable for any errors, omissions or any losses, injuries or damages arising from this information and its display or use. Errors and omissions excepted.
The author and FXStreet are not registered investment advisors and nothing in this article is intended to be investment advice.
Recommended Content
Editors’ Picks

Bitcoin holds $84,000 despite Fed’s hawkish remarks and spot ETFs outflows
Bitcoin is stabilizing around $84,000 at the time of writing on Thursday after facing multiple rejections around the 200-day EMA at $85,000 since Saturday. Despite risk-off sentiment due to the hawkish remarks by the US Fed on Wednesday, BTC remains relatively stable.

Crypto market cap fell more than 18% in Q1, wiping out $633.5 billion after Trump’s inauguration top
CoinGecko’s Q1 Crypto Industry Report highlights that the total crypto market capitalization fell by 18.6% in the first quarter, wiping out $633.5 billion after topping on January 18, just a couple of days ahead of US President Donald Trump’s inauguration.

Top meme coin gainers FARTCOIN, AIDOGE, and MEW as Trump coins litmus test US SEC ethics
Cryptocurrencies have been moving in lockstep since Monday, largely reflecting sentiment across global markets as United States (US) President Donald Trump's tariffs and trade wars take on new shapes and forms each passing day.

XRP buoyant above $2 as court grants Ripple breathing space in SEC lawsuit
A US appellate court temporarily paused the SEC-Ripple case for 60 days, holding the appeal in abeyance. The SEC is expected to file a status report by June 15, signaling a potential end to the four-year legal battle.
Bitcoin Weekly Forecast: Market uncertainty lingers, Trump’s 90-day tariff pause sparks modest recovery
Bitcoin (BTC) price extends recovery to around $82,500 on Friday after dumping to a new year-to-date low of $74,508 to start the week. Market uncertainty remains high, leading to a massive shakeout, with total liquidations hitting $2.18 billion across crypto markets.

The Best brokers to trade EUR/USD
SPONSORED Discover the top brokers for trading EUR/USD in 2025. Our list features brokers with competitive spreads, fast execution, and powerful platforms. Whether you're a beginner or an expert, find the right partner to navigate the dynamic Forex market.