Top 3 Price Prediction Bitcoin, Ethereum, Ripple: Crypto market on hold before looking down again
- Top 3 coins still set to move lower as they build support areas looking to the future.
- Ripple could surprise on the upside and make up for lost ground in the recent upward movement.
- Ethereum now has to digest its outstanding performance during the year.

The process of consolidation continues in the crypto market. Bitcoin and Ethereum needed to pause and build price congestion zones that would allow them to move towards never-before-seen levels in the future without the danger of the party ending badly due to a lack of baseline levels.
The Ripple is unaware of this process as, despite doubling the price from its lows, it has not moved out of range and does not need to move back to build a price congestion zone from which to project upwards.
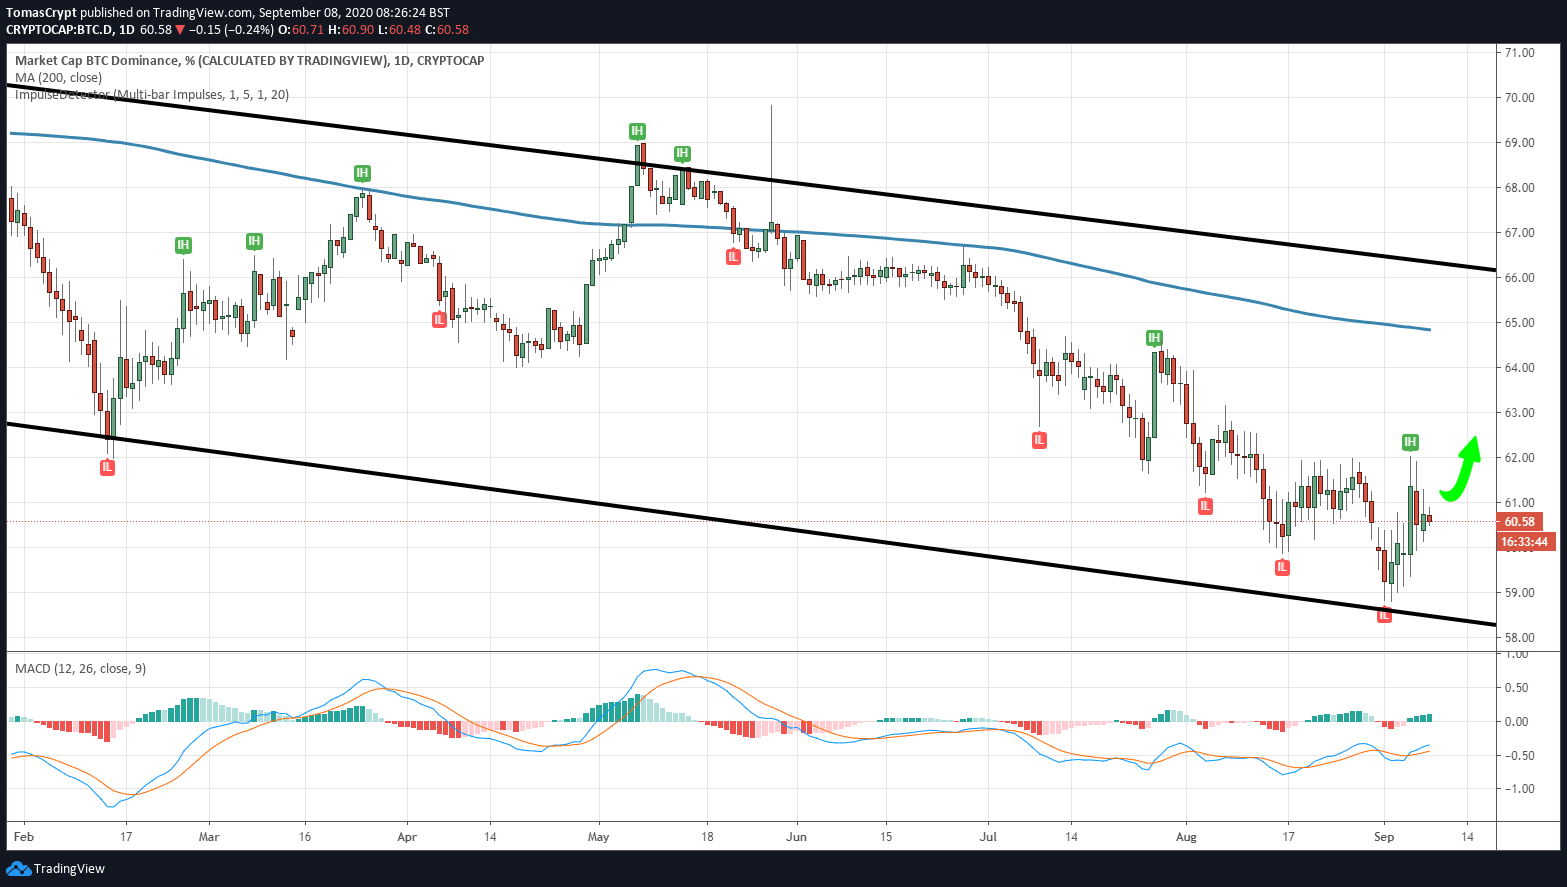
Bitcoin is close to taking control of the market and regaining market share. Once it has reached the bottom of the bearish channel that has governed the movement since July 2019, it is time to move upwards, with a primary objective in the SMA200 being to move slightly below 65% market share.
Market sentiment also needed new impetus after moving from overly optimistic levels for weeks. The sell-off led to a rapid correction in the sentiment level, and now it is fear, the predominant feeling that has widespread. The current 41 level is not in line with the upward trend underlying the crypto market, a positive factor in the medium term.
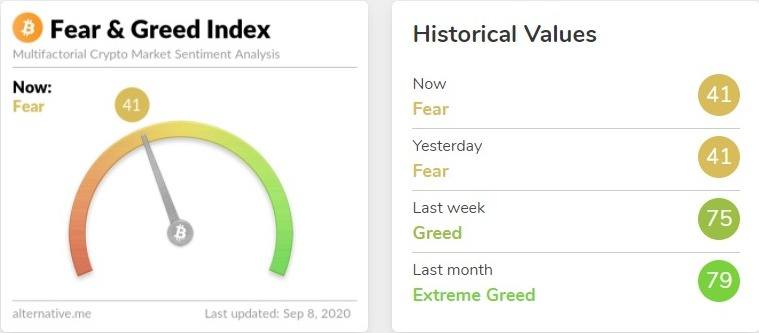
Source: alternative.me
ETH/BTC Daily Chart
The ETH/BTC pair is currently trading at the price level of 0.03391 while consolidating the first downtrend above the support level at 0.0337. The 200-day simple moving average is at 0.026, giving ample room to move lower for ETH/BTC.
Above the current price, the first resistance level is at 0.0347, then the second at 0.036 and the third one at 0.0315.
Below the current price, the first support level is at 0.0337, then the second at 0.0327 and the third one at 0.0217.
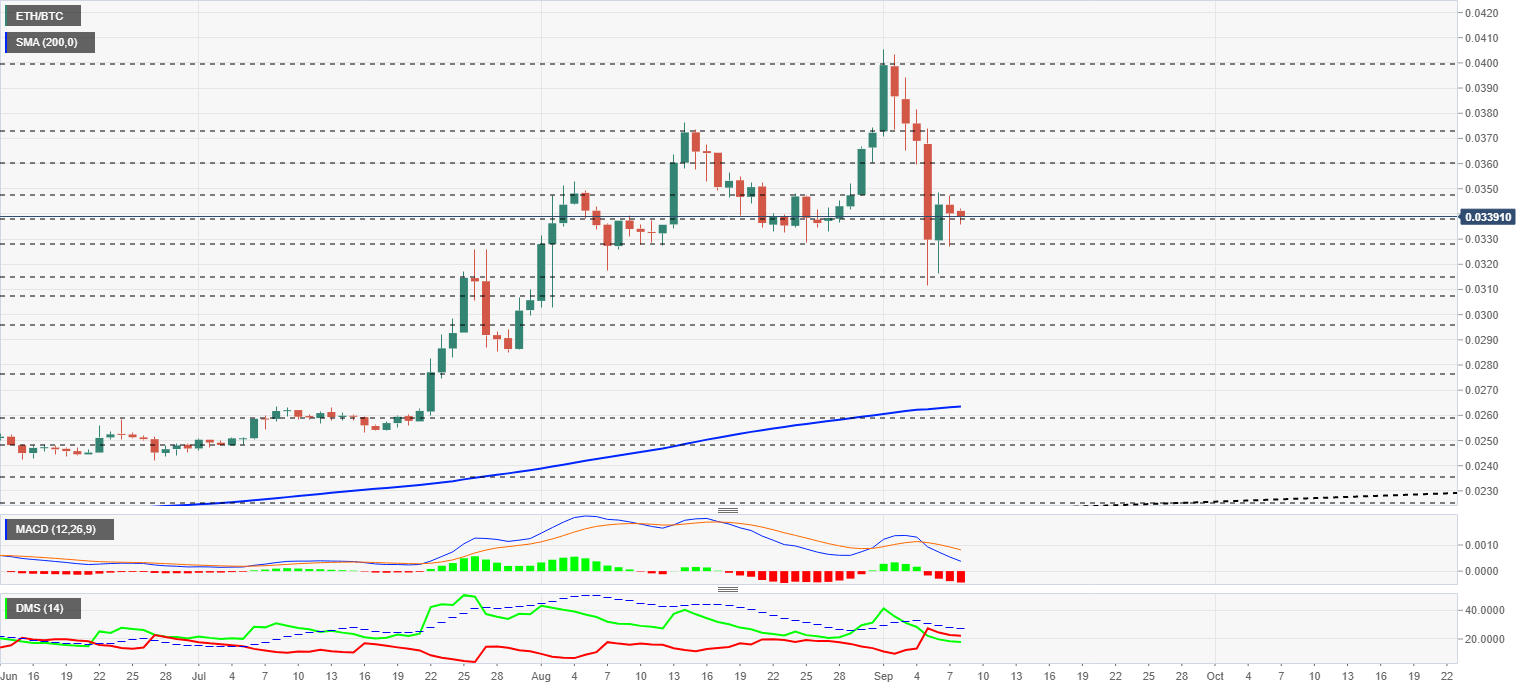
The MACD on the daily chart shows an increase in the slope and also in the line spacing. The potential for downward movement is essential, and only the arrival of the indicator's zero levels can provide support for the ETH/BTC pair.
The DMI on the daily chart shows bears in a control position, although they lack a sufficient advantage over bulls.
BTC/USD Daily Chart
The BTC/USD pair is currently trading at the price level of $10279 and enjoys the price congestion support of $10175 that it has built up over the past few sessions. There is excellent support at the $9500 level, which could contain the decline in the BTC/USD price.
Above the current price, the first resistance level is at $10175, then the second at $9500 and the third one at $8750.
Below the current price, the first support level is at $8750, then the second at $8575 and the third one at $8250.
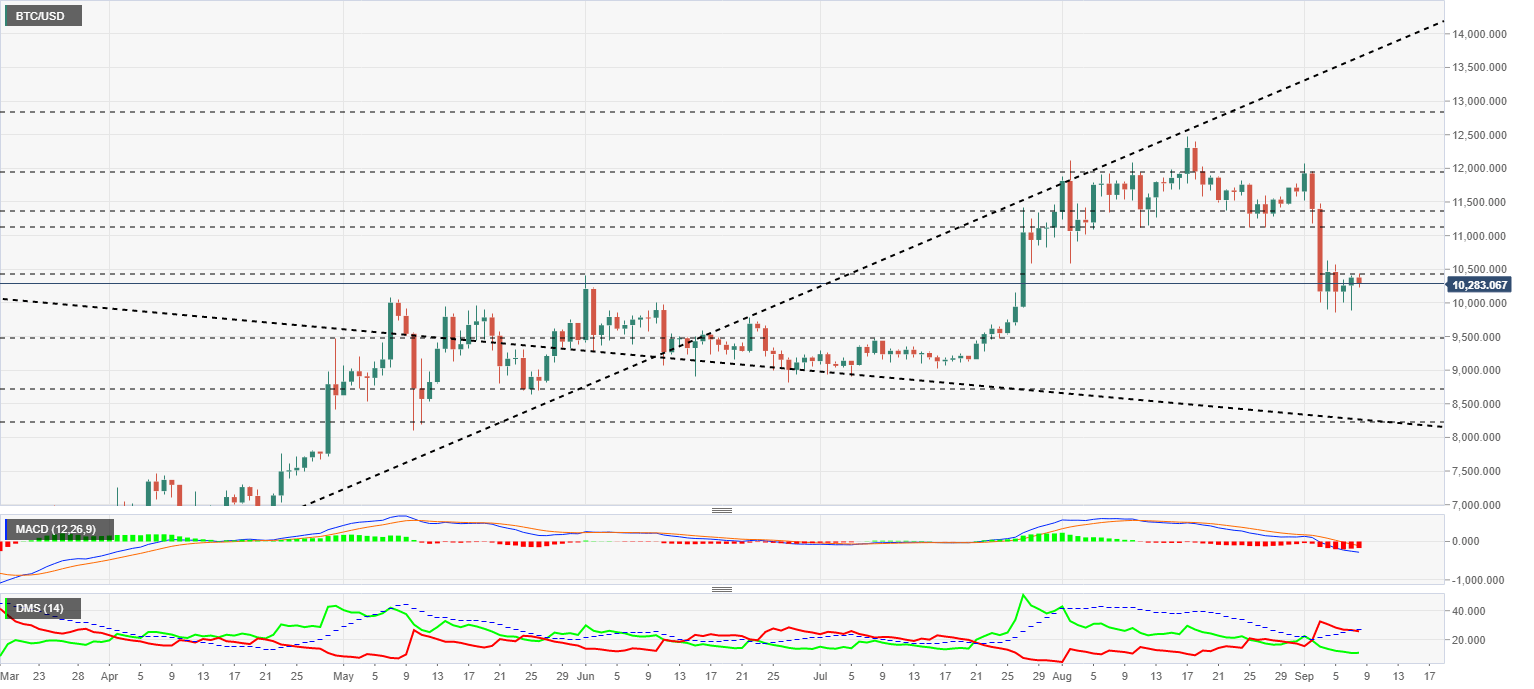
The MACD on the daily chart continues to move downward and enters the bearish side of the indicator. The current position of the moving averages increases the possibility of a short-term upward rebound.
The DMI on the daily chart shows bears losing support from the ADX line and faces a loss of momentum on the sell-side.
ETH/USD Daily Chart
The ETH/USD pair is currently trading at $346.4, and sellers are back after two days of recovery from the first downward leg.
Above the current price, the first resistance level is at $360, then the second at $390 and the third one at $400.
Below the current price, the first support level is at $335, then the second at $315 and the third one at $290.
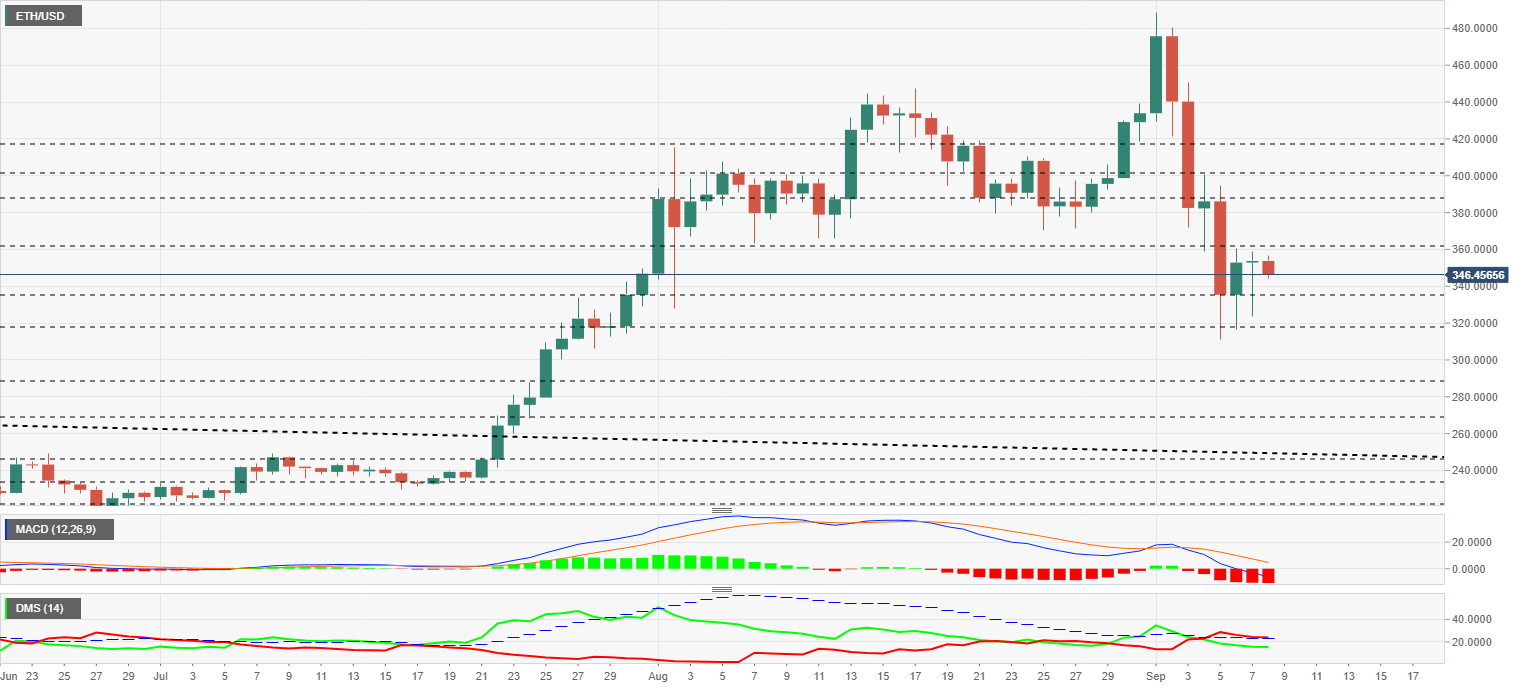
The MACD on the daily chart is entering the bearish zone with a significant slope and line separation. The short-term projection is bearish, although a short-term upward bounce is possible.
The DMI on the daily chart shows bears finding support at the ADX line and retains full downward potential.
XRP/USD Daily Chart
The XRP/USD pair is currently trading at the $0.24 price level and is in a robust support zone which should not be drilled down. Below the $0.225 level would make things very difficult for the Ripple in the medium-to-long term.
Above the current price, the first resistance level is at $0.26, then the second at $0.28 and the third one at $0.295.
Below the current price, the first support level is at $0.235, then the second at $0.226 and the third one at $0.215.
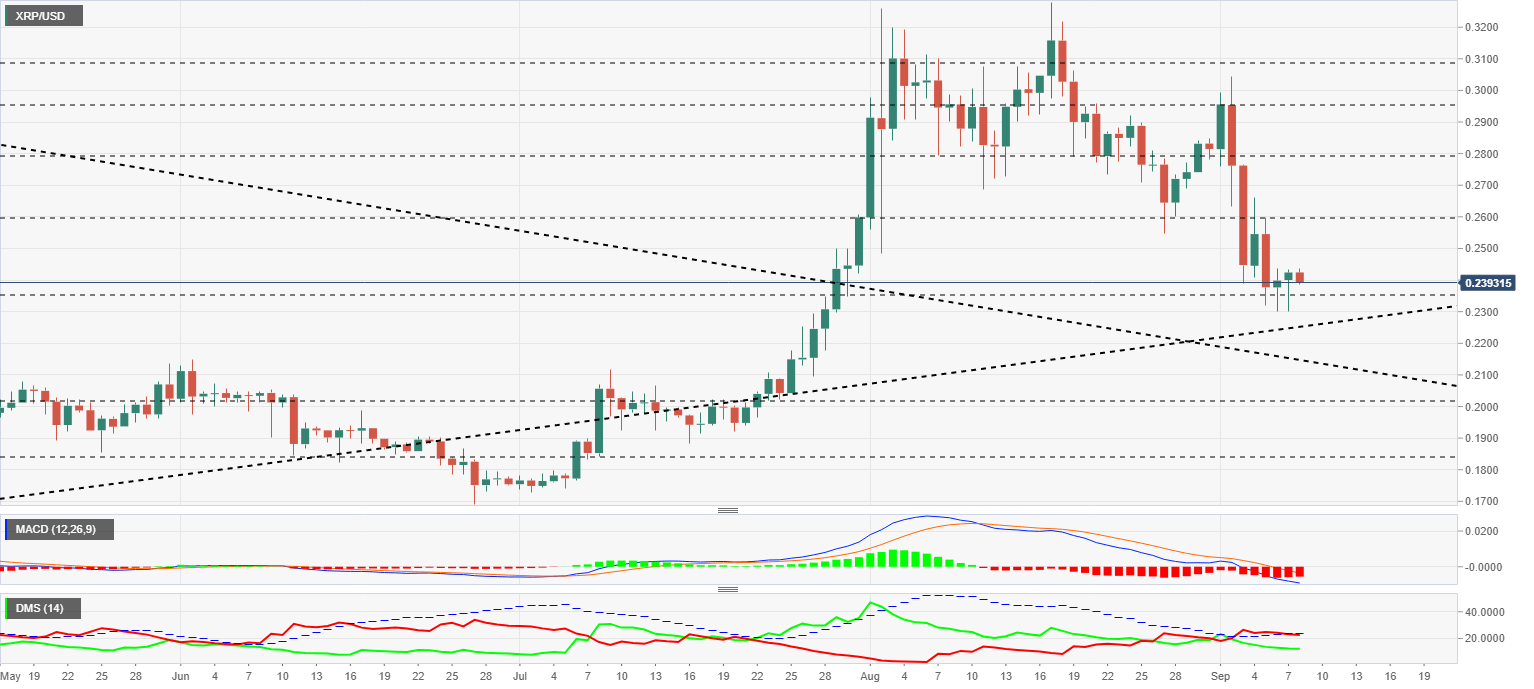
The MACD on the daily chart is entering the bearish zone of the indicator with an aggressive profile indicating that there is still significant downward potential in XRP/USD. The current structure of the moving averages is prone to upward bounce in the short term.
The DMI on the daily chart shows bears losing support from the ADX line, which would detract from the current downward trend.
Author

Tomas Salles
FXStreet
Tomàs Sallés was born in Barcelona in 1972, he is a certified technical analyst after having completing specialized courses in Spain and Switzerland.


