- Bitcoin wants to regain dominance but Ether doesn't give up and continues to push.
- The market moves in borderline areas that can bring surprises on both sides of the market.
- XRP avoids the fight and waits for the verdict on its own lack of strength.
“Every Champion was once a contender who refused to give up” – Rocky Balboa –
The crypto market continues to be stuck at the critical resistance levels and is beginning to show signs of depletion. The feeling on the charts is that the fight will go on for a few more rounds.
Elite boxing at its best currently sets the limit of fighting at 12 rounds, but in the last century, it was not unusual for fights to drag on until one of the two contestants kissed the canvas.
Neither King Bitcoin nor Altcoins' armies will throw in the towel. With an outstanding record of survival from attack, criticism, suspicion, regulation and theft, the crypto market is here to stay.
Not all projects will survive in the long run, and new ones will come to claim their share of the market.
Ether has reached a key resistance level in its fight against Bitcoin coinciding with key resistance levels against the USD and may need to ring the bell and give up a couple of rounds against Bitcoin looking to regain strength.
However, it's still possible that the eternal prince of cryptocurrencies will throw a winning punch and now he's playing a game of trickery.
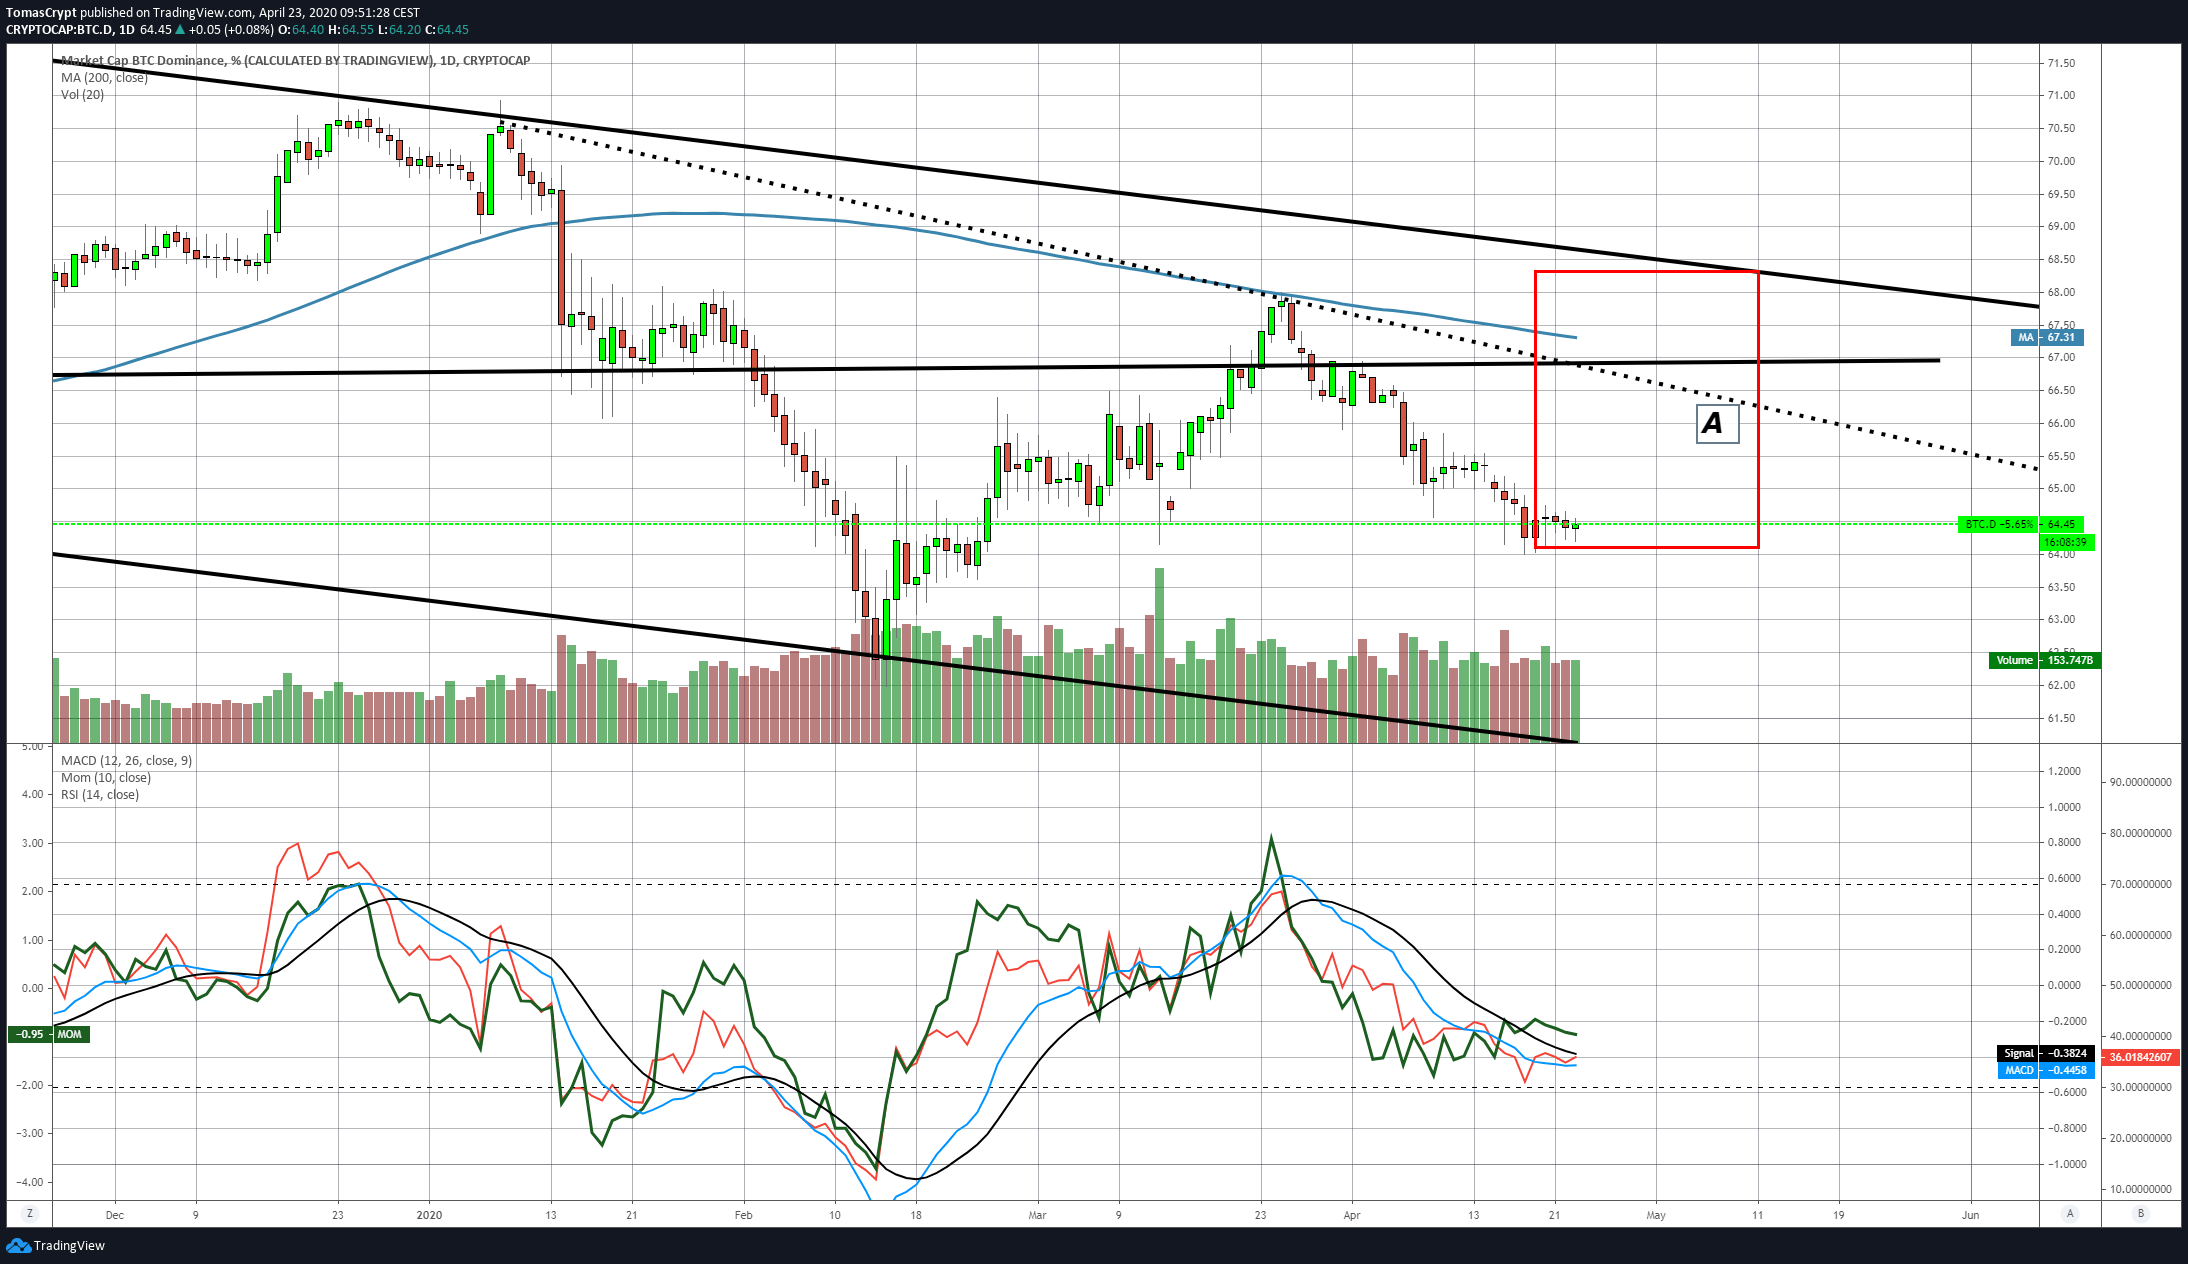 The Bitcoin dominance graph shows a definite increase in the chances of the King of cryptocurrencies regaining some of the lost ground.
The current Bitcoin dominance level is 64.44 while the SMA200 is currently moving at 67.31 while looking for the confluence with supports and trend lines at 66.50.
The indicators show an acceleration in momentum and an improvement in relative strength. The MACD still shows an immature profile to expect rapid rises in the dominance level.
ETH/BTC Daily Chart
The ETH/BTC pair is currently trading at the price level of 0.0255 after stopping when it reaches the upper level of the rising triangle figure. The bullish projection in the event of a resistance breakout marks the target level of 0.0365 (+42.97%). Continuing the boxing simile, Ether has a chance to put Bitcoin on the ropes.
On the downside, there is strong supports in the 0.0222 (-12.8%) zone.
Above the current price, the first resistance level is at 0.0258, then the second at 0.0267 and the third one at 0.0275.
Below the current price, the first support level is at 0.0255, then the second at 0.023 and the third one at 0.0227.
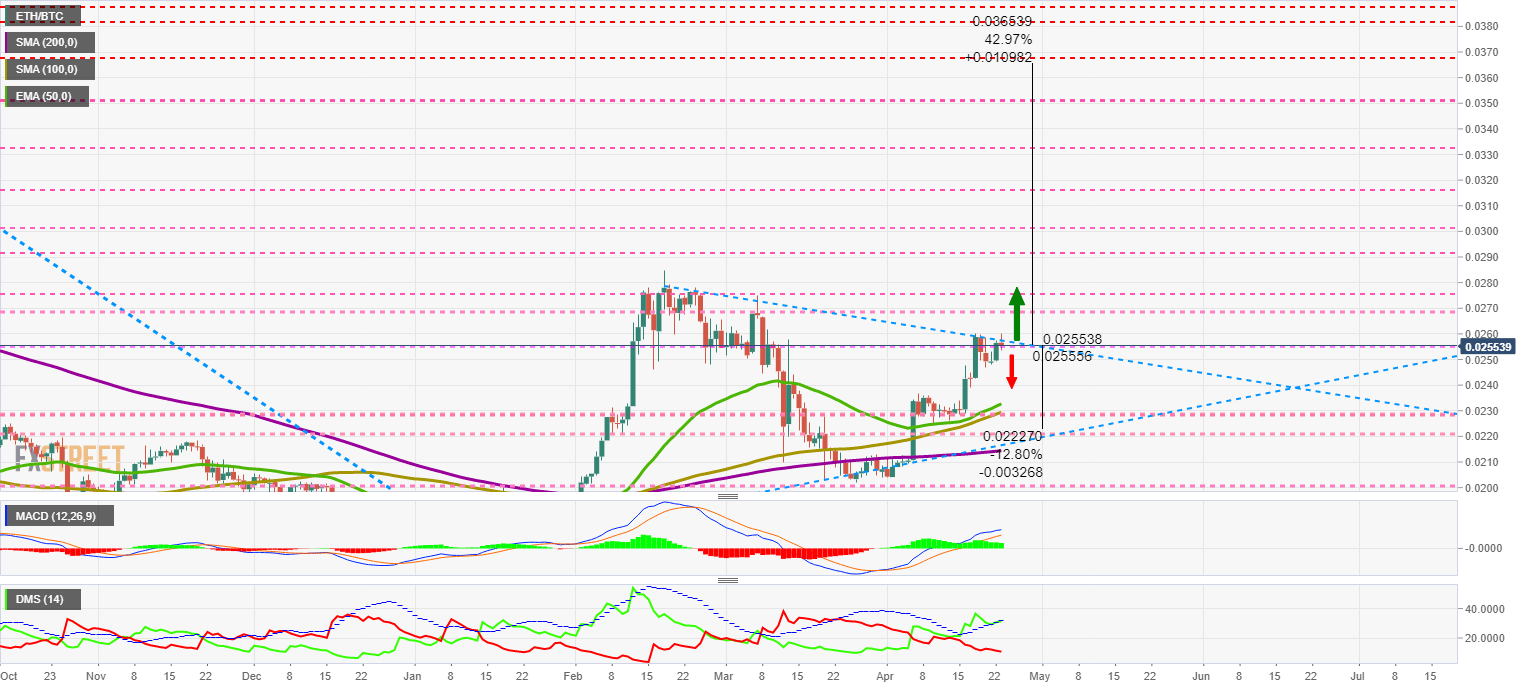 The MACD on the daily chart retains the bullish profile, both in the open and in sloped form. The technical aspect of this pair may worsen if the ETH/BTC pair is unable to overcome the current resistance levels.
The DMI on the daily chart is a perfect reflection of the current situation. The bulls are moving just above the ADX line, but for the time being, they avoid triggering the bearish pattern. The bears are continuing their downward trend and are still far from reaching extreme levels.
BTC/USD Daily Chart
The BTC/USD pair is currently trading at the price level of $7090 and is playing above the upper line of the long-term bearish channel today.
Above the current price, the first resistance level is at $7400, then the second at $7600 and the third one at $8000.
Below the current price, the first support level is at $7000, then the second at $6800 and the third one at $6550.
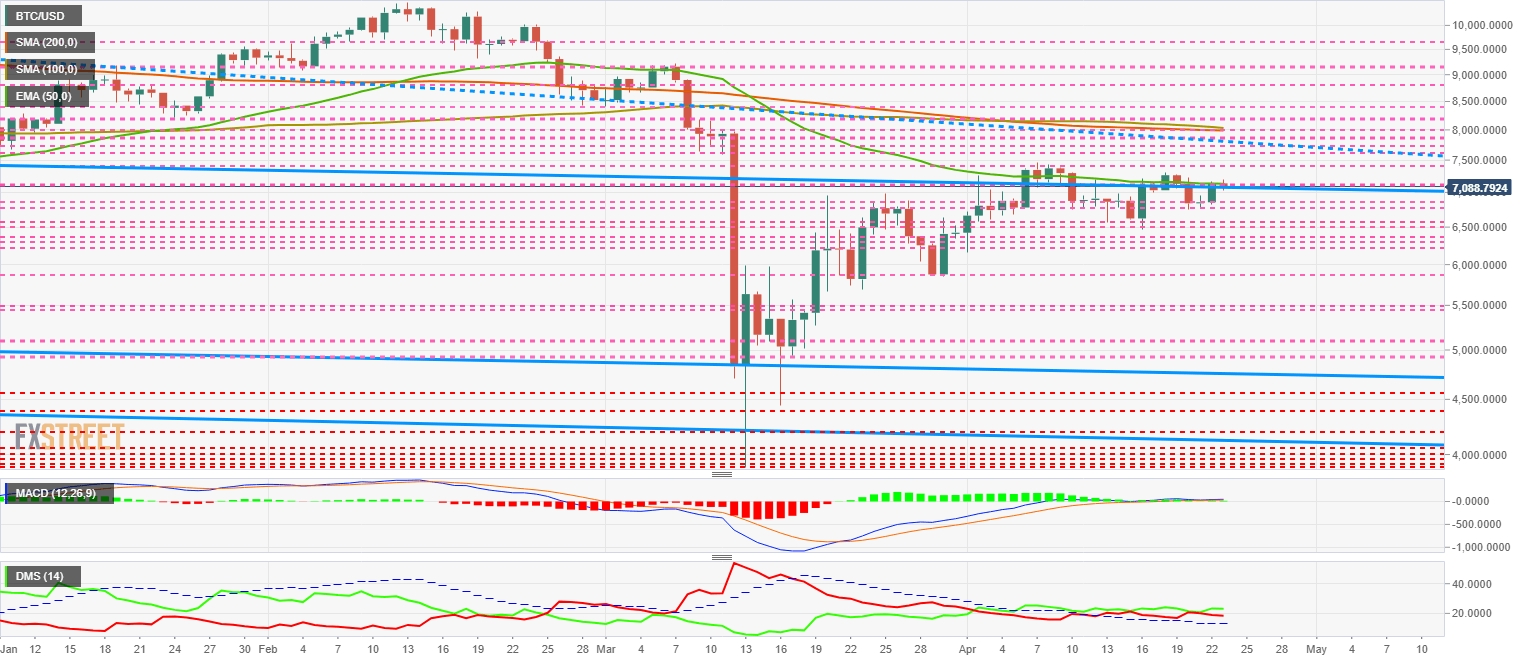 The MACD on the daily chart shows a slight improvement in the profile, but it is not enough to take the moving averages out of the current sideways structure.
The DMI on the daily chart shows the bulls getting a bit of an edge on the bears, but they will need more money and the critical level of $8000 to win the fight.
ETH/USD Daily Chart
The ETH/USD pair is currently trading at $181 and is unable to break the SMA100 at $185.2
Above the current price, the first resistance level is at $190, then the second at $195 and the third one at $200.
Below the current price, the first support level is at $180, then the second at $170 and the third one at $165.
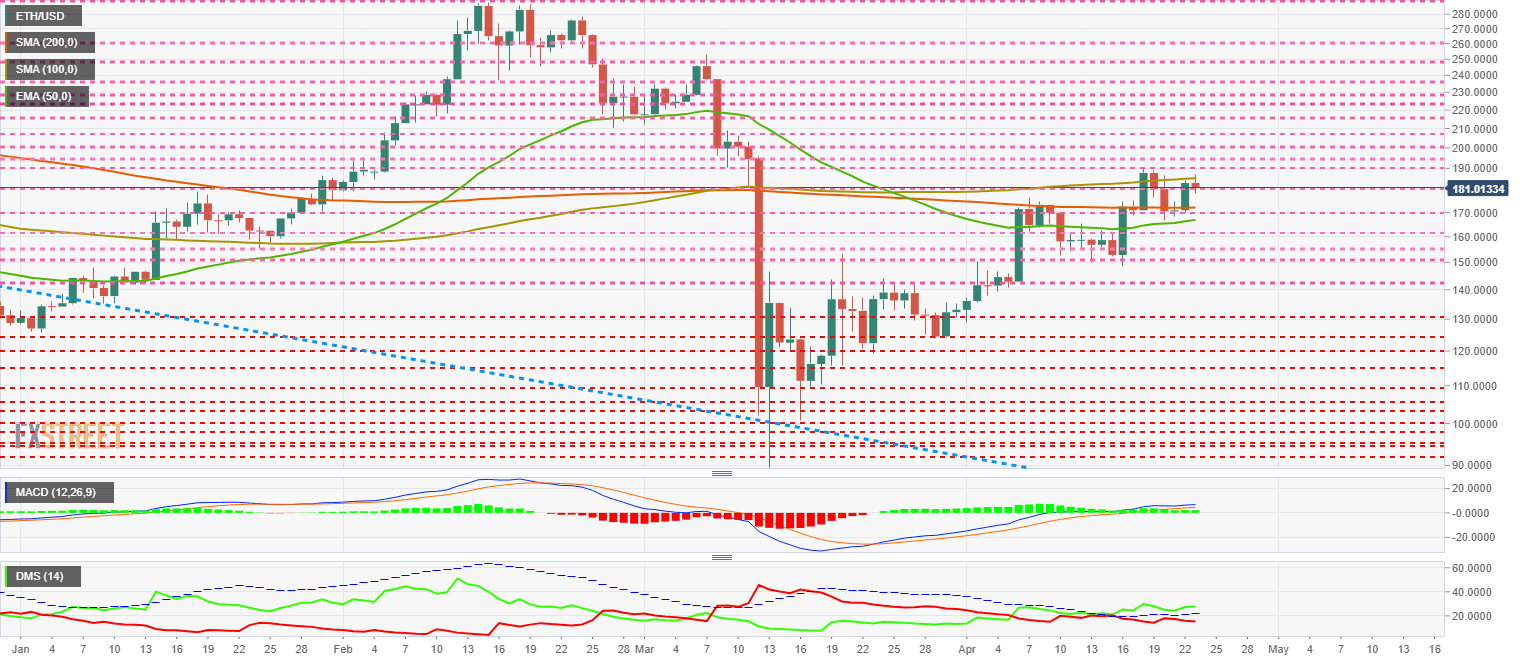
The MACD on the daily chart shows an improvement in the upward trend of the moving averages. The gap between the lines continues to be minimal, and ETH/USD needs to break above $190 for the upward movement to resume.
The DMI on the daily chart shows bulls gaining height and distance from bears. The selling side is not confident in its strength and is maintaining its downward trend.
XRP/USD Daily Chart
The XRP/USD pair is currently trading at the price level of $0.187, and it's unable to exceed the EMA50 by $0.1924 for another day.
Above the current price, the first resistance level is at $0.1924, then the second at $0.20 and the third one at $0.218.
Below the current price, the first level of support is at $0.18, then the second at $0.17 and the third one at $0.162.
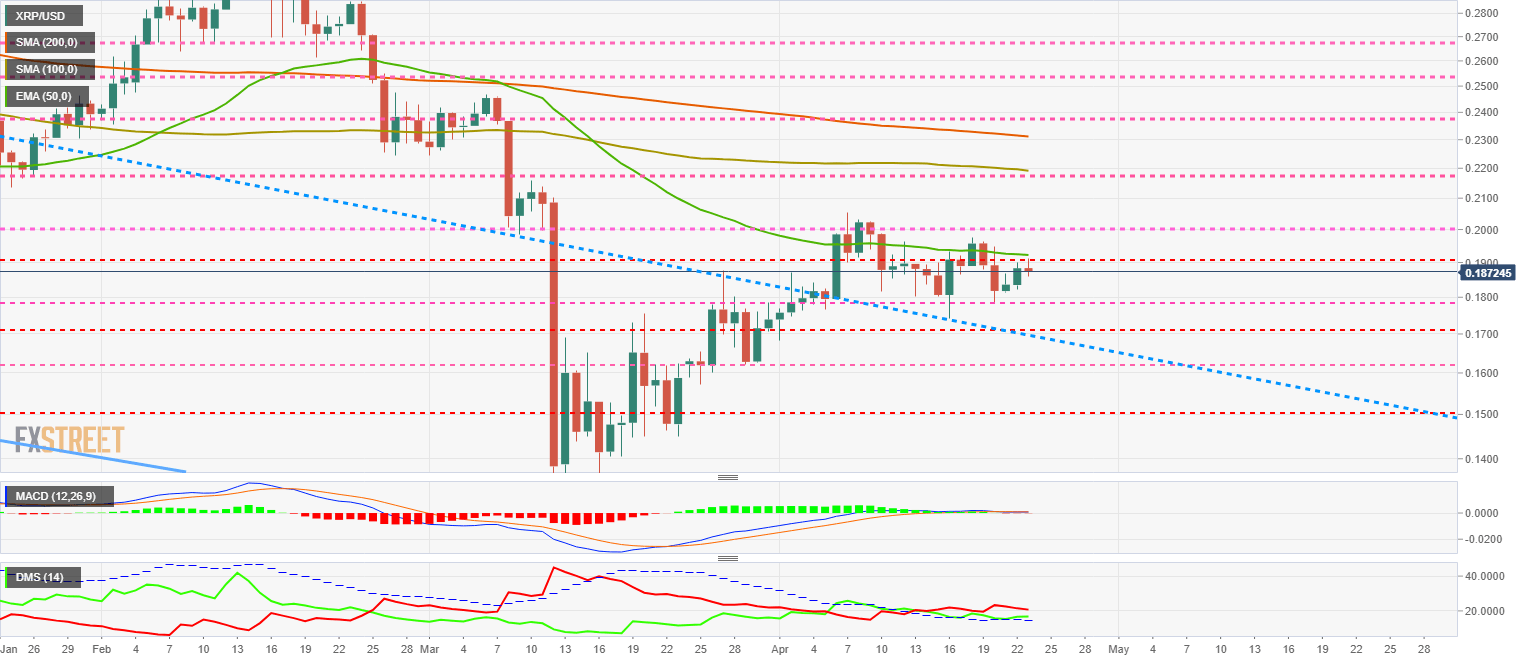 The MACD on the daily chart shows an entirely neutral profile, and only slightly tilted towards the bullish side as it is still in the positive zone of the indicator.
The DMI on the daily chart shows the bear has been monitoring the pair for ten days without any problems. The bulls don't seem willing to dispute the pair's control, but at least they are staying above the ADX line.
Information on these pages contains forward-looking statements that involve risks and uncertainties. Markets and instruments profiled on this page are for informational purposes only and should not in any way come across as a recommendation to buy or sell in these assets. You should do your own thorough research before making any investment decisions. FXStreet does not in any way guarantee that this information is free from mistakes, errors, or material misstatements. It also does not guarantee that this information is of a timely nature. Investing in Open Markets involves a great deal of risk, including the loss of all or a portion of your investment, as well as emotional distress. All risks, losses and costs associated with investing, including total loss of principal, are your responsibility. The views and opinions expressed in this article are those of the authors and do not necessarily reflect the official policy or position of FXStreet nor its advertisers. The author will not be held responsible for information that is found at the end of links posted on this page.
If not otherwise explicitly mentioned in the body of the article, at the time of writing, the author has no position in any stock mentioned in this article and no business relationship with any company mentioned. The author has not received compensation for writing this article, other than from FXStreet.
FXStreet and the author do not provide personalized recommendations. The author makes no representations as to the accuracy, completeness, or suitability of this information. FXStreet and the author will not be liable for any errors, omissions or any losses, injuries or damages arising from this information and its display or use. Errors and omissions excepted.
The author and FXStreet are not registered investment advisors and nothing in this article is intended to be investment advice.
Recommended Content
Editors’ Picks

Top 3 gainers Supra, Cosmos Hub, EOS: Supra leads recovery after Trump’s tariffs announcement
Supra’s 25% surge on Friday calls attention to lesser-known cryptocurrencies as Bitcoin, Ethereum and XRP struggle. Cosmos Hub remains range-bound while bulls focus on a potential inverse head-and-shoulders pattern breakout.

Bitcoin Weekly Forecast: Tariff ‘Liberation Day’ sparks liquidation in crypto market
Bitcoin price remains under selling pressure around $82,000 on Friday after failing to close above key resistance earlier this week. Donald Trump’s tariff announcement on Wednesday swept $200 billion from total crypto market capitalization and triggered a wave of liquidations.

Can Maker break $1,450 hurdle as whales launch buying spree?
Maker is back above $1,300 on Friday after extending its lower leg to $1,231 the previous day. MKR’s rebound has erased the drawdown that followed United States President Donald Trump’s ‘Liberaton Day’ tariffs on Wednesday, which targeted 100 countries.

Gold shines in Q1 while Bitcoin stumbles
Gold gains nearly 20%, reaching a peak of $3,167, while Bitcoin nosedives nearly 12%, reaching a low of $76,606, in Q1 2025. In Q1, the World Gold ETF's net inflows totalled 155 tonnes, while the Bitcoin spot ETF showed a net inflow of near $1 billion.
Bitcoin Weekly Forecast: Tariff ‘Liberation Day’ sparks liquidation in crypto market
Bitcoin (BTC) price remains under selling pressure and trades near $84,000 when writing on Friday after a rejection from a key resistance level earlier this week.

The Best brokers to trade EUR/USD
SPONSORED Discover the top brokers for trading EUR/USD in 2025. Our list features brokers with competitive spreads, fast execution, and powerful platforms. Whether you're a beginner or an expert, find the right partner to navigate the dynamic Forex market.