Top 3 Price Prediction Bitcoin, Ethereum, Ripple: BTC stumbles while ETH and XRP consolidate rapid gains
- Bitcoin price prints marginal new high, but Coinbase IPO fails to extend the rally.
- Ethereum has successfully decoupled from BTC as new hard fork seeks to lower gas fees.
- Ripple pullback has unfolded in an A-B-C corrective formation after striking psychologically important $2.

The Coinbase (COIN) initial public offering (IPO) on Wednesday was matched by daily gains for all three of the major cryptocurrencies, with Ethereum and Ripple closing with gains of over 3%. In comparison, Bitcoin gained less than 2%.
Bitcoin price cannot generate momentum to sustain new highs
The larger BTC price structure continues to take the form of a rising wedge pattern with one more touch of the upper trend line needed to complete the pattern. It would represent an extension of the rally by another 5% from the April 14 high. To complement the projection of new marginal highs is the unfolding A-B-C corrective formation on the 12-hour chart.
BTC was not successful on the first attempt overcoming the resistance at the 361.8% extension of the 2017-2018 bear market at $63,777, so it will remain a resistance level if price strengthens once again.
The primary resistance and arbitrator of the bearish outlook is the wedge’s upper trend line, currently at $67,880. If price reverses, it will trigger a quicker than expected decline that won’t find support until the intersection of the 50 twelve-hour simple moving average (SMA) at $58,157 and the wedge’s lower trend line at $57,700.
Below the trend line awaits incremental support beginning with the 100 twelve-hour SMA at $55,787 followed by the April low at $55,400, before a test of the March low at $50,305.
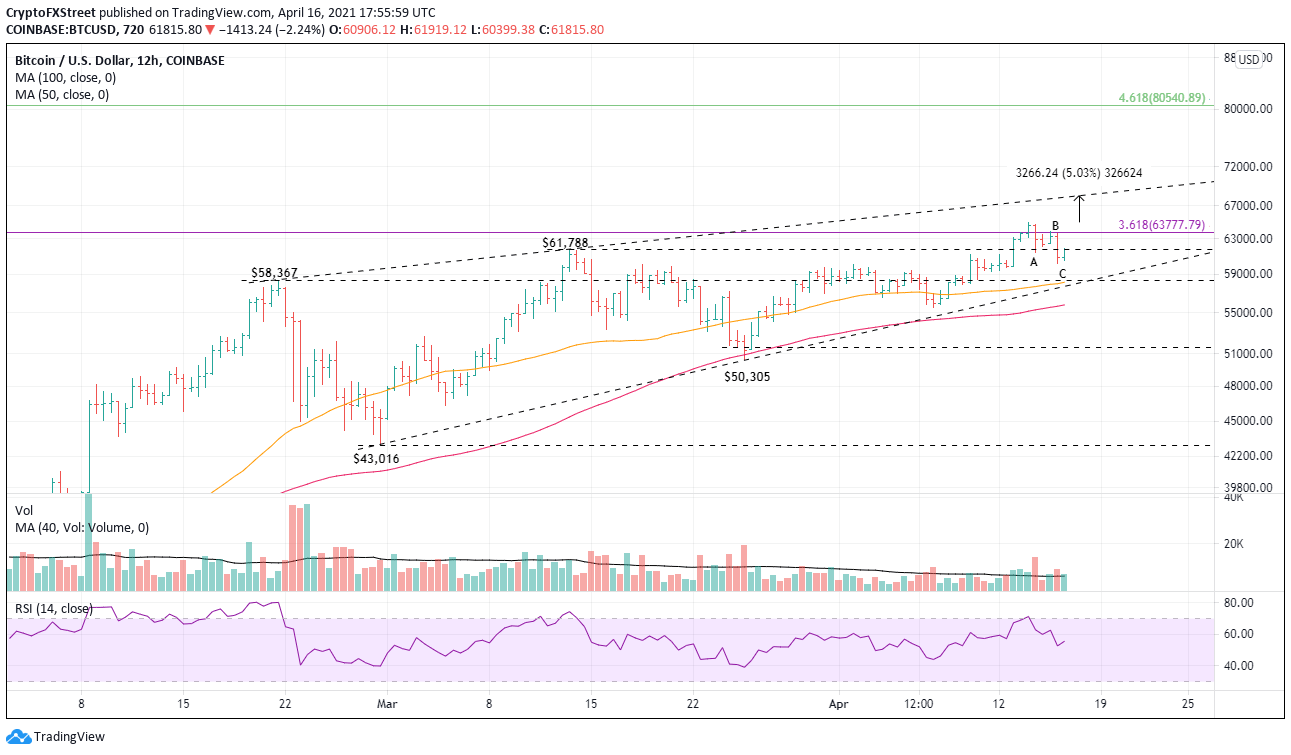
BTC/USD 12-hour chart
A successful breakout at the wedge’s upper trend line would trigger a rally to the 461.8% extension of the 2017-2018 bear market at $80,540.
Ethereum price tags significant short-term resistance
It has been 18 days since the ETH breakout from a symmetrical triangle. The rally has overcome the February high at $2,041, the 161.8% Fibonacci extension of the 2018 bear market at $2,247, and just touched the 161.8% extension of the February correction at $2,507 and the triangle’s measured move target of $2,507. In the process, it registered the best 3-day gain of 17.73% since late January.
Once the Fibonacci cluster and measured move target are cleared, ETH could rally to the 261.8% extension of the February extension at $3,253. If the volume continues to rise, the 261.8% extension of the 2018 bear market at $3,587 is the next target.
It is important to note that the daily Relative Strength Index (RSI) is not overbought yet.
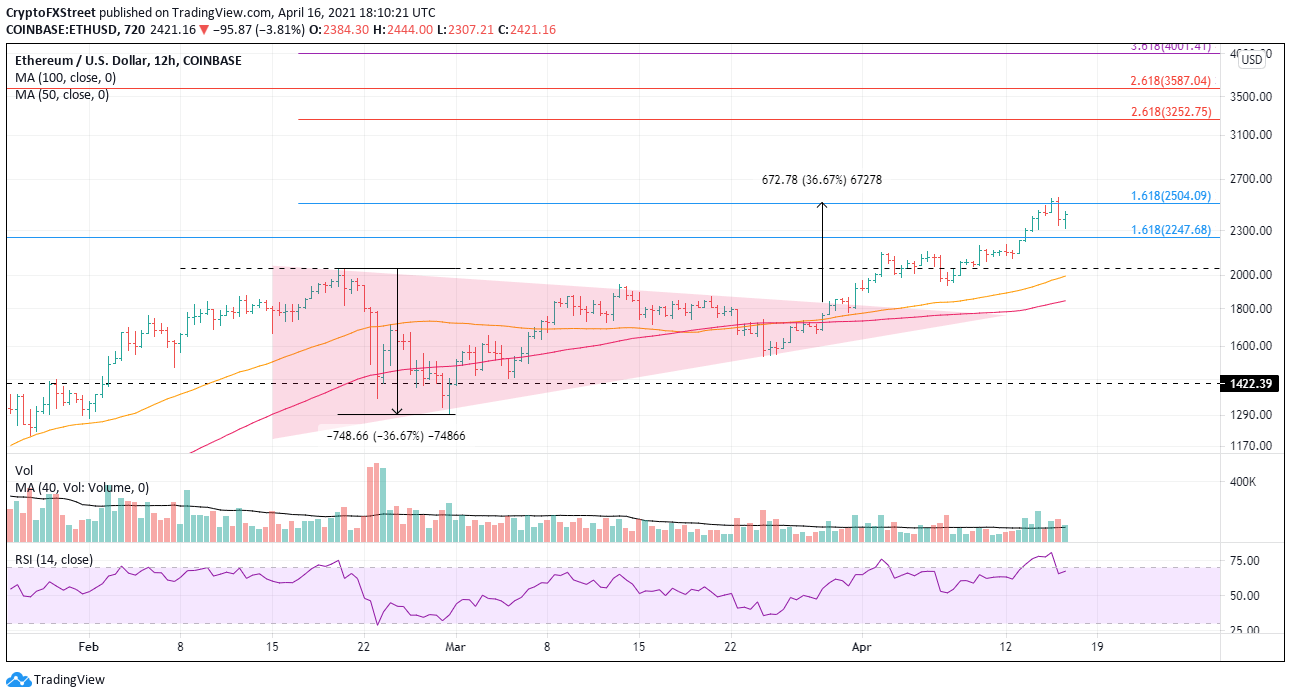
ETH/USD 12-hour chart
A reversal of fortunes is always a possibility in investing, and ETH speculators should mark the early April highs as the first level of support if heavy selling emerges. The following support level is at the February high of $2,041. A failure there cancels the bullish outlook and puts price on course to test the 50-day simple moving average (SMA) at $1,835.
XRP price weakness being bought by speculators
Every rally needs consolidation, and that is precisely what has been taking place in Ripple since the April 14 high. The cross-border remittances token gained over 200% from April 5 to April 14, sparked by a bullish news roll.
The 3-day correction has taken the form of an A-B-C correction, and it touched the projected 38.2% retracement level of the April rally at $1.42. Further weakness may emerge, but the bullish reversal today from the retracement level suggests that there are eager speculators taking advantage of the decline. A close in the upper half of the daily bar would confirm it.
Upside targets include $2.00, the 61.8% retracement of the 2018-2020 bear market at $2.08, and the 78.6% retracement at $2.62, for the ambitious speculators.
In the medium term, it is projected that Ripple will test the all-time high at $3.30.

XRP/USD 12-hour chart
A breach of the 38.2% retracement would dampen the bullish thesis and delay a successful break of $2 into May or later.
Author

Sheldon McIntyre, CMT
Independent Analyst
Sheldon has 24 years of investment experience holding various positions in companies based in the United States and Chile. His core competencies include BRIC and G-10 equity markets, swing and position trading and technical analysis.


