Top 3 Price Prediction Bitcoin, Ethereum, Ripple: BTC on the fast track to $30,000 while altcoins are overpowered
- Bitcoin price triggers a Death Cross signal as 50-day SMA falls below the 200-day SMA.
- Ethereum price tests the 200-day SMA for the first time since April 22, 2020.
- XRP price drives below several key support levels in a rush to test the May 23 low of $0.652.

Bitcoin price is currently trading with the largest daily loss since the May 19 drop of 14.29%, touching the symmetrical triangle’s lower trend line. Ethereum price flashing double-digit decline for the first time since May 29. XRP price exposes the worst trading day since the correction low on May 23.
Bitcoin price not confirming BTC as the ultimate store of value
Up until June 15, Bitcoin price manufactured one of the better rallies in the first half of June, lifting the flagship cryptocurrency 33% and within 260 points of a substantial range of resistance. The range is constructed by the 50-day SMA at $41,946, the 38.2% Fibonacci retracement of the April-May correction at $43,331, the 200-day SMA at $43,120 and the 38.2% retracement of the 2020-2021 advance at $41,581.
The rally immediately reversed lower, pushing Bitcoin price down the symmetrical triangle’s lower trend line today and near the June 8 low of $31,013, yielding a 23% decline. BTC triggered a death cross signal during the turn lower when the 50-day simple moving average (SMA) crossed below the 200-day SMA on Saturday.
For some background, in March 2020, a death cross signal was a miss as it occurred after BTC was in a new uptrend. In October 2019, a death cross signal was followed by a 30% decline that endured until December 2019. And a death cross signal in March 2018 was immediately followed by a big bounce before turning lower gain and printing the eventual low in December 2018, showing a 50% loss from the day of the signal.
With the unsuccessful test of the omnipresent resistance around $41,581-$43,331, the resulting sharp reversal and the death cross, it is imperative to consider a larger head-and-shoulders pattern near that is completion.
A daily close below $30,000 would trigger the head-and-shoulders pattern and expose Bitcoin price to a collapse to the 200-week SMA at $13,388, based on the measured move of 54% for the topping pattern.
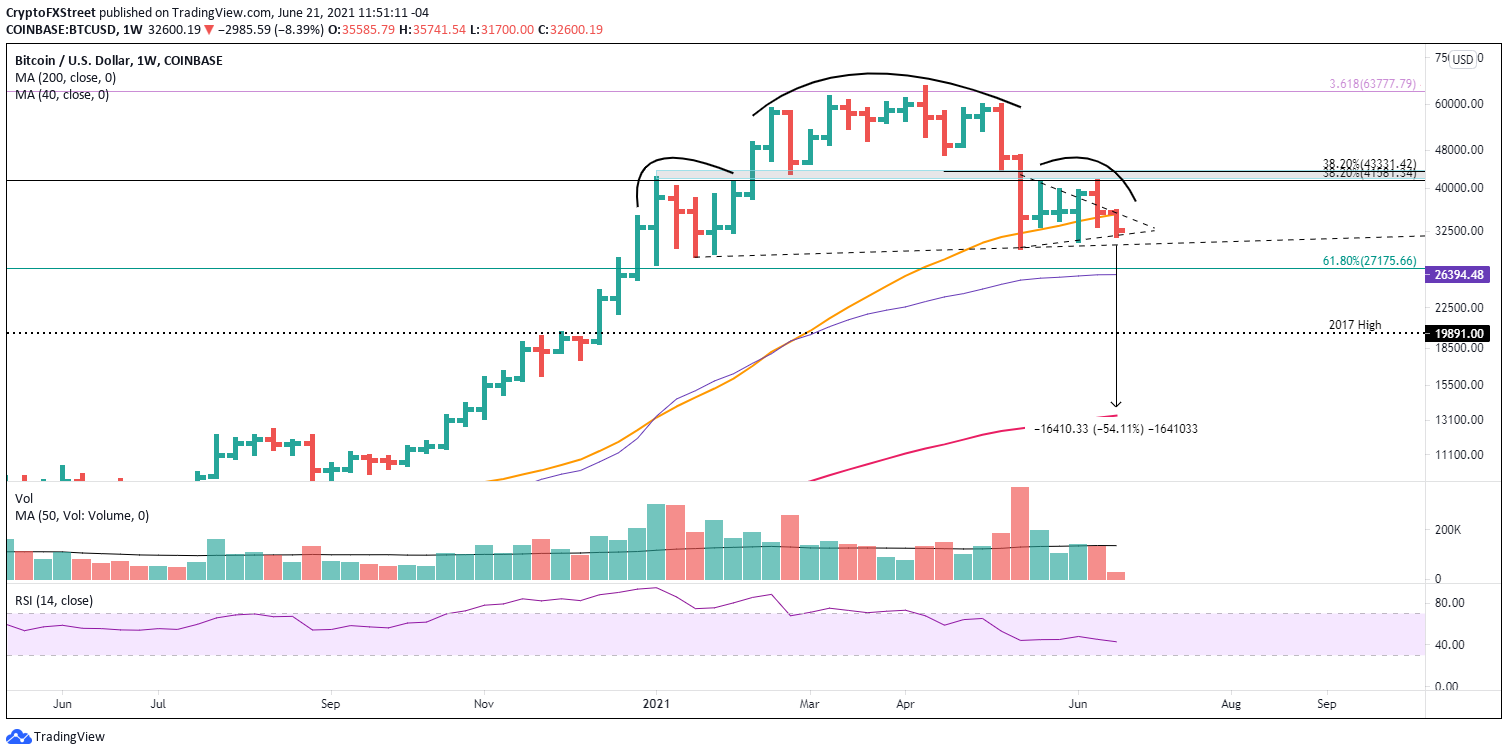
BTC/USD weekly chart
Bitcoin price is enveloped by a key area of support between $30,000 and $32,000, possibly preventing further BTC deterioration. It could be a superior risk level to target new long positions if investors are tilted bullish.
A daily close above $35,741 would be the first alert that a BTC bounce is materializing, but it isn't easy to lean heavily on the long side until a daily close above $43,331.
Bitcoin price is at a short-term pivotal point in the continuing corrective process that began in April. The more prominent technical pattern forecasts a bold decline that would leave the cryptocurrency market in shock and awe. Still, the presence of contagious support around the psychologically important $30,000 may prove enough to overcome the downward pressures.
Ethereum price has crypto traders searching for answers
From the May 23 low, Ethereum price sketched an uneventful path, with a progressively narrow range in the form of a symmetrical triangle. However, the June 16 break of the symmetrical triangle’s lower trend line forced ETH investors to consider a test of the May 23 low of $1,728 and potentially a much more significant sell-off.
The measured move of the symmetrical triangle is approximately 43% from the break lower on June 16, taking Ethereum price to $1,357.
Today, Ethereum price has struck support at the 200-day SMA, the first test of the strategically important moving average since April 22, 2020. ETH must hold the tight range between the May 23 low of $1,728 and the 200-day SMA at $1,872 on a daily closing basis. A failure to hold leaves the smart contracts giant vulnerable to a test of the 2018 high at $1,419, equaling a 28% decline from the current price. If selling pressure fails to subside at 2018 high, then the probabilities rise that the altcoin will sweep the measured move target of $1,357.
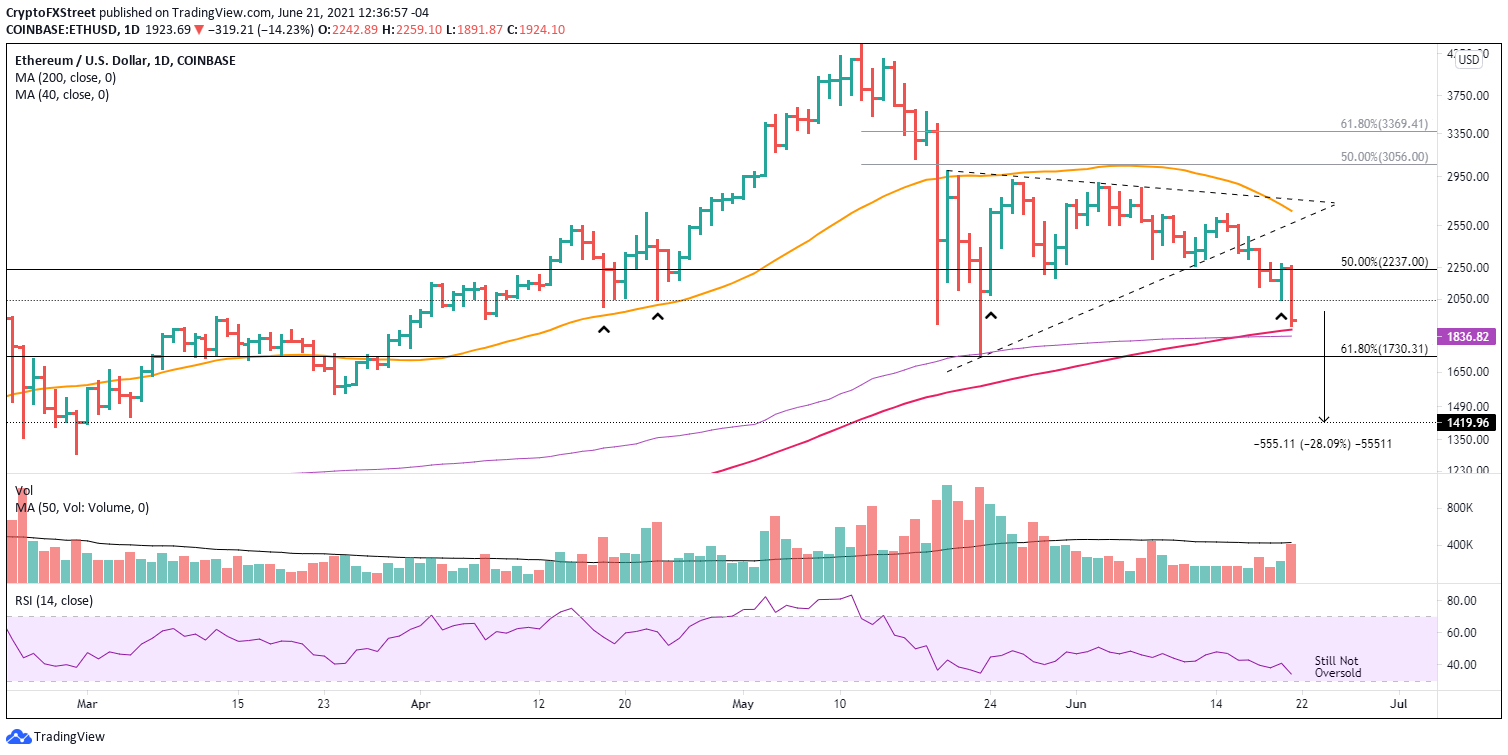
ETH/USD daily chart
A bullish reversal in Ethereum price and a daily close above the tactically important price level of $2,041 would be a starting point to evaluate swing trading opportunities from the long side. A bounce above $2,280 would be further confirmation of a new trading opportunity.
Ethereum price dislocation is not unlike most altcoins. ETH failed to show any impulsiveness or accumulation for almost a month. Despite being down 40-50% at different times, market operators were not motivated to enter the market with any commitment, leaving the digital asset locked in a tightening technical noose.
XRP price surprises investors with a meaningful drop below $0.76
XRP price has displayed a similar passiveness and lack of direction as many altcoins. Ripple was not inspired by the 30% rally in Bitcoin price, instead favoring to be range-bound between two imposing levels, the neckline of an inverse head-and-shoulders pattern at $0.76 and the psychologically important $1.00.
The range had not been accompanied by any signs of accumulation or distribution, raising the probability that XRP price would remain locked in the governing price range for the foreseeable future.
Within three days, XRP price is trading below $0.76, the anchored volume-weighted average price (anchored VWAP) of $0.742 and the 200-day SMA at $0.728. Ripple is on pace to close today, with the largest daily decline since May 21 and the lowest daily close since April 4.
It is essential to mention that XRP price formed a bear flag from May 23 until June 5. The pattern has a 55% measured move, staking a target price of $0.415. Based on the current price, it would be a 37% loss for faithful Ripple investors.
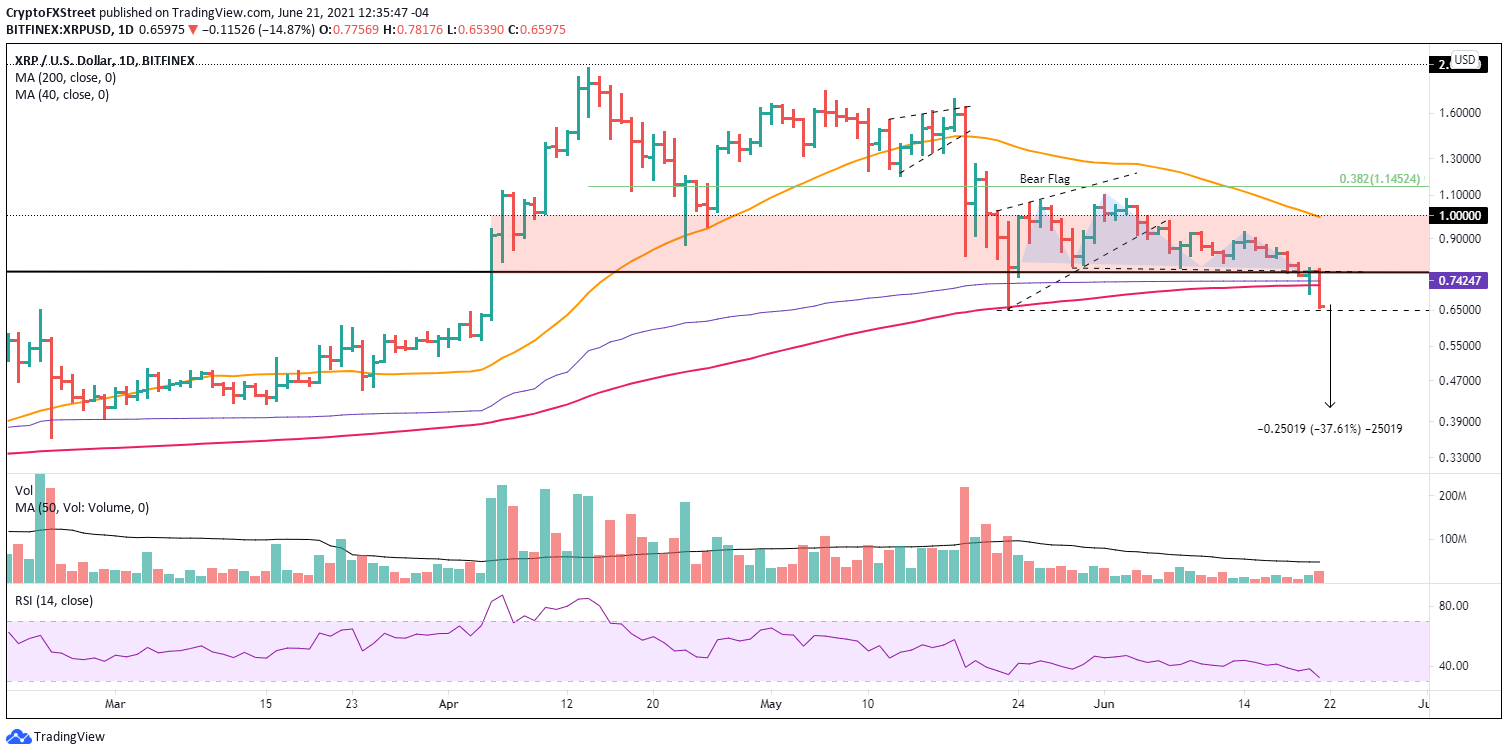
XRP/USD daily chart
Only a daily close above $0.76 would ignite a rethink of the cautious to negative view for XRP price.
Ripple investors need the May 23 low of $0.652 to hold on a daily closing basis, or XRP price could be destined to continue the notable selling. Whether it reaches the measured move target is difficult to discern at this moment, but it should be considered in any trading plan moving forward.
Author

Sheldon McIntyre, CMT
Independent Analyst
Sheldon has 24 years of investment experience holding various positions in companies based in the United States and Chile. His core competencies include BRIC and G-10 equity markets, swing and position trading and technical analysis.


