Top 3 Price Prediction Bitcoin, Ethereum, Ripple: BTC looking more bearish every day
- Bitcoin price shaping two bearish patterns, so pick your poison.
- Ethereum price faltering at new highs, but bullish outlook unchanged.
- XRP price spikes on a tsunami of buying, but consolidation is presumable.

The recovery of the cryptocurrency market from the late-March lows lifted the complex above the $2 trillion threshold, with Bitcoin still representing over 50% despite the lackluster price action. The rebound has been more bountiful for ETH bulls and exceptionally so for XRP speculators.
Bitcoin price continues to strikeout with rallies around $60,000
Two weeks ago, BTC appeared to be shaping an ascending wedge pattern that required at least one more marginal high and a test of the 3.618 Fibonacci extension of the 2017-2018 bear market before activating. However, over the last few days, the bellwether digital currency has defined a head-and-shoulders top pattern with the neckline passing through $54,750, just above the 100 twelve-hour simple moving average (SMA).
Support begins at the March low at $50,305, followed by the February low at $43,016. A decline of that magnitude would knock the Relative Strength Index (RSI) into an oversold condition, thereby creating the necessary reset for the bull market that began in 2020.
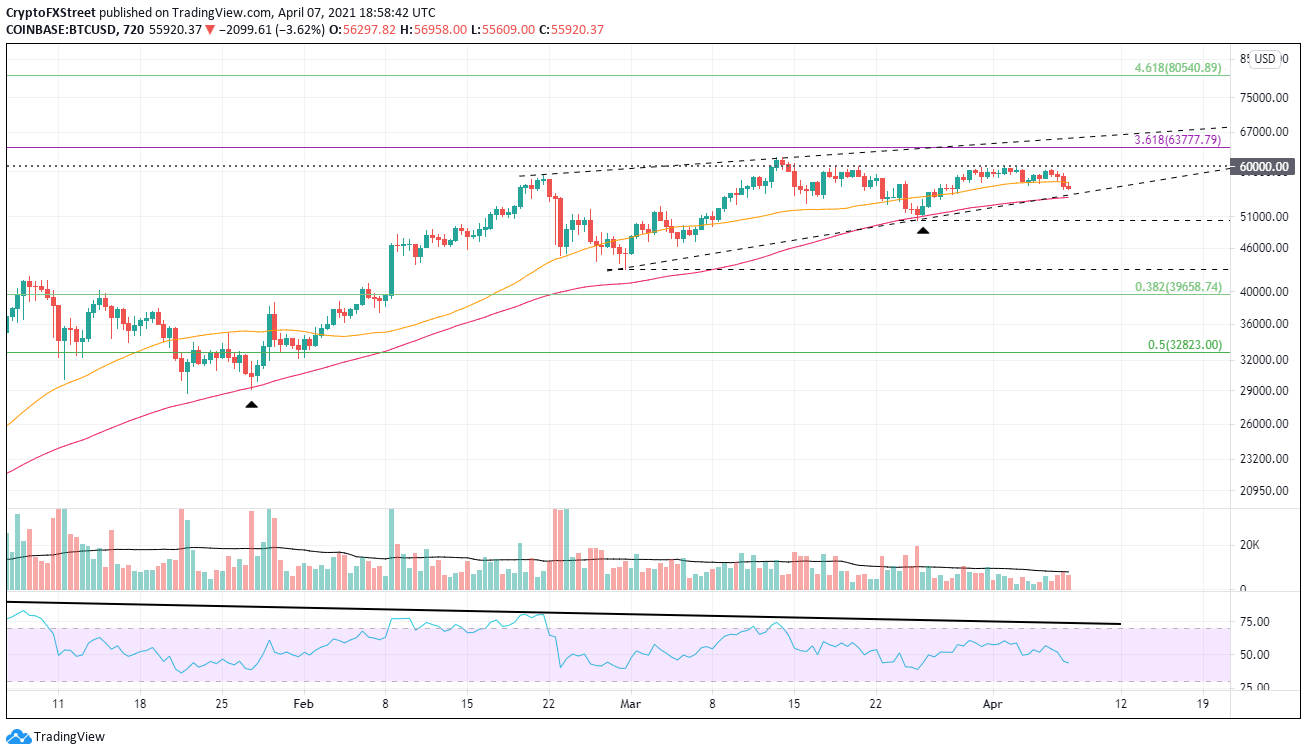
BTC/USD 12-hour chart
Even if BTC does bounce from the 100 twelve-hour SMA at $54,288, as it has in March and January of this year, it doesn’t dismiss the more prominent ascending wedge pattern. Bitcoin will need to overcome the upper trendline of the wedge before traders can aggressively renew their commitment.
Ethereum price high not confirmed by momentum index
Ethereum is struggling to hold the new all-time high price reached on April 2 as the steady consolidation has given way to some selling pressure today. The breakout from the symmetrical triangle on March 31 remains live, yet it is still possible that ETH will have a throwback to the upper trendline of the triangle. Traders need to be patient and give the smart contracts giant the opportunity to prove itself.
Upside targets include the 1.382 Fibonacci extension of the February correction at $2,327, followed by the 1.618 extension level at $2,504.
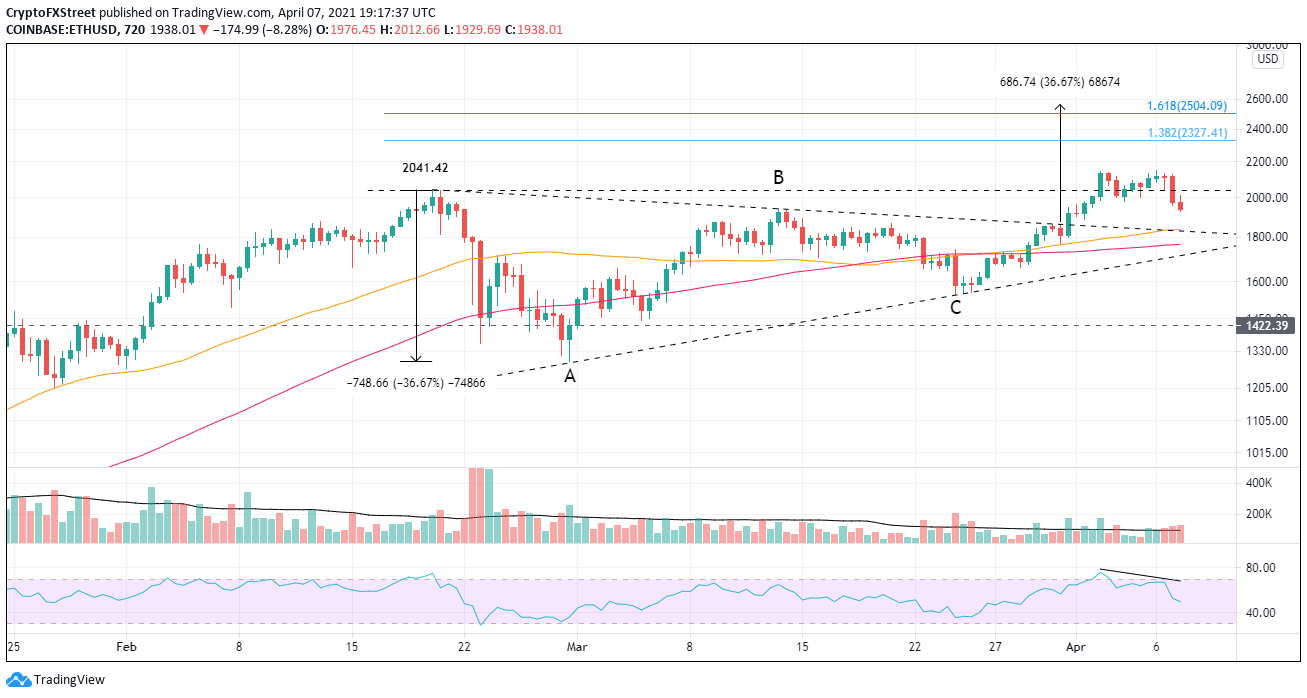
ETH/USD 12-hour chart
For traders holding the position that ETH is faltering because BTC has not printed a new high, they may be interested in knowing that Ethereum price broke out early this month from a double-bottom pattern versus Bitcoin’s price action.
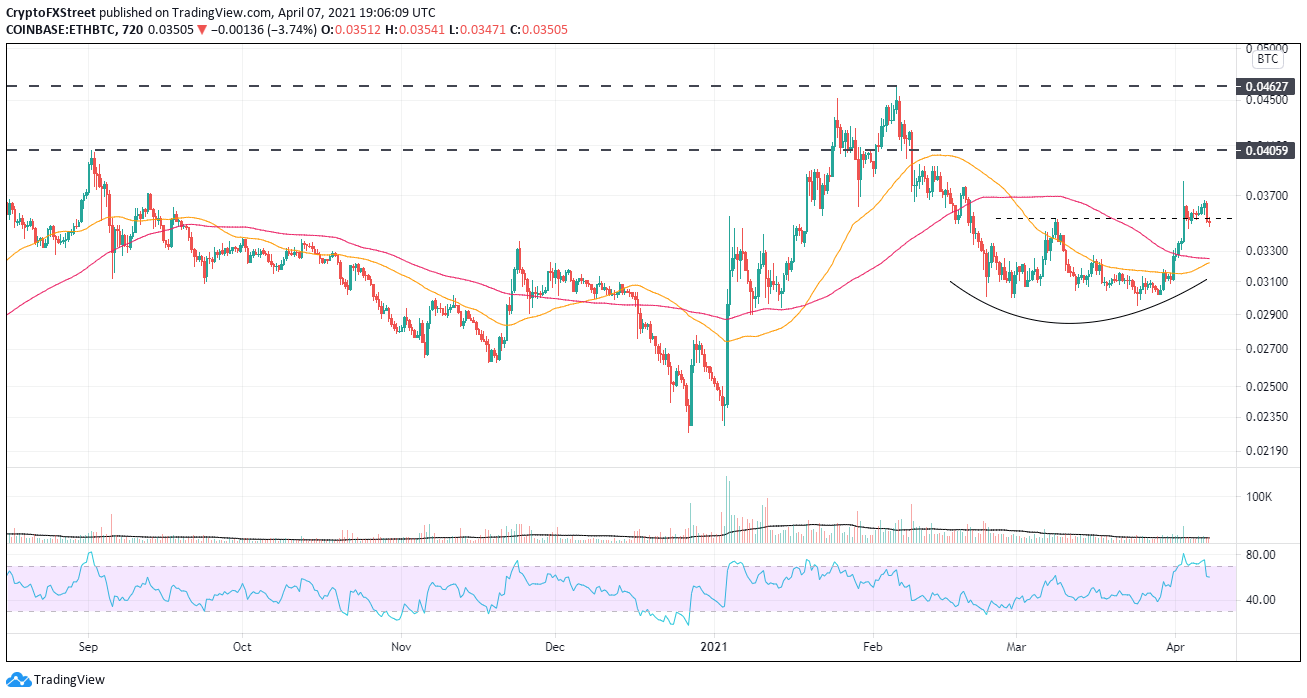
ETH/BTC 12-hour chart
If selling pressure accelerates, ETH should find support at the rising trend line of the triangle pattern. If price is unable to reach these levels, the March low at $1,545.77 will quickly be in play.
XRP price has awakened the bulls
It has been an explosive couple of days for Ripple as the digital token climbed 90% over the first three days of this week, and incredibly, it is the best 3-day gain since December 2017. The impulsive move in XRP, underpinned by positive developments in the SEC case against Ripple executives, has cleared the massive resistance area between $0.60 and $0.80 and tagged not only the 0.236 Fibonacci retracement of the 2018-2020 bear market but also the psychologically important $1.00.
A consolidation that oscillates around $1.00 is the ideal scenario, but a test of the breakout above $0.80 is a possibility. As long as XRP stays above support, the upside momentum should continue over the longer term, pending any bearish news in the SEC case.
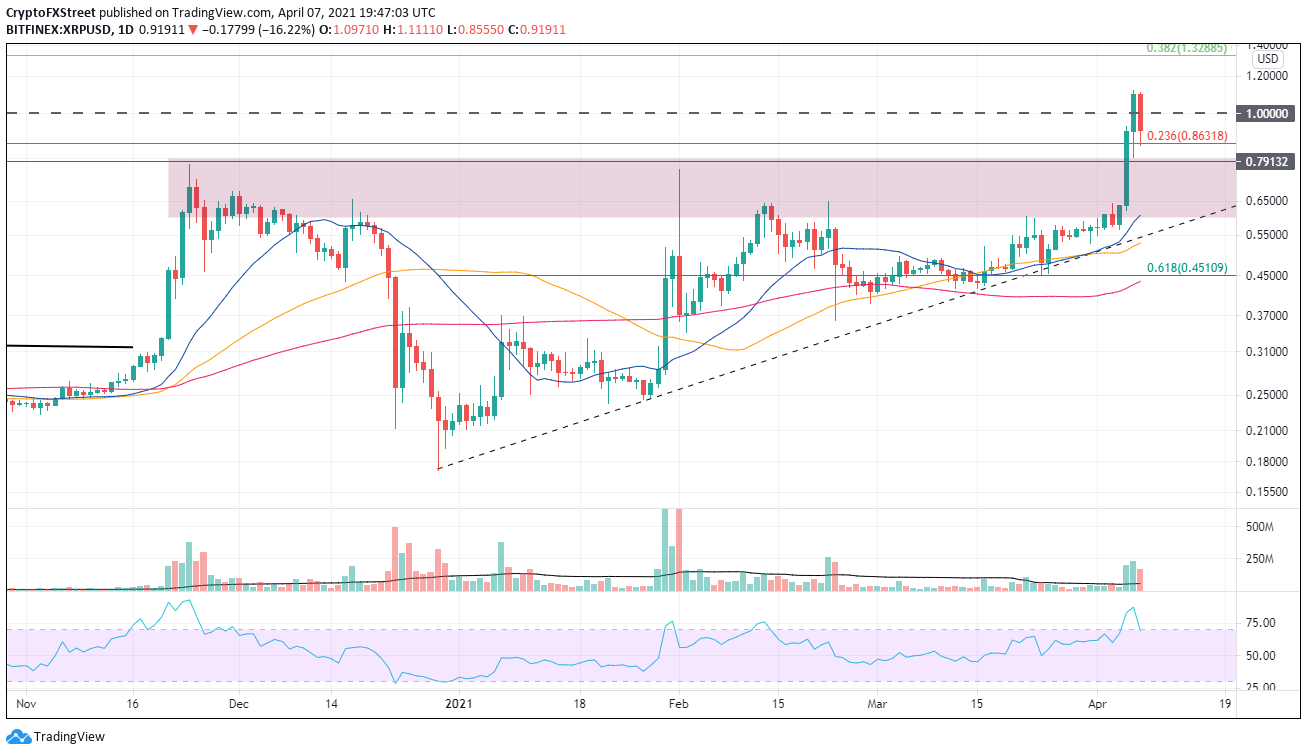
XRP/USD daily chart
If the SEC case turns sour and XRP plunges back into the $0.60-$0.80 range, all bets are off for the cross-border remittances token, and traders revert to trading the range.
Author

Sheldon McIntyre, CMT
Independent Analyst
Sheldon has 24 years of investment experience holding various positions in companies based in the United States and Chile. His core competencies include BRIC and G-10 equity markets, swing and position trading and technical analysis.