- Bitcoin price attempts to overcome the $30,711 hurdle after a 26% run-up.
- Ethereum price looks primed for a breakout that could trigger a minimum rally of 21% to $2,439.
- Ripple price continues to bounce between the $0.548 and $0.413 barriers, awaiting a breakout.
Bitcoin (BTC) price seems to be edging closer to ending its ongoing sideways movement. This development comes after BTC swept this week's lows, suggesting that a potential rally in the opposite direction is likely not just for the big crypto but also for Ethereum (ETH), Ripple (XRP) and other altcoins.
Read more: Coinbase slams SEC in new filing, argues regulator has no jurisdiction over cryptocurrencies on the exchange
Bitcoin price at inflection point
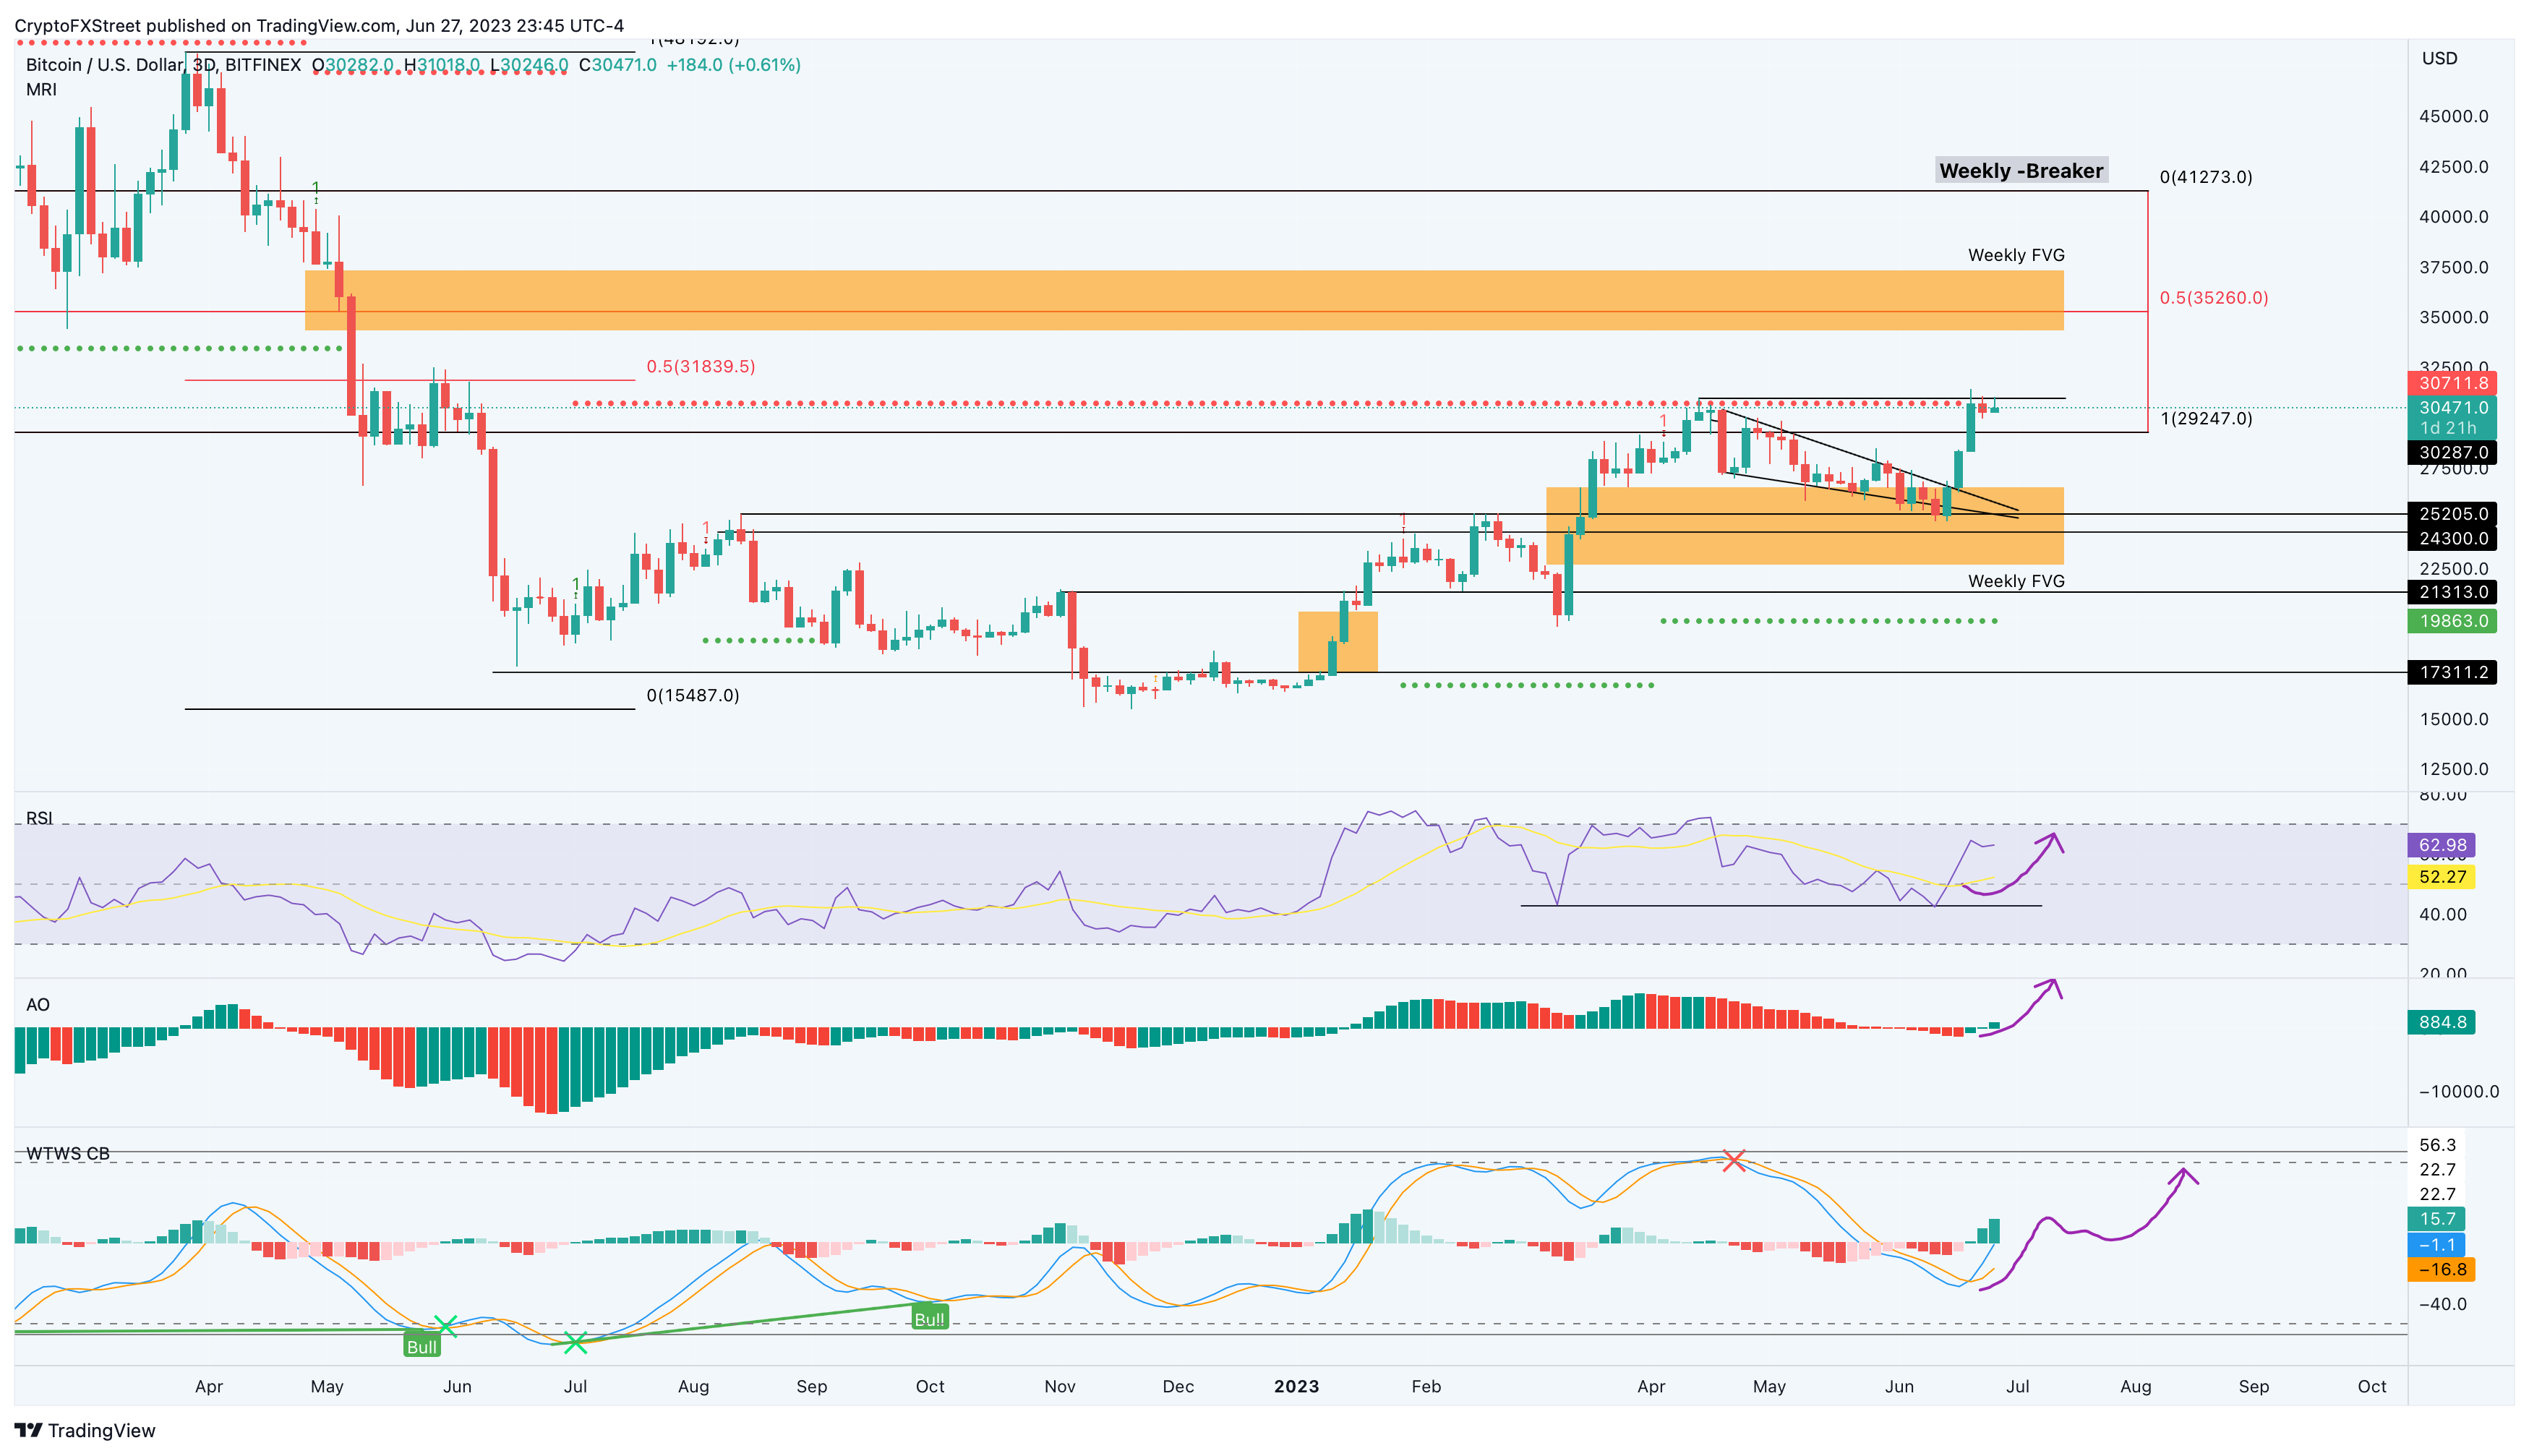
Bitcoin (BTC) price remains still after its 26% ascent since June 15. After its recent uptick, BTC has set up a new high at $31,430 after taking out the previous local top at $30,968. The Relative Strength Index (RSI) has flipped above the mean line at 50, and the Awesome Oscillator (AO) has produced a green histogram bar above the zero line. This development is a clear sign that bullish momentum is on the rise.
Therefore, a decisive three-day candlestick close above the Momentum Reversal Indicator’s (MRI) State Trend Resistance level at $30,711 will be a buy signal. A move after this flip will allow Bitcoin price to target the weekly Bearish Breaker’s midpoint at $35,260.
Although unlikely, if the bullish momentum continues to remain dominant, Bitcoin price could attempt a retest of the Bearish Breaker’s upper limit at $41,273.
BTC/USDT 3-day chart
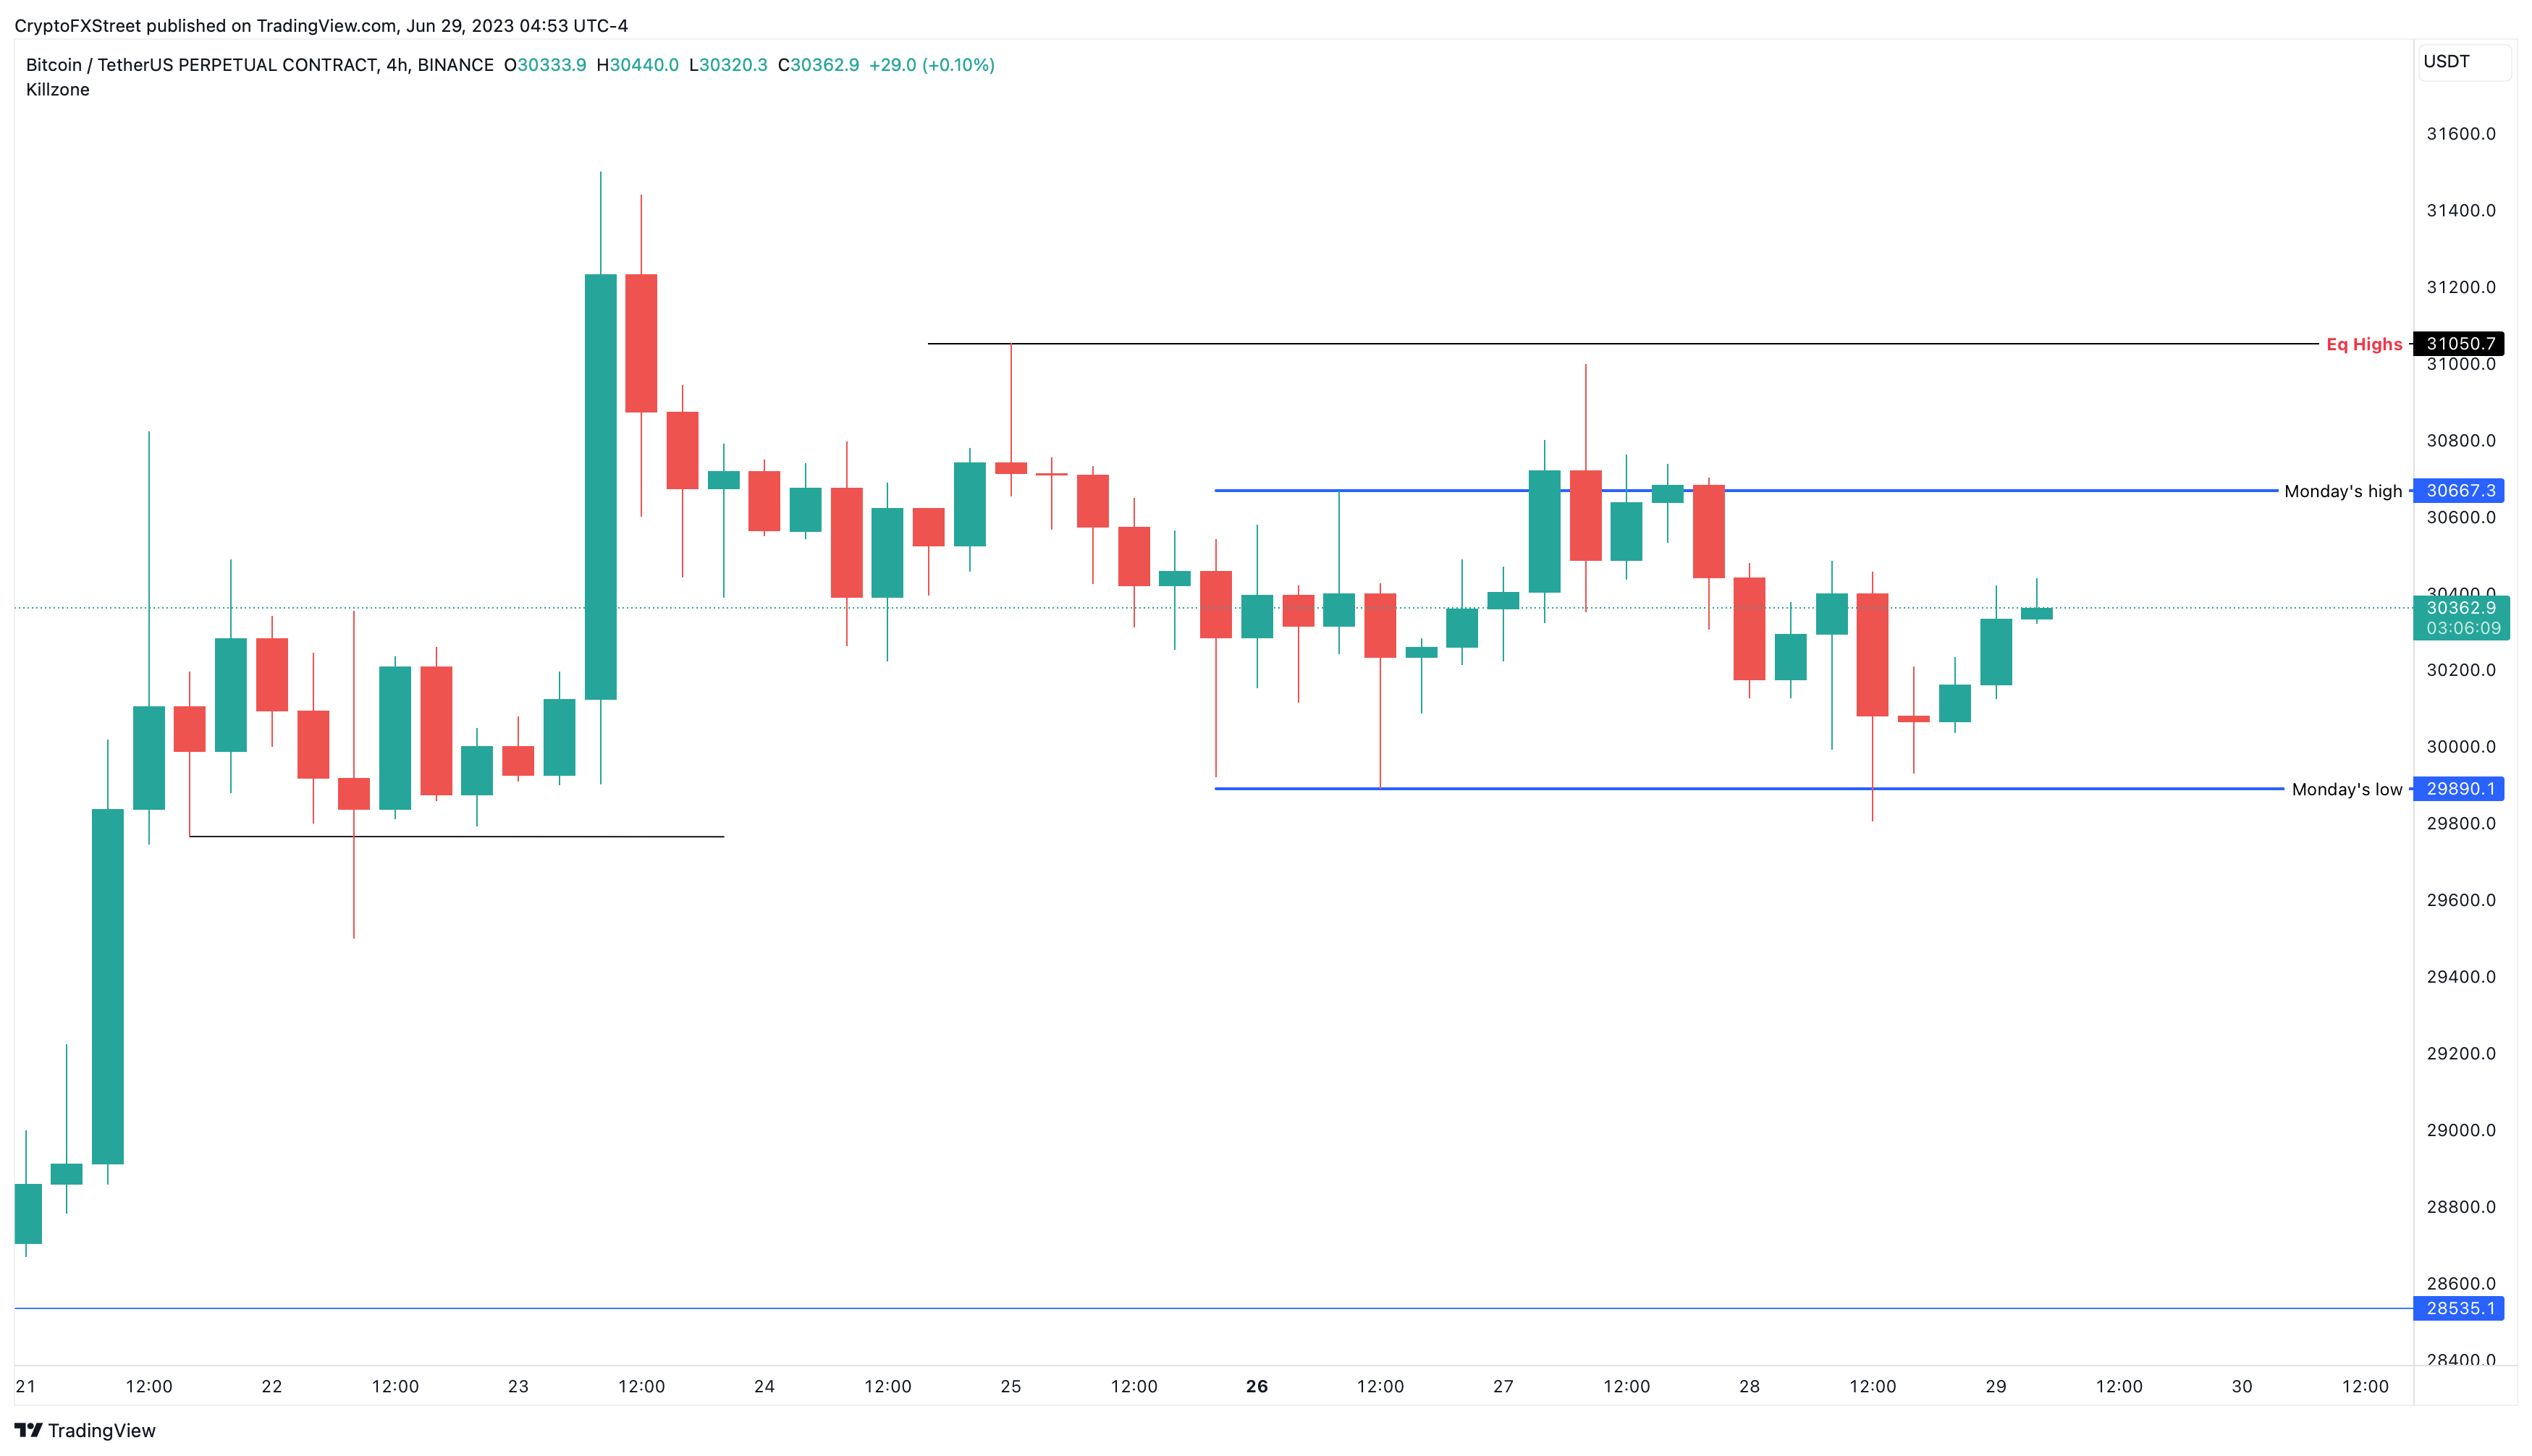
Additionally, the lower timeframe chart, as seen below, shows a much more nuanced outlook for Bitcoin price. On June 28, BTC swept Monday''s low at $29,890. The intention of this move was to collect the sell-side liquidity, which often signals a move in the opposite direction. Therefore, the next short-term target for Bitcoin price could be the equal highs at $31,050 followed by the June 23 swing high at $31,500.
BTC/USDT 4-hour chart
The bullish outlook for Bitcoin price makes sense considering the momentum indicators, but investors need to take a closer look at the RSI. While BTC has produced three higher highs since January, RSI has produced three lower highs. This setup is termed “bearish divergence” and often results in correction of the underlying asset.
Also read: Bitcoin holds above $30k as investors await historically strong July, eye options expiry
Ethereum price awaits buy signal
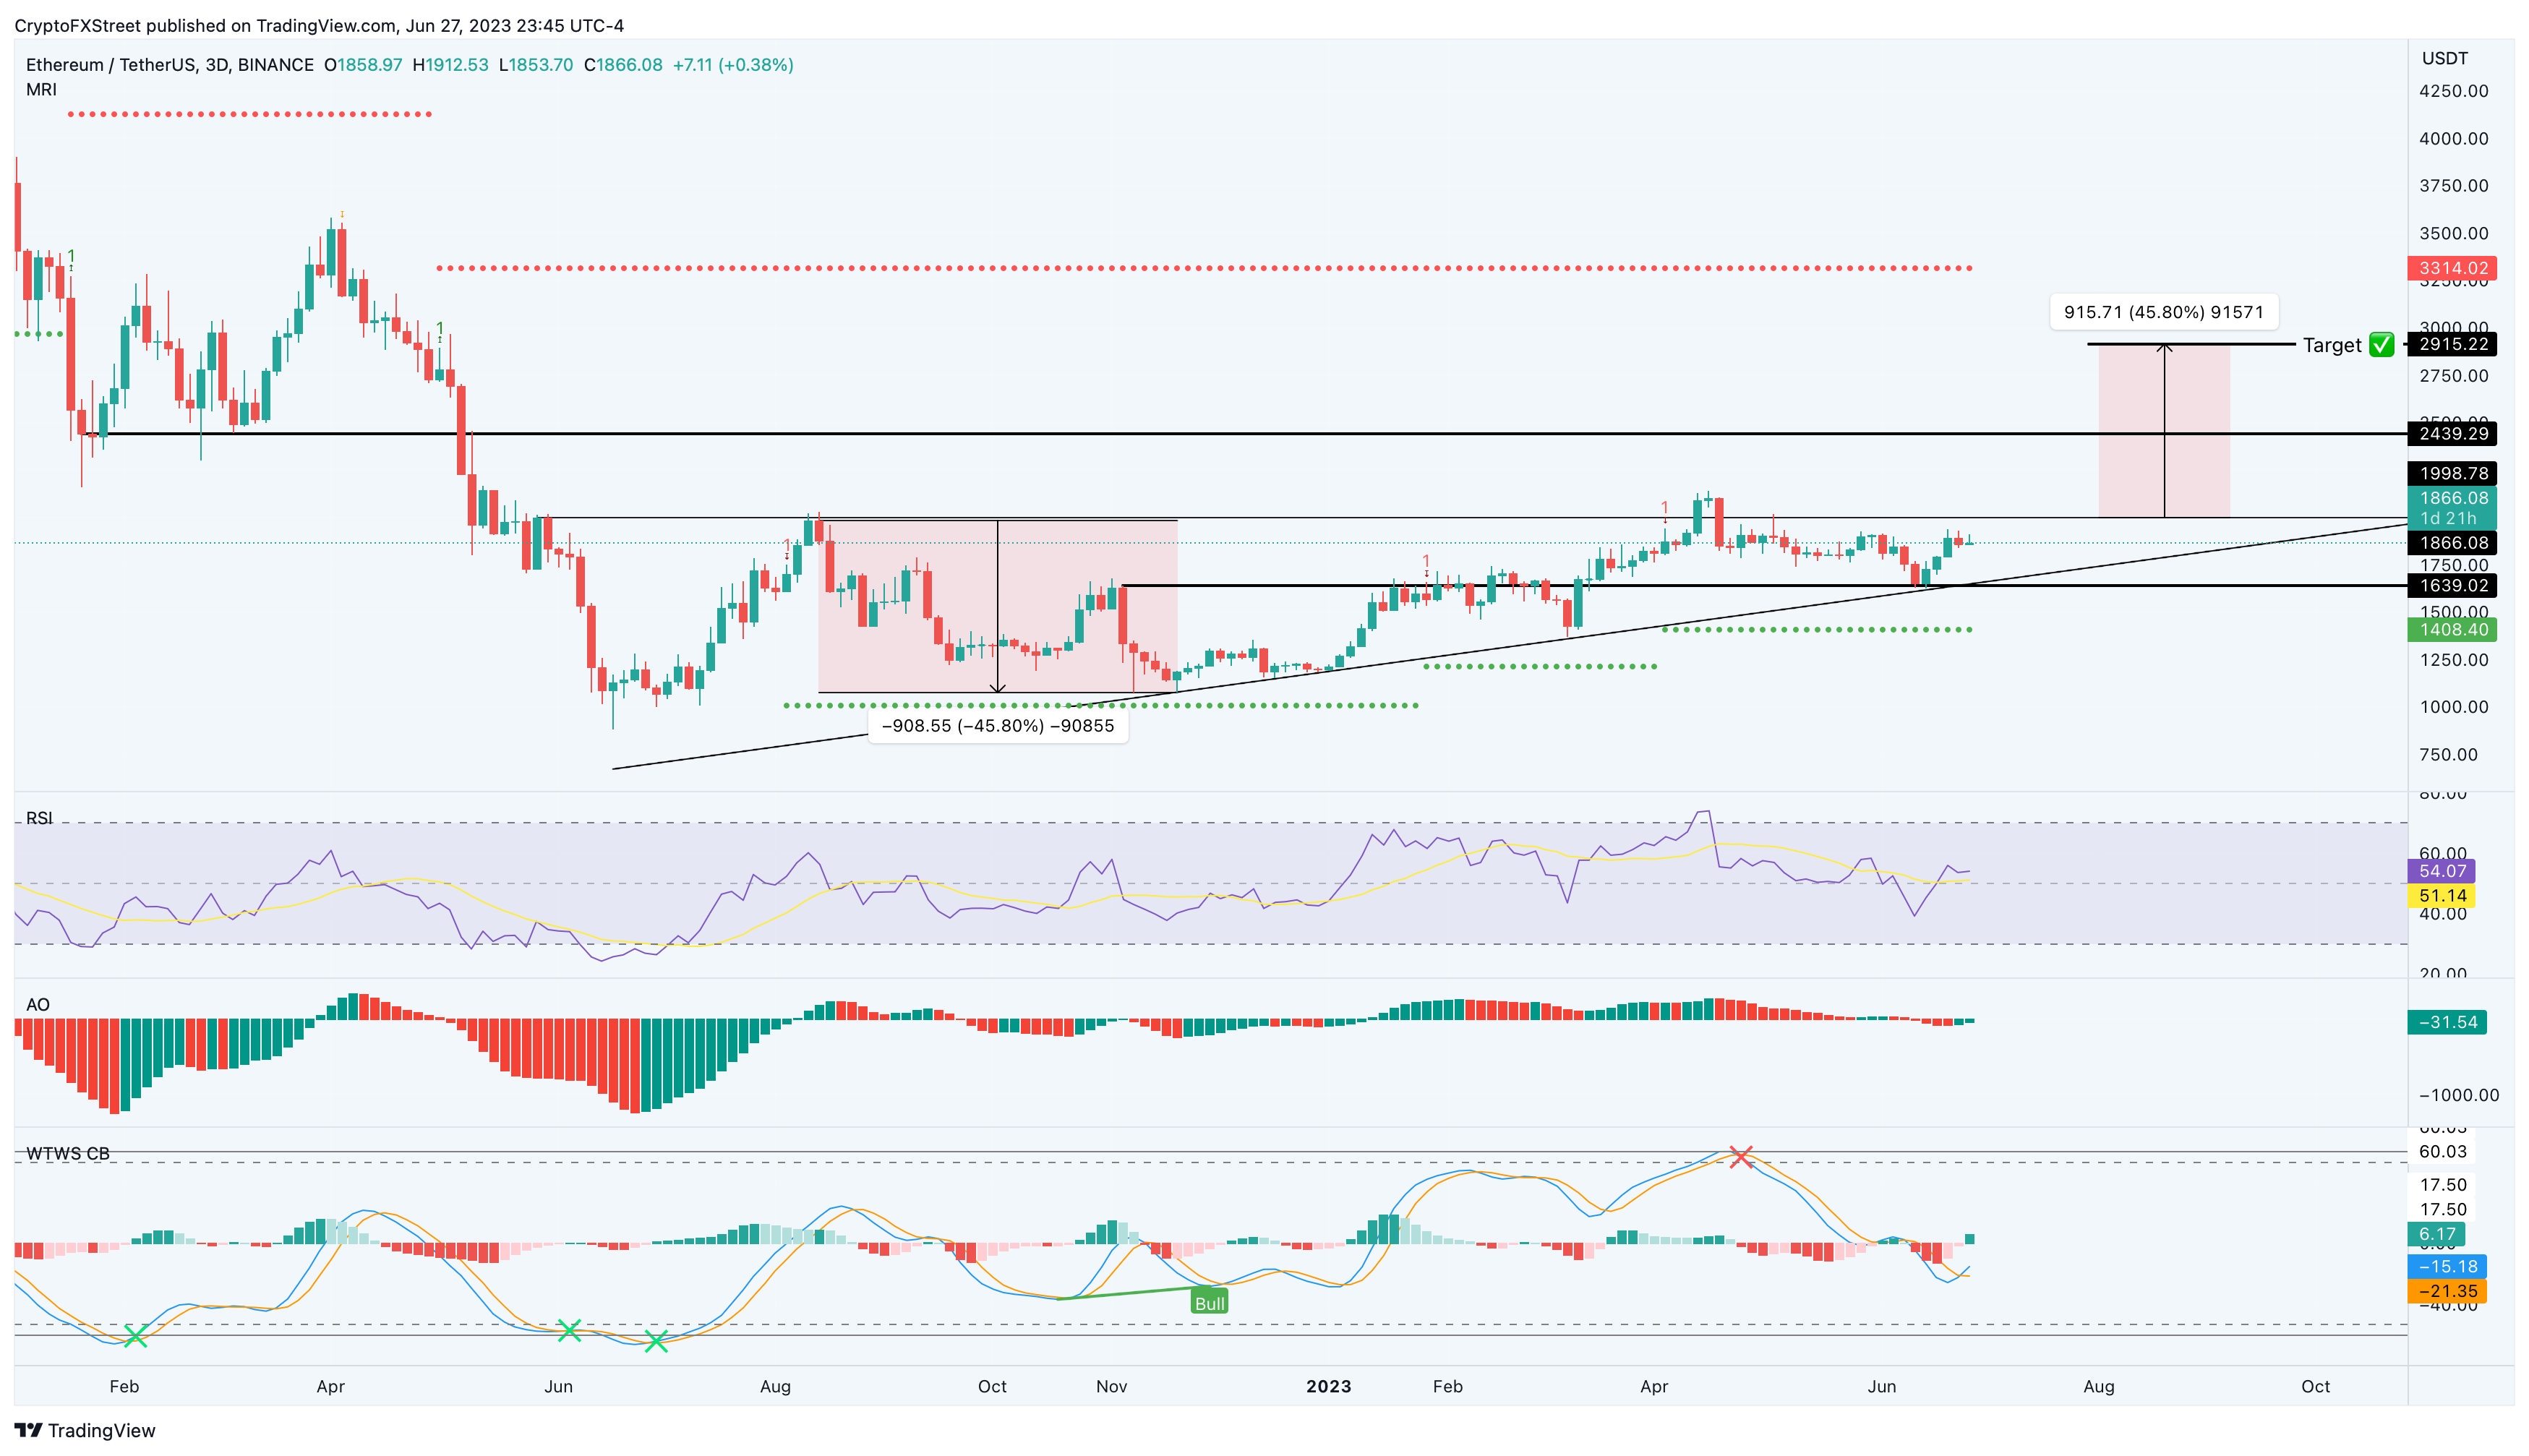
Ethereum (ETH) price looks extremely promising, not just from a technical point of view, but the indicators are also suggesting a bullish outlook. Between May 31, 2022, and June 28, 2023, ETH has set up an ascending triangle with roughly three equal highs and four higher lows.
This technical formation forecasts a 45% ascent to $2,915 upon the breakout of the $1,865 hurdle. The theoretical target is obtained by measuring the distance between the first swing high and swing low and adding it to the breakout point of the $1,865 resistance level.
Therefore, Ethereum price needs to produce a decisive flip of the aforementioned barrier to kickstart this massive bullish move.
Supporting this outlook are the RSI and AO indicators, both of which have moved above their respective mean lines - 50 and 0. This development signals a shift in momentum favoring the bulls. Furthermore, the Wave Trend indicator has produced a bullish crossover just above the oversold zone, adding credence to the bullish thesis.
Therefore, investors need to be patient as this is a long-term outlook that will take quite a while to play out.
ETH/USDT 3-day chart
On the other hand, if Ethereum price produces a decisive three-day candlestick close below $1,639, it will invalidate the ascending triangle’s bullish thesis. A further spike in selling pressure could trigger a near 15% descent to $1,408.
Ripple price needs clarity
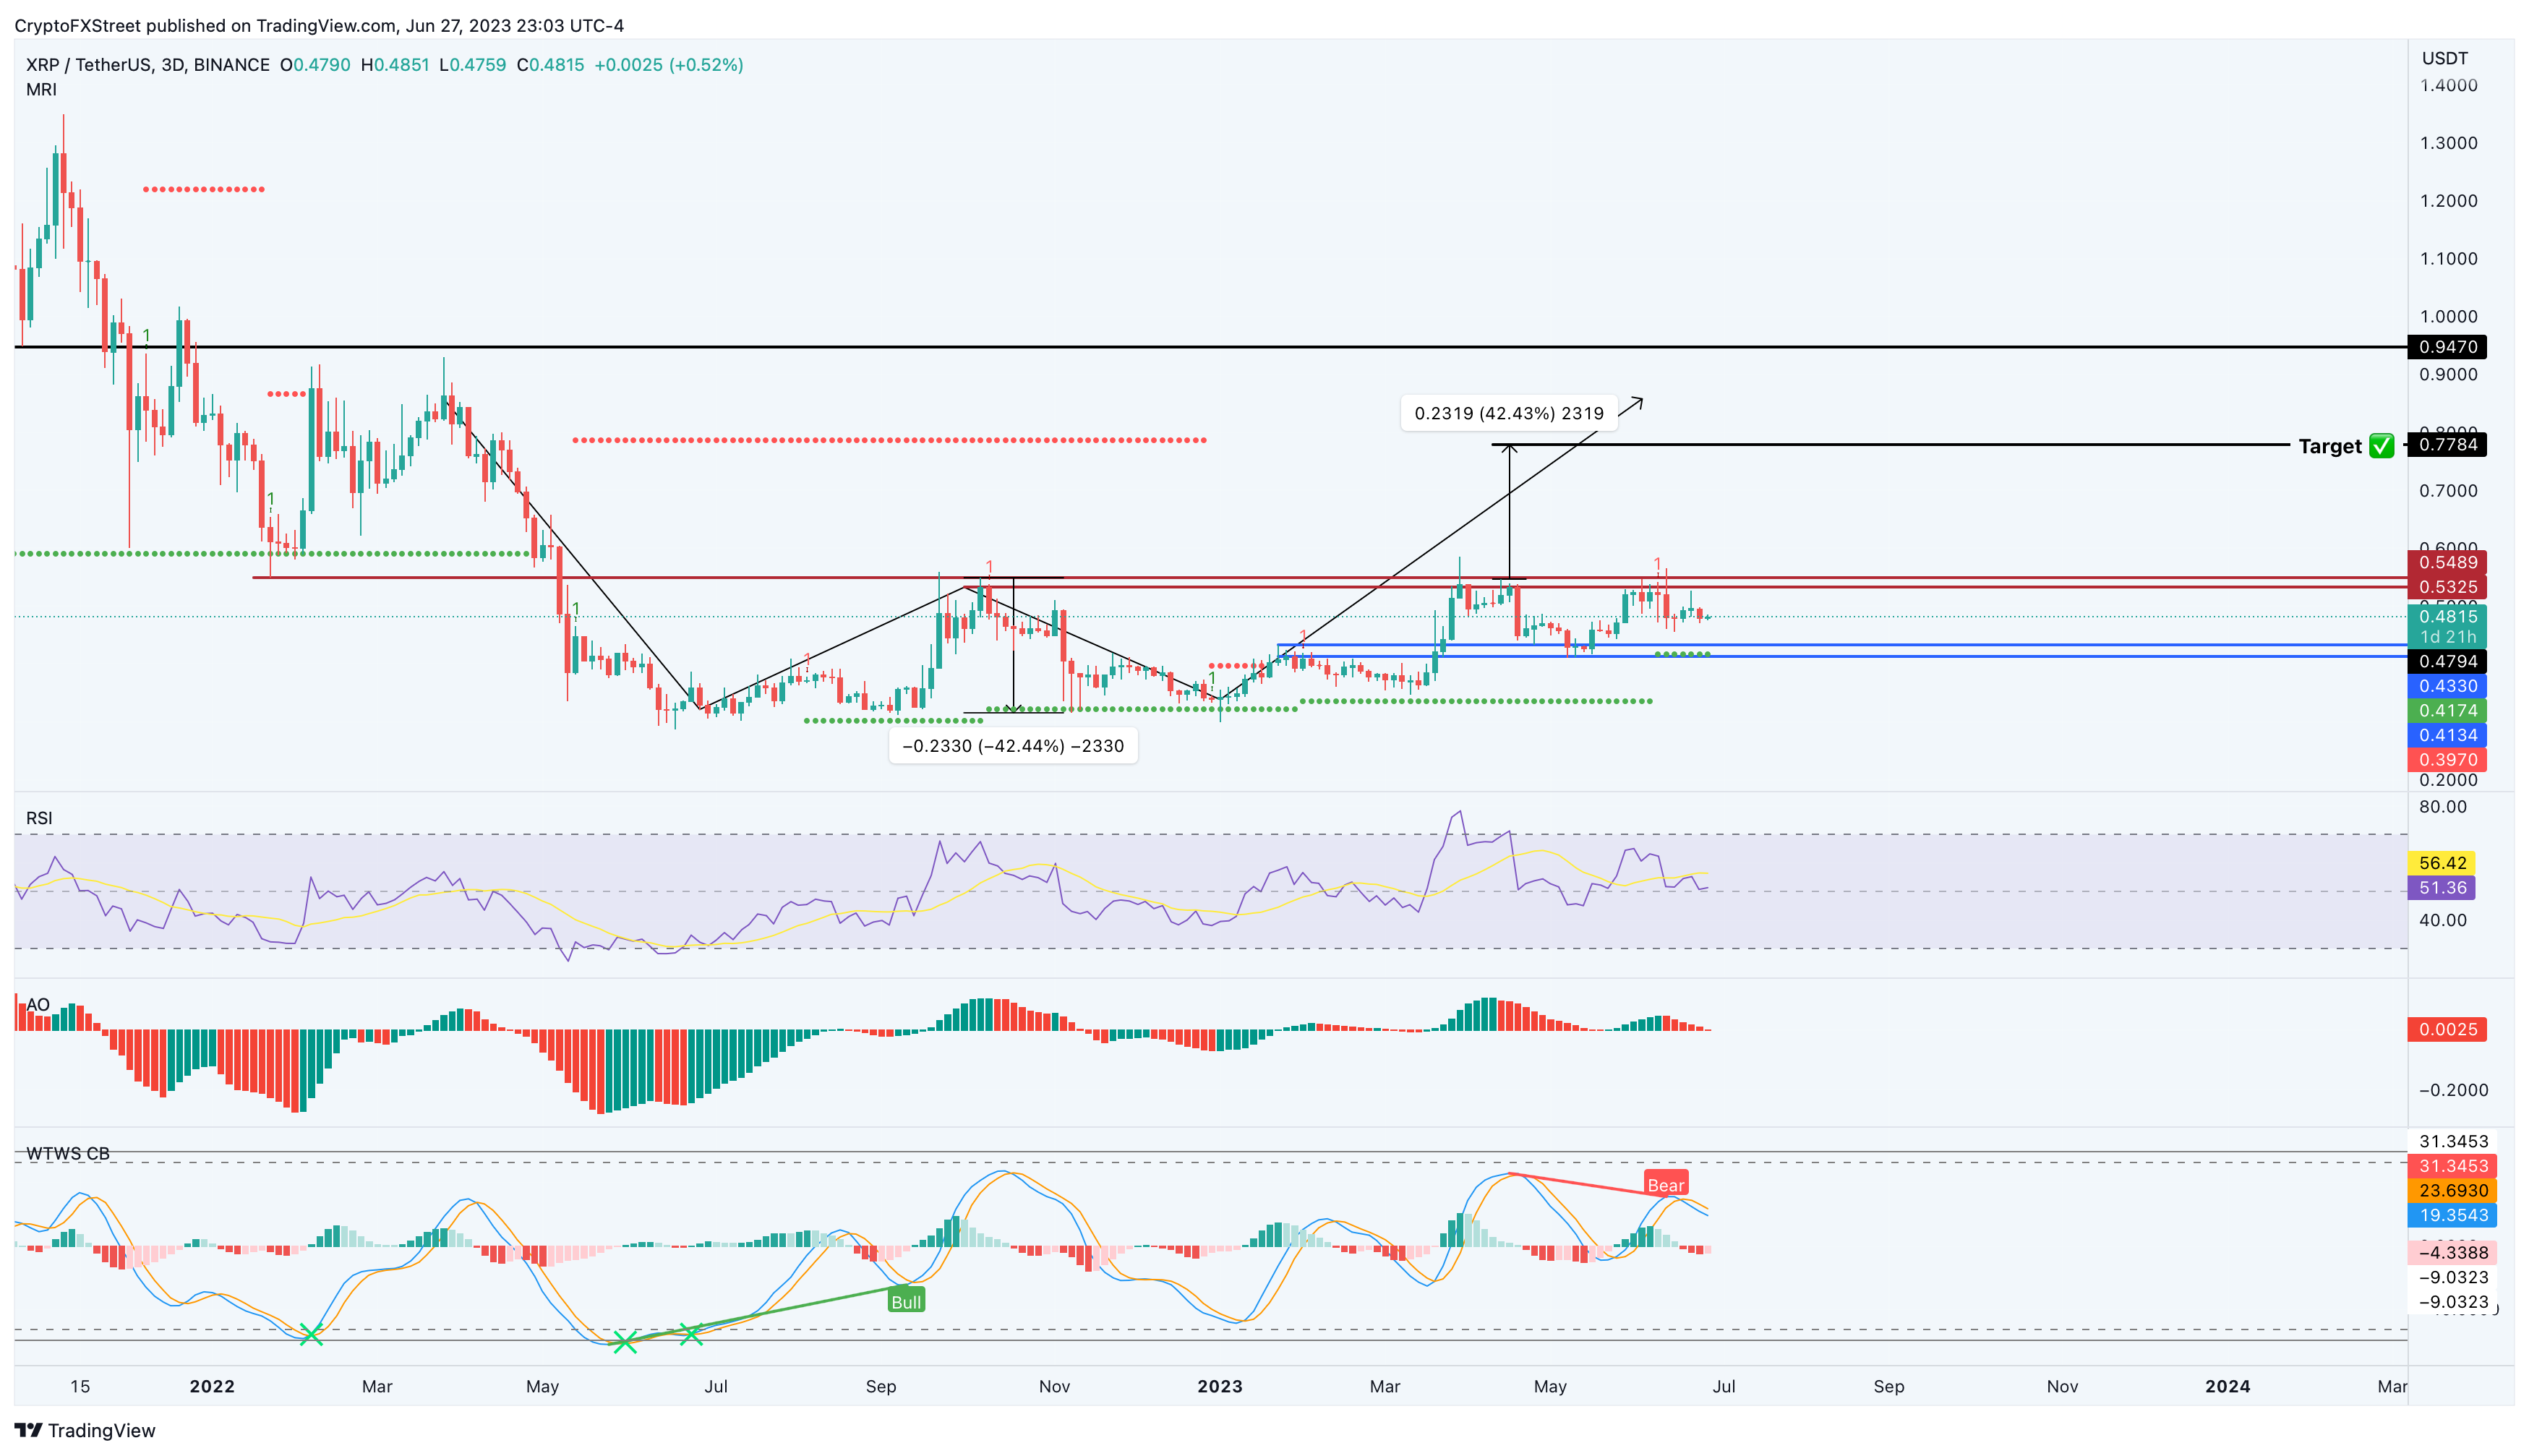
Ripple (XRP) price has been stuck trading between the $0.548 and $0.413 barriers since March 26. A decisive flip of the upper limit at $0.548 into a support floor would be a clear buy signal. In such a case, XRP could trigger a 40% ascent to $0.778, which is the target of the potential double bottom pattern, as shown in the chart below.
Interestingly, the aforementioned Ripple price target also coincides with MRI’s State Trend Resistance level, making it a key level to book profits.
XRP/USDT 3-day chart
While it is assumed that a breakout of $0.548 would lead to a Ripple price rally, investors need to take another look at the indicators. The RSI and AO indicators have produced clear lower lows, while the XRP price has produced equal highs. Such a setup is termed “exaggerated bearish divergence,” and it often leads to a steep correction for the underlying asset.
The Wave Trend indicator has also signaled a bearish divergence, aligning with the overall bearish outlook. Therefore, a pullback that breaks below the $0.413 support level will invalidate the bullish thesis. Such a move could result in a 17% correction to the next State Trend Support level at $0.334.
Also read: New evidence suggests SEC's common enterprise claim against Ripple doesn't hold, John Deaton says
Like this article? Help us with some feedback by answering this survey:
Information on these pages contains forward-looking statements that involve risks and uncertainties. Markets and instruments profiled on this page are for informational purposes only and should not in any way come across as a recommendation to buy or sell in these assets. You should do your own thorough research before making any investment decisions. FXStreet does not in any way guarantee that this information is free from mistakes, errors, or material misstatements. It also does not guarantee that this information is of a timely nature. Investing in Open Markets involves a great deal of risk, including the loss of all or a portion of your investment, as well as emotional distress. All risks, losses and costs associated with investing, including total loss of principal, are your responsibility. The views and opinions expressed in this article are those of the authors and do not necessarily reflect the official policy or position of FXStreet nor its advertisers. The author will not be held responsible for information that is found at the end of links posted on this page.
If not otherwise explicitly mentioned in the body of the article, at the time of writing, the author has no position in any stock mentioned in this article and no business relationship with any company mentioned. The author has not received compensation for writing this article, other than from FXStreet.
FXStreet and the author do not provide personalized recommendations. The author makes no representations as to the accuracy, completeness, or suitability of this information. FXStreet and the author will not be liable for any errors, omissions or any losses, injuries or damages arising from this information and its display or use. Errors and omissions excepted.
The author and FXStreet are not registered investment advisors and nothing in this article is intended to be investment advice.
Recommended Content
Editors’ Picks

Dogecoin and Bitcoin Cash Price Prediction: Funding rates decrease indicate weakness in DOGE and BCH
Dogecoin and Bitcoin Cash registered 3% and 8% losses on Tuesday following increased selling pressure from the futures market. The decline comes amid large-cap cryptos like Bitcoin, Ether and XRP, holding still with slight gains.

XRP could sustain rally amid growing ETF and SEC vote prospects
Ripple flaunted a bullish outlook, trading at $2.1505 on Tuesday. Investor risk appetite has continued to grow since the middle of last week, propping XRP for a sustainable upward move triggered by the swift decision by US President Donald Trump to suspend reciprocal tariffs for 90 days.

VeChain Price Forecast: VET bulls aim for a double-digit rally
VeChain price hovers around $0.023 on Tuesday after breaking above a falling wedge pattern the previous day; a breakout of this pattern favors the bulls. Bybit announced on Monday that VET would be listed on its exchange. Moreover, the technical outlook suggests rallying ahead, targeting double-digit gains.
Dogecoin, Shiba Inu and Fartcoin price prediction if Bitcoin crosses $100K this week
The meme coin market fell sharply on Monday, shedding 4.8% in market capitalization to settle at $49.25 billion, according to data compiled from CoinGecko. The sell-off coincided with increased volatility across broader crypto markets while investors rotated funds into Bitcoin briefly tested $85,000.

Bitcoin Weekly Forecast: Market uncertainty lingers, Trump’s 90-day tariff pause sparks modest recovery
Bitcoin (BTC) price extends recovery to around $82,500 on Friday after dumping to a new year-to-date low of $74,508 to start the week. Market uncertainty remains high, leading to a massive shakeout, with total liquidations hitting $2.18 billion across crypto markets.

The Best brokers to trade EUR/USD
SPONSORED Discover the top brokers for trading EUR/USD in 2025. Our list features brokers with competitive spreads, fast execution, and powerful platforms. Whether you're a beginner or an expert, find the right partner to navigate the dynamic Forex market.