Top 3 Price Prediction Bitcoin, Ethereum, Ripple: BTC defends $40,000 as spot ETF marketing wars heat up
- Bitcoin price could rise 10% to the three-day supply zone if the $40,000 psychological level holds as support.
- Ethereum price defending the critical support at $2,147 could precipitate a 7% climb to $2,293.
- Ripple price could scale a recovery, with 12% gains in the cards for XRP as downward support grows.

Bitcoin (BTC) price has shown weakness over the past few days, in what has been presented as a cool-off following weeks of being overbought. The lull extended to Ethereum (ETH) price as well as Ripple (XRP) price as markets ready for the final weeks of 2023.
Also Read: Bitcoin cool-off prepares markets for crypto’s final two weeks of 2023
Bitcoin price could push north amid intensifying spot ETF wars
Bitcoin (BTC) price is attempting a recovery, coming on the back of intensifying spot exchange-traded funds (ETFs) wars. It comes after reports that Bitwise and BlackRock continue to fuel Bitcoin ETF approval hopes amid ongoing meetings with the US Securities and Exchange Commission.
Marketing wars are already heating up — we don’t even have approvals yet https://t.co/VDWqQs6tn3
— James Seyffart (@JSeyff) December 18, 2023
With the $40,000 psychological level holding as support, Bitcoin price could push north to confront the three-day supply zone stretching between $44,074 and $47,488. A three-day candlestick close above the mean threshold (midline) of this order block would confirm the continuation of the uptrend. Such a move would constitute a 10% move north above current levels.
Increased buying pressure, enough to flip the supply zone into a bullish breaker above the $48,000 level, would set the tone for Bitcoin price to test the $50,000 psychological level. In a highly bullish thesis, the king of cryptocurrency could extend even higher to reclaim the November 2021 highs above $69,000.
Technical indicators support the bullish outlook, with the Relative Strength Index (RSI) deviating away from a southbound movement after being subdued. This, coupled with the Awesome Oscillators (AO) and the Moving Average Convergence Divergence (MACD) which are still in the positive territory, show that the bulls maintain a presence in the BTC market, thereby accentuating the bullish outlook.
BTC/USDT 3-day chart
On the flipside, if he supply zone holds as a resistance block, Bitcoin price could extend the fall. A three-day candlestick close below $37,800 would invalidate the overall bullish outlook.
Also Read: Bitcoin price dips below $41,000 on Monday amidst BTC transaction fee surge
Ethereum price defends the $2,147 support
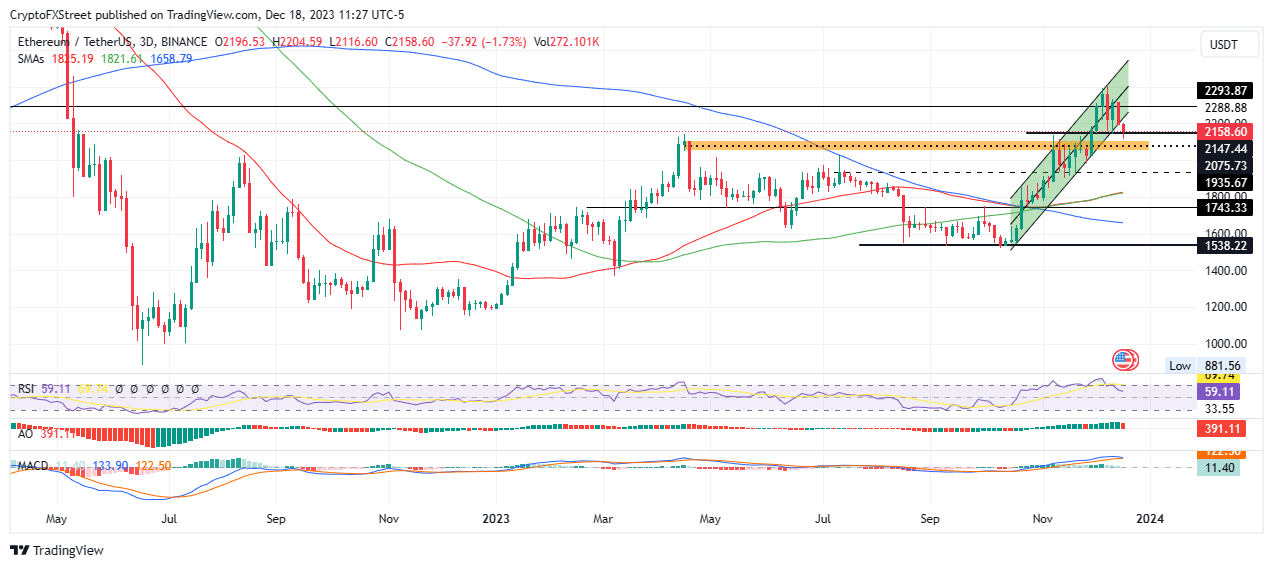
Ethereum is defending the critical support at $2,147, a line of defense that if held, could precipitate a 7% climb to $2,293.
Like in the case of BTC, the RSI is also showing strength as more bulls flock the scene, with both the AO and MACD holding in the positive territory. Should this sustain, Ethereum price could soon fall back into the cover of the ascending parallel channel, within which the uptrend would be restored.
ETH/USDT 3-day chart
On the flip side, enhanced seller momentum could see Ethereum price extend the fall, testing the mid-April supply zone that now acts as a bullish breaker. A break and close below its midline at $2,075 on the three-day timeframe would confirm the extension of the fall.
Increased selling pressure could see Ethereum price test the $1,935 support. A decisive candlestick close below this level would invalidate the bullish outlook.
Ripple price could recover amid mounting support
Ripple (XRP) price could pivot around the confluence between the 50-day Simple Moving Average (SMA) and the horizontal line at $0.5573 to scale a recovery rally after an 18% rejection from the November 6 supply zone extending from $0.6447 to $0.6885 on the three-day timeframe.
A decisive move above the midline of this order block at $0.6678 would confirm the uptrend, setting the pace for XRP price to confront the $0.7333.
Shattering the aforementioned barricade would send Ripple price into the July supply zone stretching from $0.7322 to $0.7990. To confirm the continuation of the trend, the price must record a three-day candlestick close above its midline at $0.7667.
XRP/USDT 3-day chart
On the other hand, the RSI remains subdued to the downside, pointing to falling momentum. If the sellers have their say, Ripple price could extend the fall, invalidating the bullish thesis by closing below the $0.5773 support.
In the dire case, the fall could extend for Ripple price to flip the 100-day SMA into a support at $0.5306. Worse, an extended move south could see XRP price test the support floor at $0.4595.
Also Read: XRP price risks 7% fall as Ripple lawyer names ‘the single biggest threat to crypto in the US’
(this article was corrected on December 18 at 20:53 GMT to say, in the third paragraph of the Bitcoin Technical Analysis section, that if the buying pressure increases, not selling pressure.)
Author

Lockridge Okoth
FXStreet
Lockridge is a believer in the transformative power of crypto and the blockchain industry.


