Top 3 Price Prediction Bitcoin, Ethereum, Ripple: BTC continues to lead pack as crypto market recovers
- Bitcoin price looks ready to trigger a 15% rally after a minor retracement.
- Ethereum price seems to be forming a higher low, which could lead to a potential retest of $2,319.
- Ripple price needs to reclaim range low at $0.65 to trigger a 20% upswing to $0.783.

Bitcoin price took a massive nosedive as it dropped from a level of support to create a new range low.
While the initial sell-off seems to be done, BTC is preparing for a leg up. The same trend is seen across Ethereum, Ripple and multiple altcoins, which are ready to make a comeback.
Bitcoin price prepares to sweep swing highs
Bitcoin price rallied 21% after a nasty 20% drawdown between June 20 and June 22. The recovery faced rejection at $34,800 and is currently undergoing a retracement. This pullback could extend up to $31,000 and set the stage for a 15% upswing to sweep above the 50% Fibonacci retracement level at $35,610.
In a bullish case, the rally could extend to $37,331.
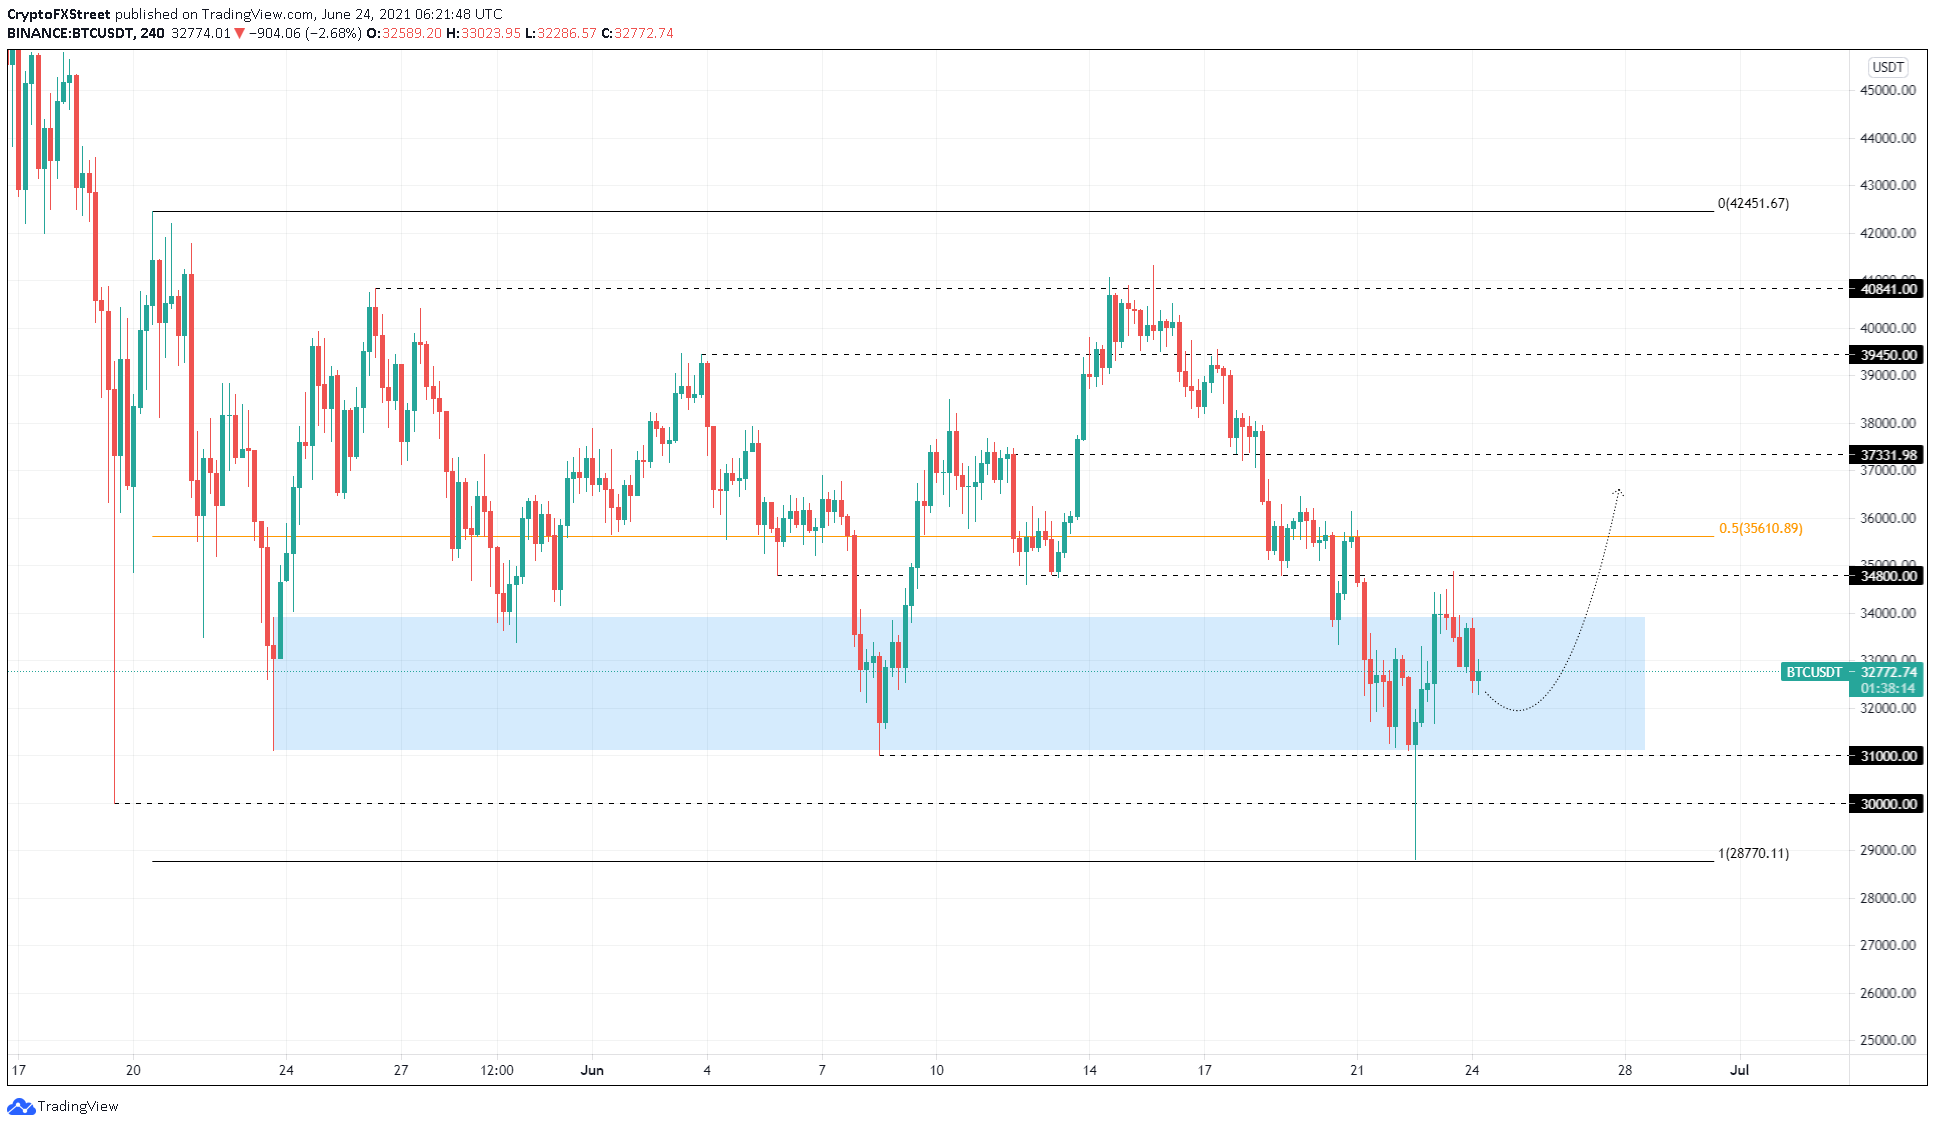
BTC/USDT 4-hour chart
On the flip side, if Bitcoin price slices through $31,000 and fails to recuperate, it will invalidate the bullish thesis.
In such a case, the flagship cryptocurrency could retrace 3% to $30,000. On the other hand, if the sellers continue to apply pressure, BTC might slide to $28,770– the range low.
Ethereum price promptly follows the pioneer cryptocurrency
While Bitcoin price created a new swing low, Ethereum price did the same. ETH sliced through the previous range low at $1,728, to set up a new one at 1,700.
The recuperation rally pierced through the 79% Fibonacci retracement level at $1,976 but failed to hold above it. Therefore, investors can expect the second attempt to shatter $1,976 and take a jab at the 70.5% and 62% Fibonacci retracement levels at $2,077 and $2,177, respectively.
Surpassing these critical barriers might allow the bulls to push ETH to the 50% Fibonacci retracement level at $2,319.
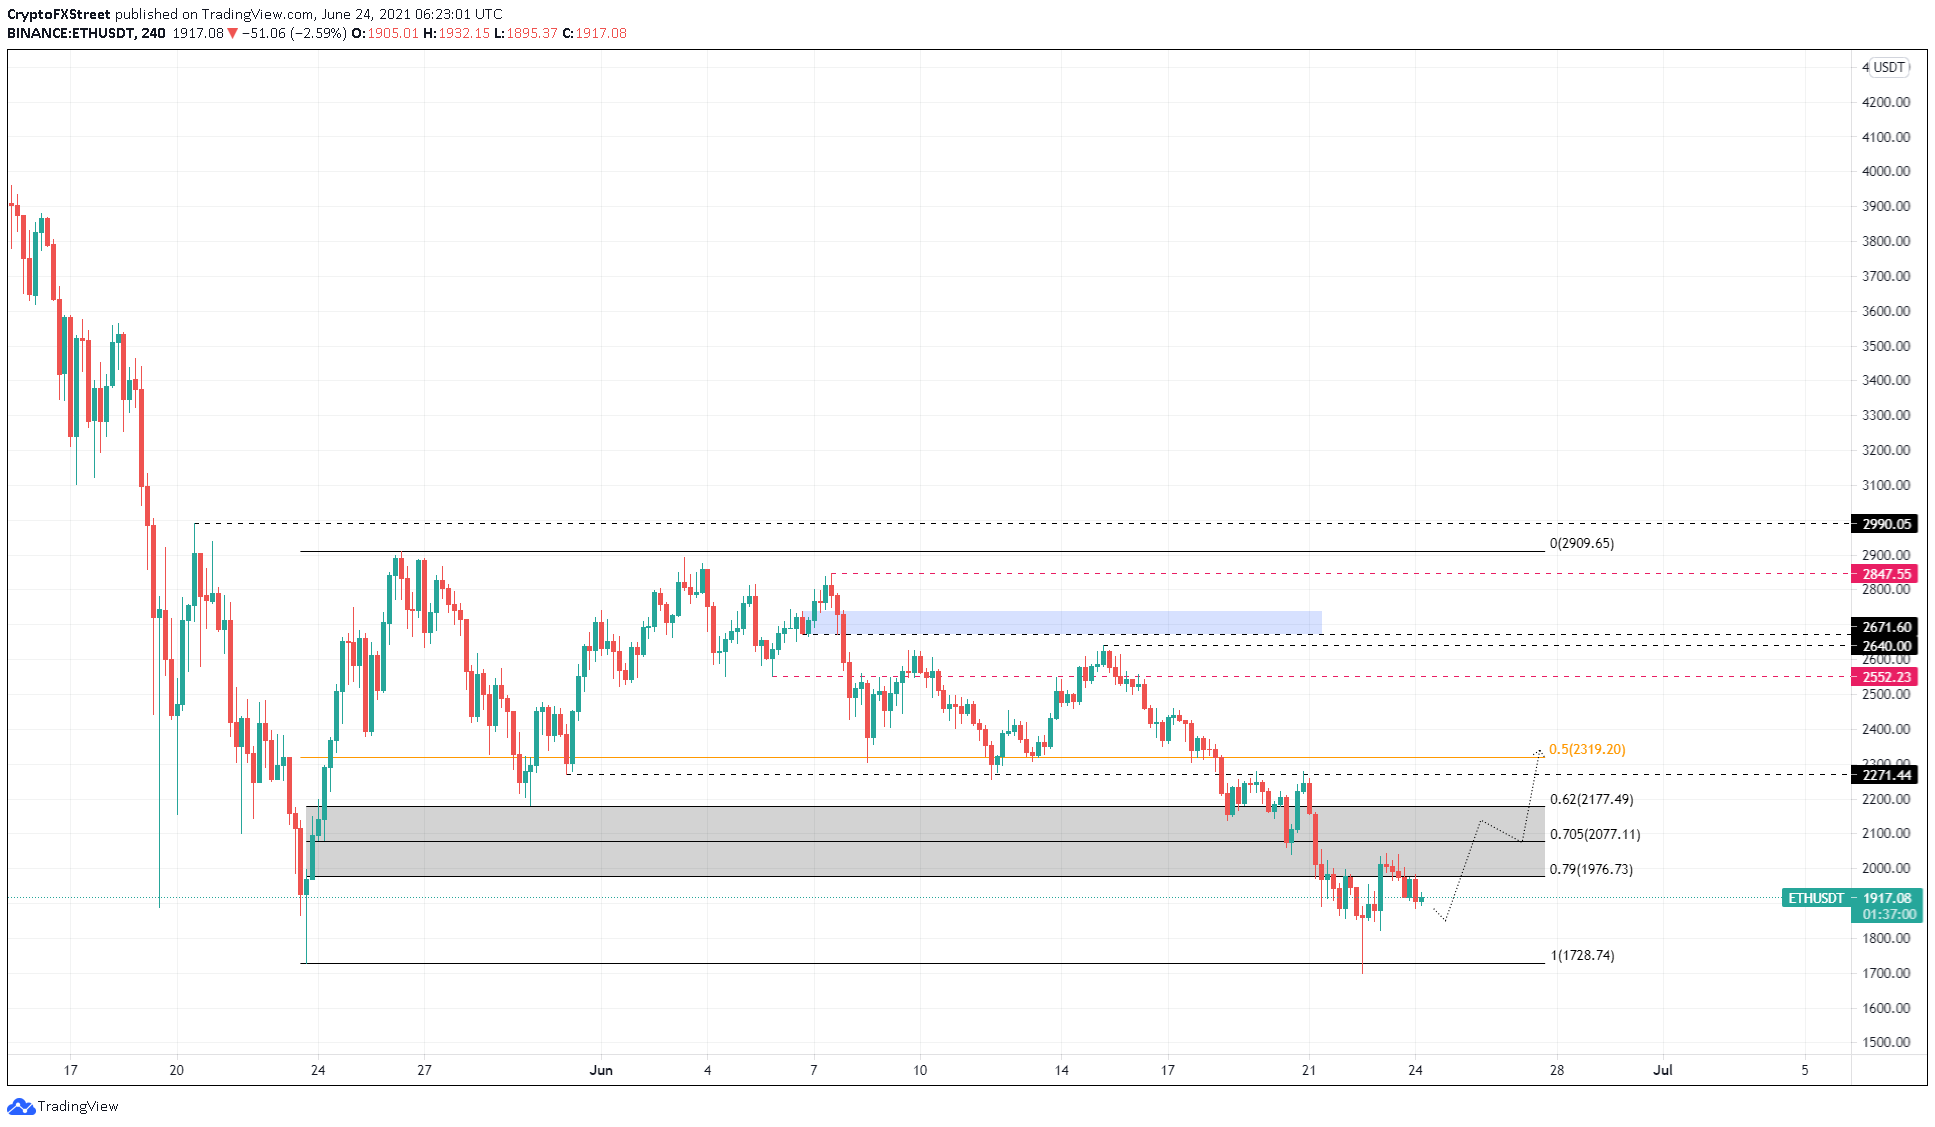
ETH/USDT 4-hour chart
Regardless of the bullishness Ethereum price exudes, if Bitcoin price fails to go higher, the same moves will be reflected in ETH. Therefore, investors need to pay close attention to the levels mentioned for BTC.
A breakdown of the swing low on June 23 at $1,821 will invalidate the bullish scenario and kick-start a sell-off to the range low at $1,700.
Ripple price ready for move higher
Ripple price dropped 35% between June 20 and June 22, but its recovery is equally swift and is currently knocking on a crucial resistance level at $0.65. If XRP price manages to shatter this barrier and flip it into a support barrier, it will signal the start of an uptrend.
In such a case, investors can expect Ripple price to quickly climb 15% to retest the 79% Fibonacci retracement level at $0.745.
Following a breach of this demand barrier, if the buying pressure persists, the bulls might target $0.783 and $.821. However, the likely scenario here would be tight consolidation.
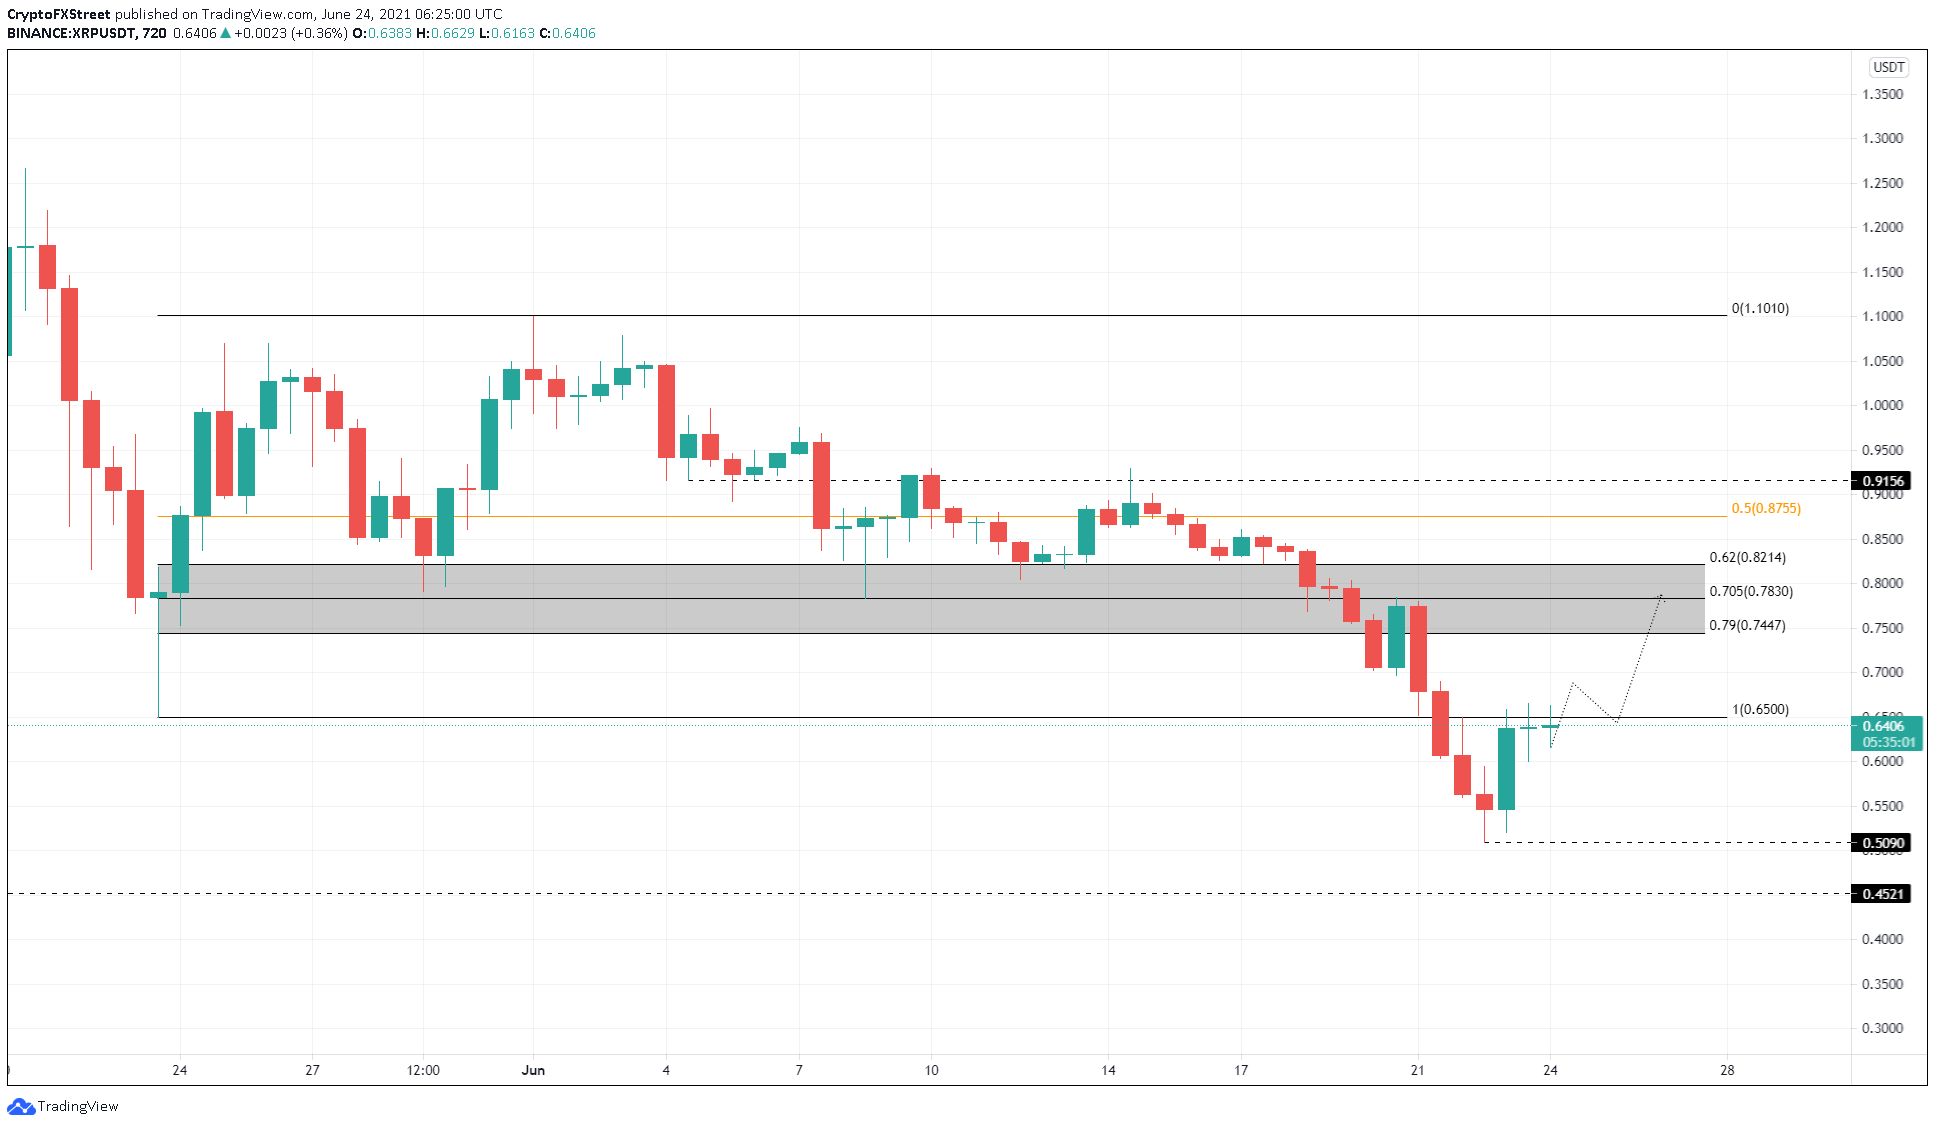
XRP/USDT 12-hour chart
On the other hand, if XRP price fails to climb above $0.65, it will display the buyers’ weakness. In such a case, the remittance token might take a nosedive to $0.509, the recent swing low on June 22.
However, if bears continue to push XRP price lower, leading to a decisive 12-hour candlestick close below $0.509, it will invalidate the optimistic narrative.
In that case, Ripple might crash 11% toward the support barrier at $0.452.
Author

Akash Girimath
FXStreet
Akash Girimath is a Mechanical Engineer interested in the chaos of the financial markets. Trying to make sense of this convoluted yet fascinating space, he switched his engineering job to become a crypto reporter and analyst.


