- Bitcoin tested $58,375 support on Monday and currently trades at $61,996 on Wednesday.
- Ethereum retested the $3,288 support level on Monday and is now near $3,407 on Wednesday.
- Ripple price faces stiff resistance at $0.500.
Bitcoin tested crucial support on Monday, rebounding by 5.8%. Ethereum followed a similar pattern, retesting support on Monday and gaining 4.8% by Wednesday. Ripple trades below its daily resistance level of $0.50 but has shown resilience despite Bitcoin's decline.
Bitcoin price looks promising
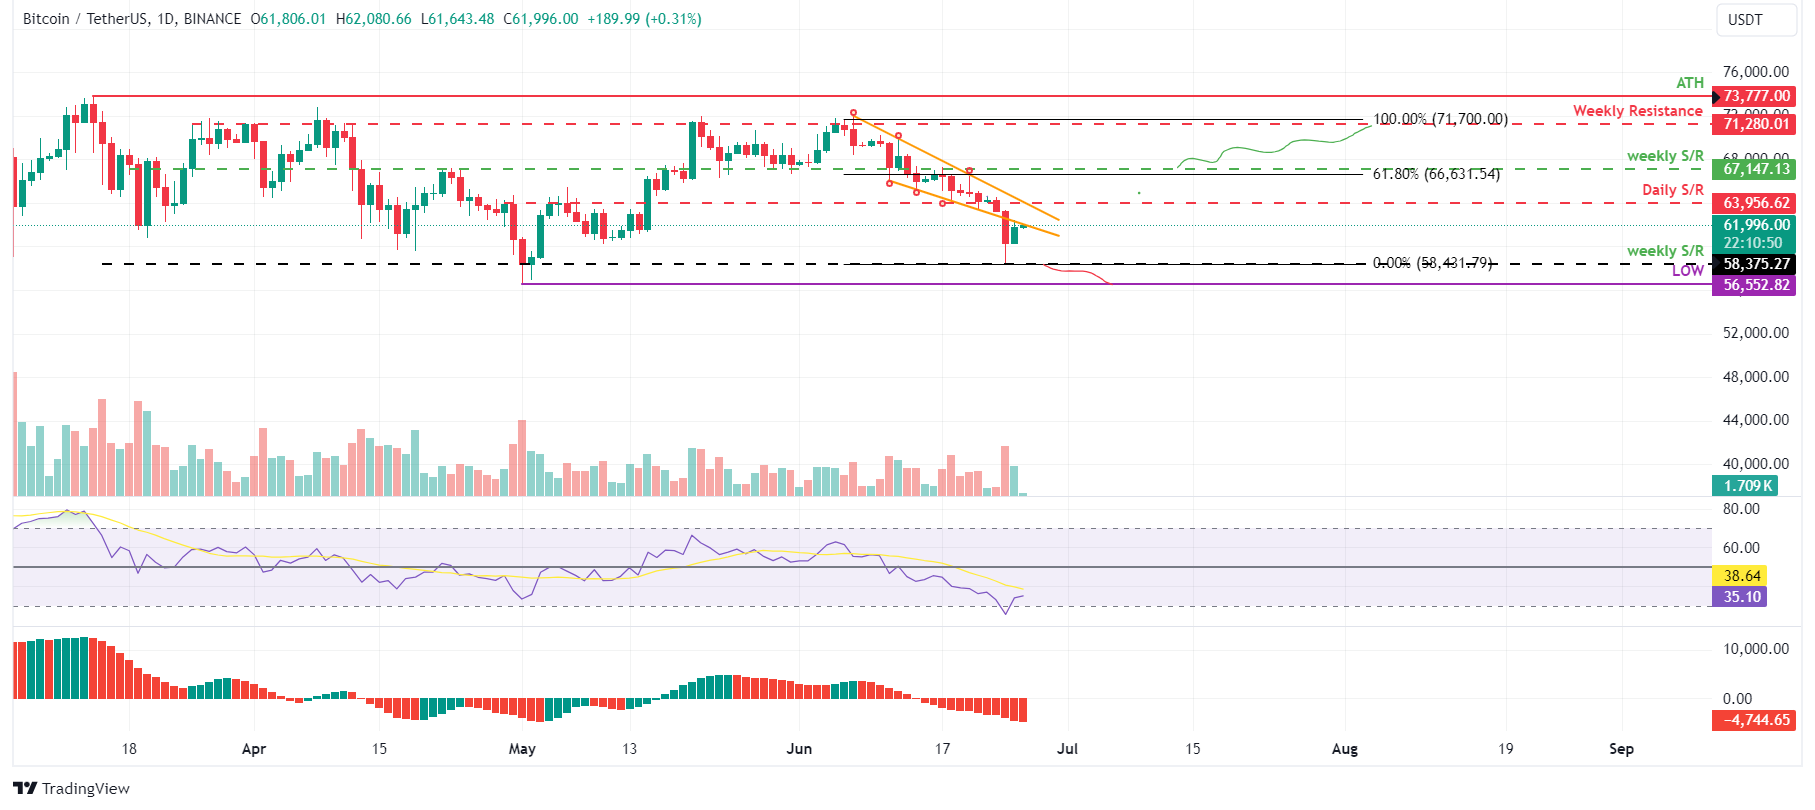
Bitcoin's price broke below the descending wedge on Monday, declining approximately 7.5% from its daily high of $63,369 to a low of $58,402. After retesting its crucial weekly support near $58,375, BTC rebounded by 5.8% from Monday's low of $58,402, closing at $61,806 on Tuesday. BTC trades at around $61,996 at the time of writing, edging up approximately 0.6% on Wednesday.
If the weekly support at $58,375 holds, Bitcoin could encounter resistance at several key levels.
- The lower boundary of the descending wedge sits around $62,000.
- The descending wedge's daily resistance and upper boundary hovers near $63,956.
- The 61.8% Fibonacci retracement level and the weekly resistance are at $66,631 and $67,147, respectively.
A breakthrough above these resistance barriers could propel BTC's price towards retesting the next weekly resistance at $71,280.
The Relative Strength Index (RSI) is currently below 50 on the daily chart, while the Awesome Oscillator (AO) is below its zero level. For bulls to stage a convincing comeback, both momentum indicators must sustain positions above their respective thresholds of 50 for RSI and zero for AO.
BTC/USDT daily chart
However, if BTC closes below the $58,375 level and forms a lower low on the daily time frame, it could indicate that bearish sentiment persists. Such a development may trigger a 3% decline in Bitcoin’s price, revisiting its previous low of $56,552 on May 1.
Ethereum price shows resilience
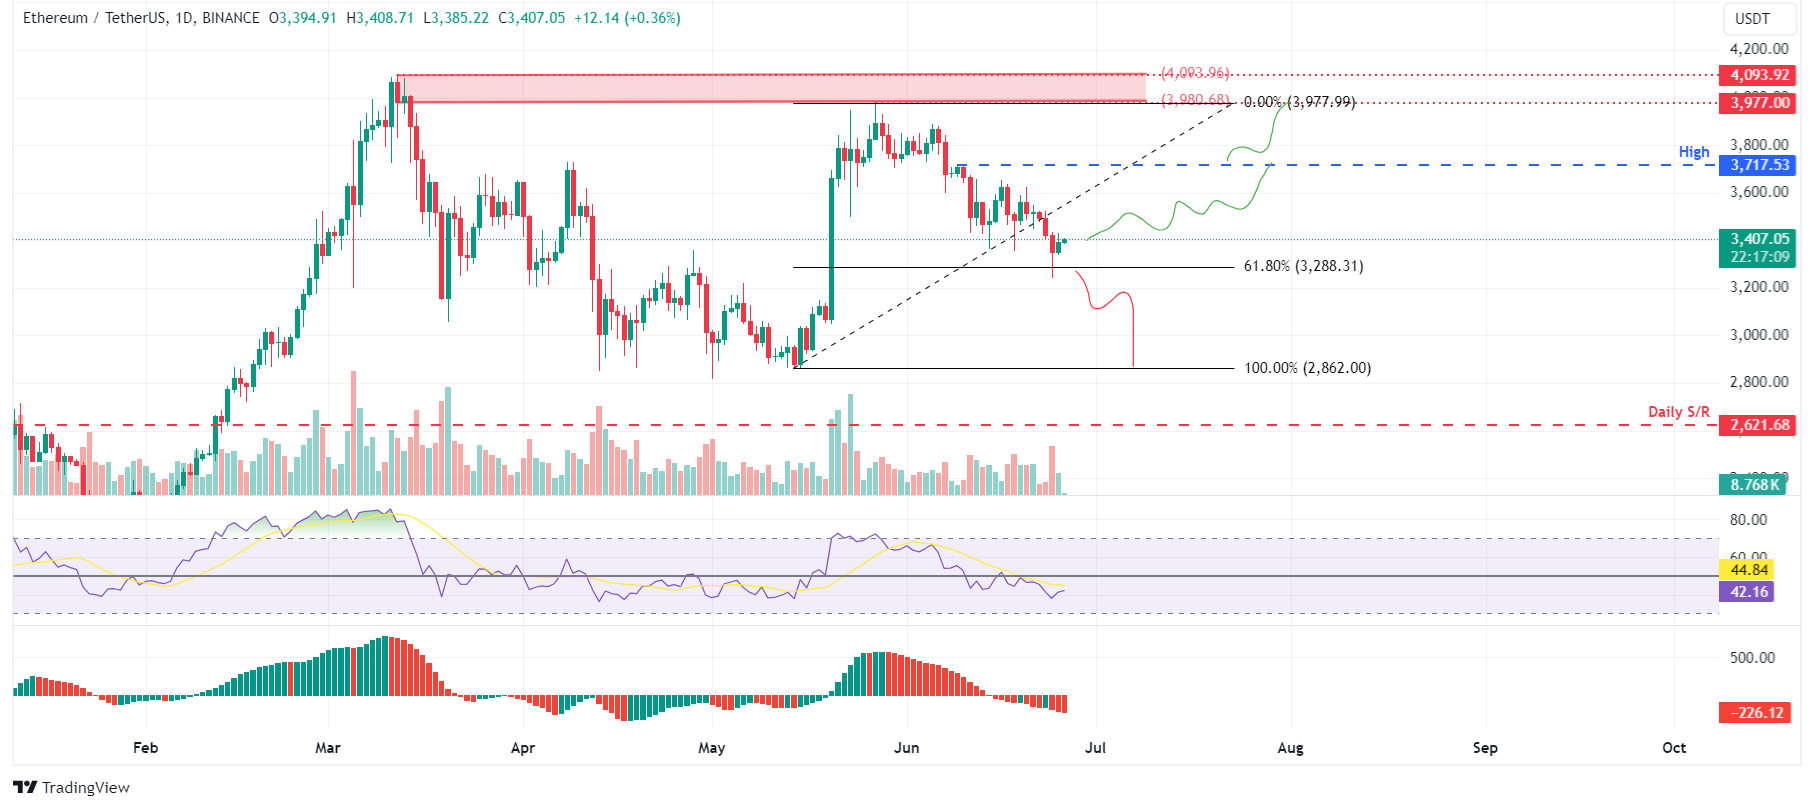
Ethereum price retested its support level of $3,288, the 61.8% Fibonacci retracement level drawn from a swing low of $2,862 on May 14 to a swing high point of $3,977 on May 27 on Monday. ETH rebounded by 4.8% from Monday's low of $3,240, closing at $3,394 on Tuesday.
ETH trades at around $3,407 at the time of writing, edging up approximately 0.7% on Wednesday.
If this support at $3,288 holds, ETH price could rally 9% from its current trading level of $3,407 to tag its previous high of $3,717 on June 9.
The Relative Strength Index (RSI) and the Awesome Oscillator in the daily chart are both below the mean level of 50 and zero, respectively. If bulls are indeed making a comeback, then both momentum indicators must maintain their positions above their respective levels.
If ETH closes above $3,717, the high of June 9, it could extend an additional rally of 7% to reach its previous resistance level of $3,977.
ETH/USDT daily chart
On the other hand, if Ethereum's daily candlestick price closes below the $3,288 level, it would produce a lower low and signal a break in the market structure. This move would invalidate the aforementioned bullish thesis, potentially triggering an extra 13% crash to the previous support level of $2,862.
Ripple price shows potential for upside
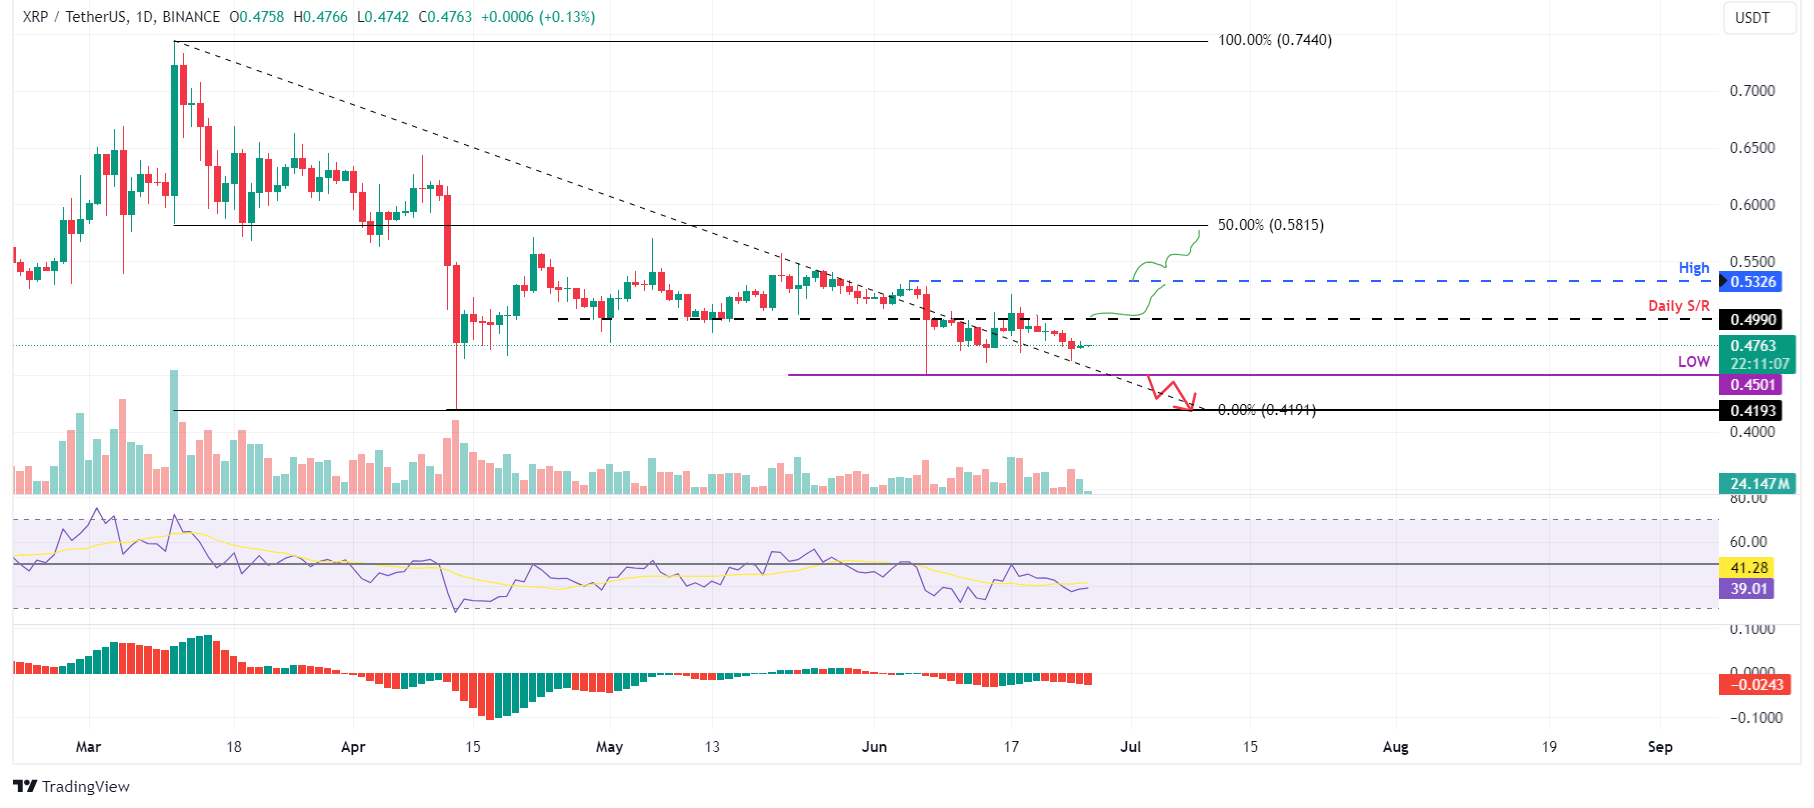
Ripple's price currently trades at $0.476, below the daily resistance level of $0.499. Despite Monday's fall in Bitcoin’s price, XRP has shown resilience in its price action.
If Ripple's price surpasses the barrier at $0.499, it could rise 7% from $0.499 to $0.532, its previous high from June 5.
In the daily chart, the Relative Strength Index (RSI) is below the 50 mark, indicating neutral to bearish sentiment, while the Awesome Oscillator (AO) remains below zero, suggesting bearish momentum. Both indicators must rise above their critical thresholds of 50 for RSI and zero for AO for a sustained bullish trend. Such a development would bolster the ongoing recovery rally in the market.
If the XRP daily candlestick closes above $0.532, it could extend an additional 9% rally to $0.581, a 50% price retracement level of $0.419 and $0.744 from March 11 to April 13.
XRP/USDT daily chart
Conversely, if Ripple's daily candlestick closes below $0.450, marking the June 7 low, establishing a lower low on the daily chart would invalidate the bullish outlook. This scenario might lead to a 7% decline in XRP's price towards the April 13 low of $0.419.
Information on these pages contains forward-looking statements that involve risks and uncertainties. Markets and instruments profiled on this page are for informational purposes only and should not in any way come across as a recommendation to buy or sell in these assets. You should do your own thorough research before making any investment decisions. FXStreet does not in any way guarantee that this information is free from mistakes, errors, or material misstatements. It also does not guarantee that this information is of a timely nature. Investing in Open Markets involves a great deal of risk, including the loss of all or a portion of your investment, as well as emotional distress. All risks, losses and costs associated with investing, including total loss of principal, are your responsibility. The views and opinions expressed in this article are those of the authors and do not necessarily reflect the official policy or position of FXStreet nor its advertisers. The author will not be held responsible for information that is found at the end of links posted on this page.
If not otherwise explicitly mentioned in the body of the article, at the time of writing, the author has no position in any stock mentioned in this article and no business relationship with any company mentioned. The author has not received compensation for writing this article, other than from FXStreet.
FXStreet and the author do not provide personalized recommendations. The author makes no representations as to the accuracy, completeness, or suitability of this information. FXStreet and the author will not be liable for any errors, omissions or any losses, injuries or damages arising from this information and its display or use. Errors and omissions excepted.
The author and FXStreet are not registered investment advisors and nothing in this article is intended to be investment advice.
Recommended Content
Editors’ Picks

Shiba Inu eyes positive returns in April as SHIB price inches towards $0.000015
Shiba Inu's on-chain metrics reveal robust adoption, as addresses with balances surge to 1.4 million. Shiba Inu's returns stand at a solid 14.4% so far in April, poised to snap a three-month bearish trend from earlier this year.

AI tokens TAO, FET, AI16Z surge despite NVIDIA excluding crypto-related projects from its Inception program
AI tokens, including Bittensor and Artificial Superintelligence Alliance, climbed this week, with ai16z still extending gains at the time of writing on Friday. The uptick in prices of AI tokens reflects a broader bullish sentiment across the cryptocurrency market.

Bitcoin Weekly Forecast: BTC consolidates after posting over 10% weekly surge
Bitcoin price is consolidating around $94,000 at the time of writing on Friday, holding onto the recent 10% increase seen earlier this week. This week’s rally was supported by strong institutional demand, as US spot ETFs recorded a total inflow of $2.68 billion until Thursday.

XRP price could renew 25% breakout bid on surging institutional and retail adoption
Ripple price consolidates, trading at $2.18 at the time of writing on Friday, following mid-week gains to $2.30. The rejection from this weekly high led to the price of XRP dropping to the previous day’s low at $2.11, followed by a minor reversal.
Bitcoin Weekly Forecast: BTC consolidates after posting over 10% weekly surge
Bitcoin (BTC) price is consolidating around $94,000 at the time of writing on Friday, holding onto the recent 10% increase seen earlier this week.

The Best brokers to trade EUR/USD
SPONSORED Discover the top brokers for trading EUR/USD in 2025. Our list features brokers with competitive spreads, fast execution, and powerful platforms. Whether you're a beginner or an expert, find the right partner to navigate the dynamic Forex market.