Top 3 Price Prediction Bitcoin, Ethereum, Ripple: BTC and XRP position for a bullish sequel, but concerns emerge for ETH
- Bitcoin price confirms the importance of the June 29 high of $36,675 with a bullish outside day on the bar charts.
- Ethereum price nears critical resistance after climbing 15 of the past 16 sessions, logging a gain of 58.38%.
- XRP price consolidating breakout from a double bottom pattern on July 28, with the 200-day simple moving average (SMA) offering resistance.

Bitcoin price, Ethereum and XRP have reached formidable resistance levels, driving the daily Relative Strength Index (RSI) to mild overbought readings, but the impulsive rallies from the July 20 lows signal a firm bottom for the crypto majors. In his book Winning on Wall Street, Martin Zweig talked about the importance of committed buying power.
The market must push off with a lot of firepower to get off the ground. To put it succinctly, if the tape can’t ignite, conditions aren’t right.
Bitcoin price bull market does not wait for anyone
Bitcoin price may have completed the correction yesterday with a bullish outside day on the bar chart, symbolizing the exit of weak holders and the appearance of investors seeking to capitalize on the lower prices near the support granted by the June 29 high of $36,675. Simultaneously, the underlying volume BTC profile has carried a bullish trend of light volume on negative days and strong volume on positive days, indicating no rush for the exits, despite the notable gain off the July lows.
Moving forward, the exact resistance framed by the June 15 high of $41,322, followed by the 38.2% retracement at $42,589 and the February 28 low of $43,016, remains the barrier between Bitcoin price and better BTC outcomes. To confirm the unlocking from the resistance, it is crucial to log a daily close above $43,016, and preferably, a daily close above the 200-day SMA at $44,812.
Beyond the 200-day SMA, Bitcoin price is primed to overcome the BTC resistance associated with the 50% and 61.8% retracement levels at $46,849 and $51,109, respectively, before discovering legitimate opposition around $57,750.
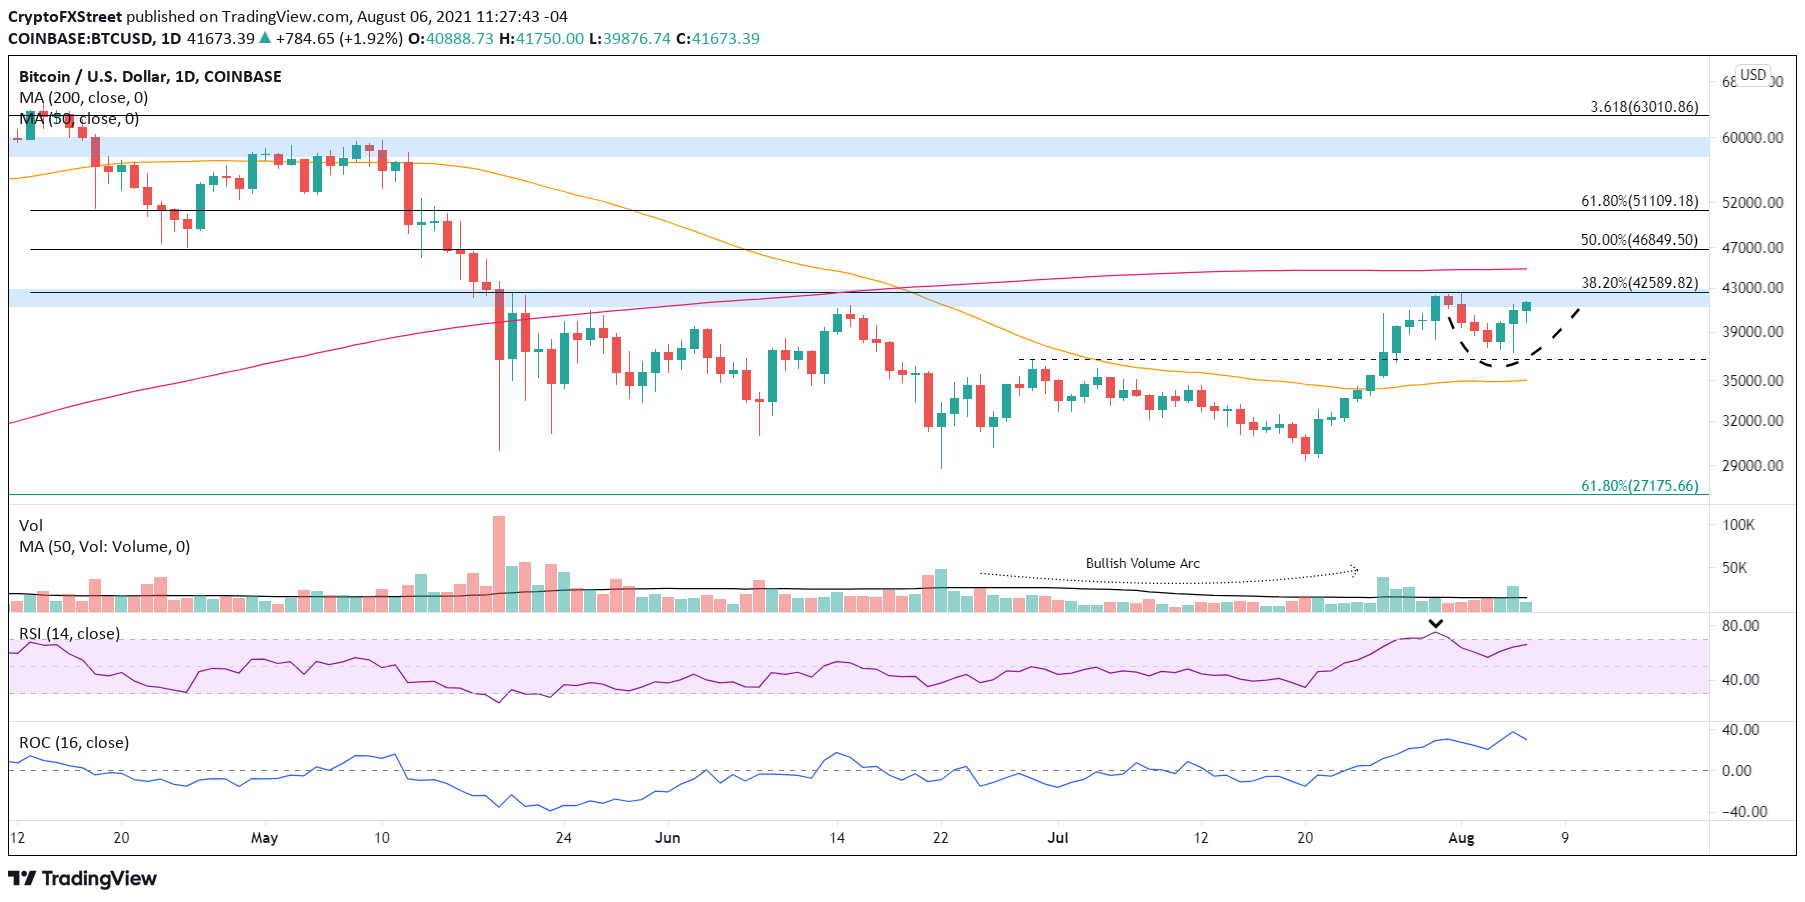
BTC/USD daily chart
Critical to the bullish narrative is the support provided by the June 29 high of $36,675. A failure to hold puts Bitcoin price on a collision course with the 50-day SMA at $34,995. If that scenario emerges, look for a bullish momentum divergence on the intra-day charts as BTC tests the moving average.
Initially, the ideal scenario was for a correction in time versus price. Still, Bitcoin price has engaged in a price correction, removing the weak holders that populate the ownership ranks and strengthened BTC for a breakthrough of the trifecta of resistance outlined above.
Here, FXStreet's analysts evaluate where BTC could be heading next as it seems bound to correct before surging.
Ethereum price overbought, but it may signal a continuation
Over the years, Dan Sullivan, a successful market operator, has studied the importance of momentum and overbought conditions to a trend continuation.
We have found over the years that when the market works into an intensely overbought condition, the odds favor still higher prices over the intermediate term.
As of yesterday, Ethereum price logged gains on 15 of the past 16 trading sessions, pushing ETH higher by 58.38% and demonstrating a relentless bid. The momentum pushed the daily RSI into an overbought reading on August 2, but the rally has continued, confirming momentum breeds more momentum.
A second result of the determined bid is Ethereum price now rests just below a congestion of price highs from late May and early June. More specifically, the June 3 high of $2,890, the May 26 high of $2,913 and the May 20 high of $3,000. It is an obvious point for ETH to release the price compression provoked by the impulsive rally from July 21.
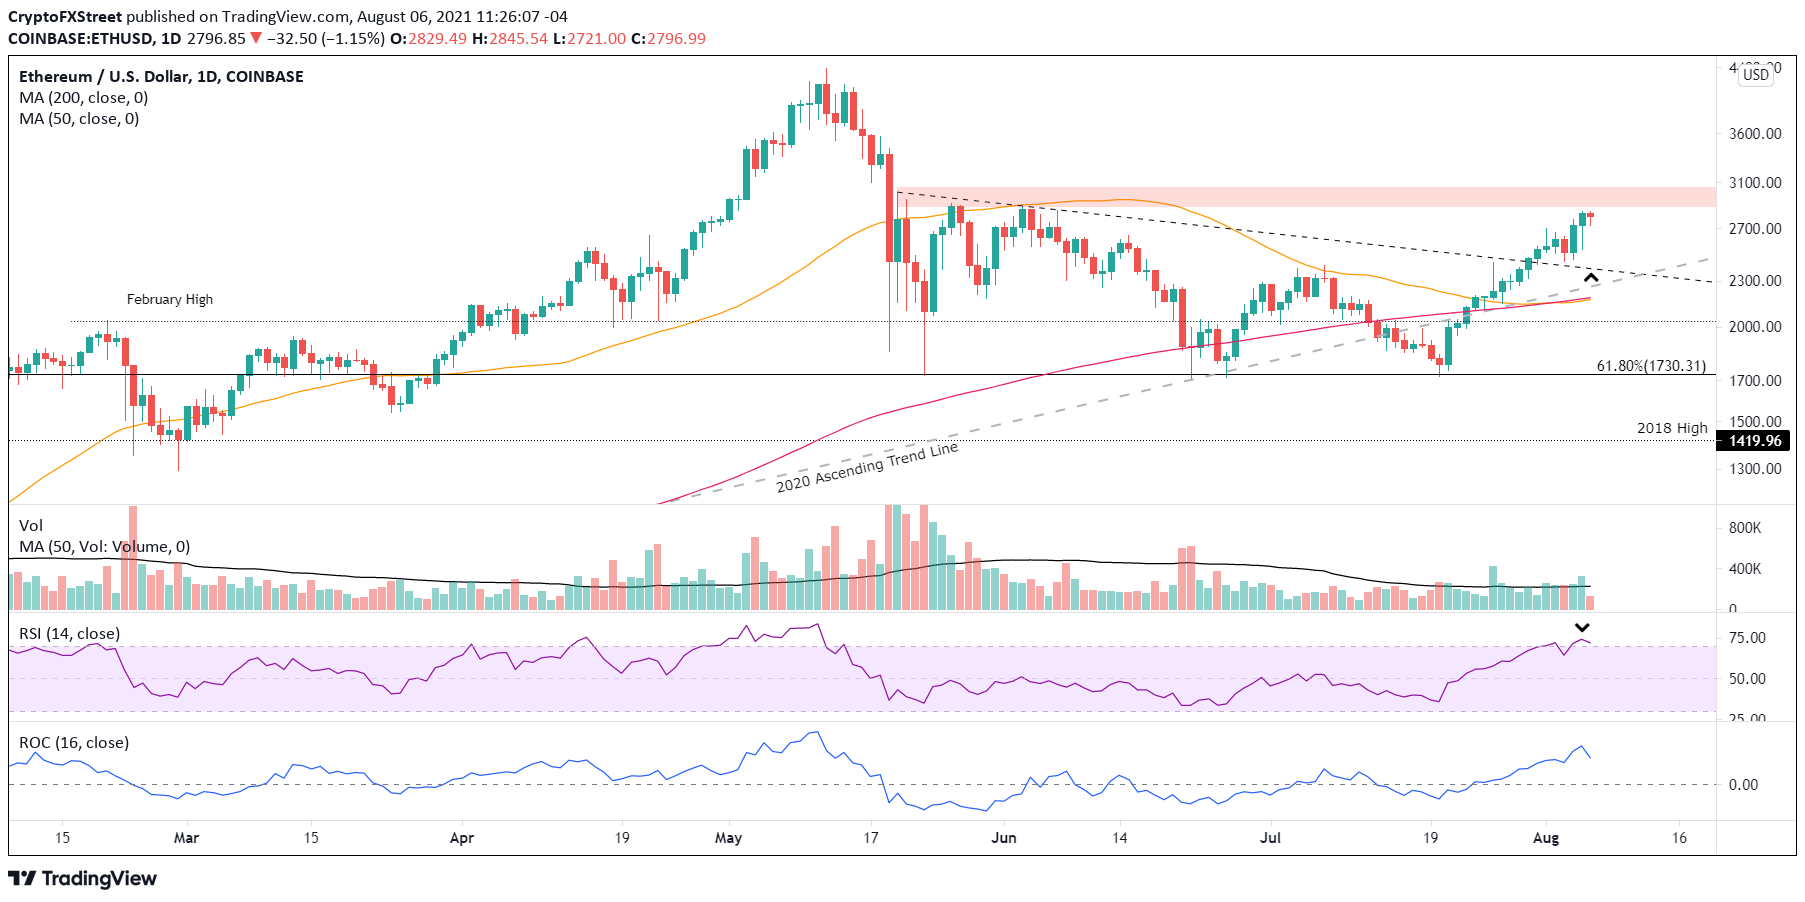
ETH/USD daily chart
If a corrective process emerges, it is critical Ethereum price holds the upper trend line of the descending triangle, now around $2,387. A failure to hold would encourage a 2020 ascending trend line test, representing a 15% decline from the current price. Any selling below the ascending trend line would neutralize the bullish ETH narrative and promote a more cautious outlook.
A couple of observations may indicate that Ethereum price is at a short-term high or close. One is the tremendous spike in social volume over the last few days, almost equaling the levels reached in early May when ETH volatility increased and it suffered some selling pressure. Moreover, it has boosted the 7 four-hour moving average to the levels reached at the Ethereum price highs in mid-May.
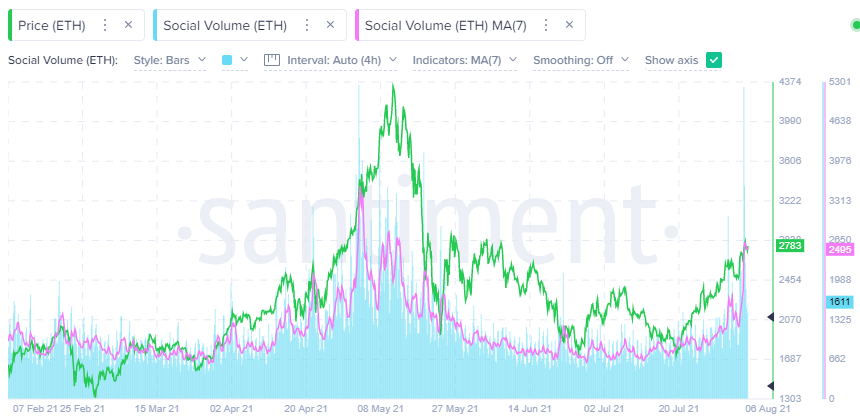
ETH Social Volume - Santiment
A worrisome development that may also portend an Ethereum price correction is the declining Daily Active Addresses (DAA) since the end of July, signifying that the number of unique addresses in ETH transactions is weakening. Or, the daily level of crowd interaction with ETH is waning.
It is a marked contrast with the rise in Daily Active Addresses into the May high.
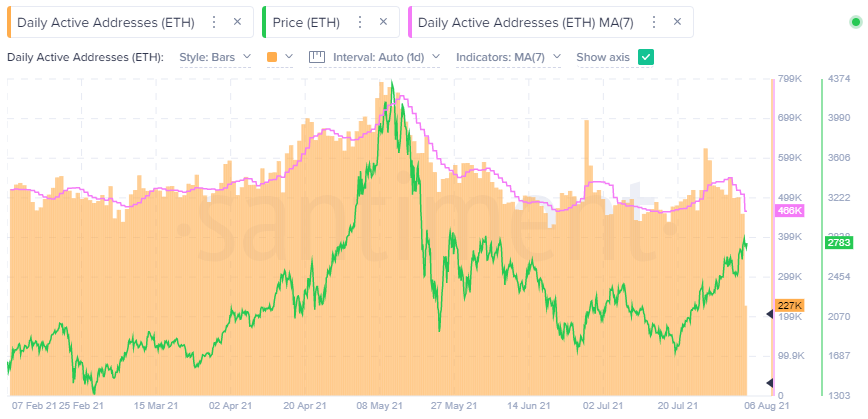
ETH Daily Active Addresses (DAA) - Santiment
Based on the social volume metric, the public is aware of the Ethereum price rally. Still, in terms of actions, they are not interacting with ETH, despite the explosiveness, hinting that a correction is imminent.
Here, FXStreet's analysts evaluate where ETH could be heading next as it seems bound to advance further.
XRP price just needs some time
On July 29, XRP price triggered a double bottom pattern with a Ripple daily close above $0.733 after easily beating the 50-day SMA and touching the staggering resistance framed by the 200-day SMA and the neckline of a multi-year inverse head-and-shoulders pattern around $0.772.
Over the last seven sessions, XRP price has drifted sideways to down, showing a correction in time versus price and attesting to the strength of the underlying bid for Ripple.
The double bottom pattern’s measured move is just over 30%, inviting a price target of $0.953 based on the pattern trigger price of $0.733. The XRP price target falls short of the significant resistance outlined by the psychologically important $1.00 and the 38.2% retracement level of the April-June correction at $1.06. An extension of the rally to $1.06 would reward Ripple investors with a 35.36% gain.
To reach the measured move price target, Ripple needs to conquer the resistance attributed to the neckline and the 200-day SMA at $0.788. A daily XRP price close above the moving average would be a timely entry price to add to an existing Ripple position or initiate as resistance now becomes support.
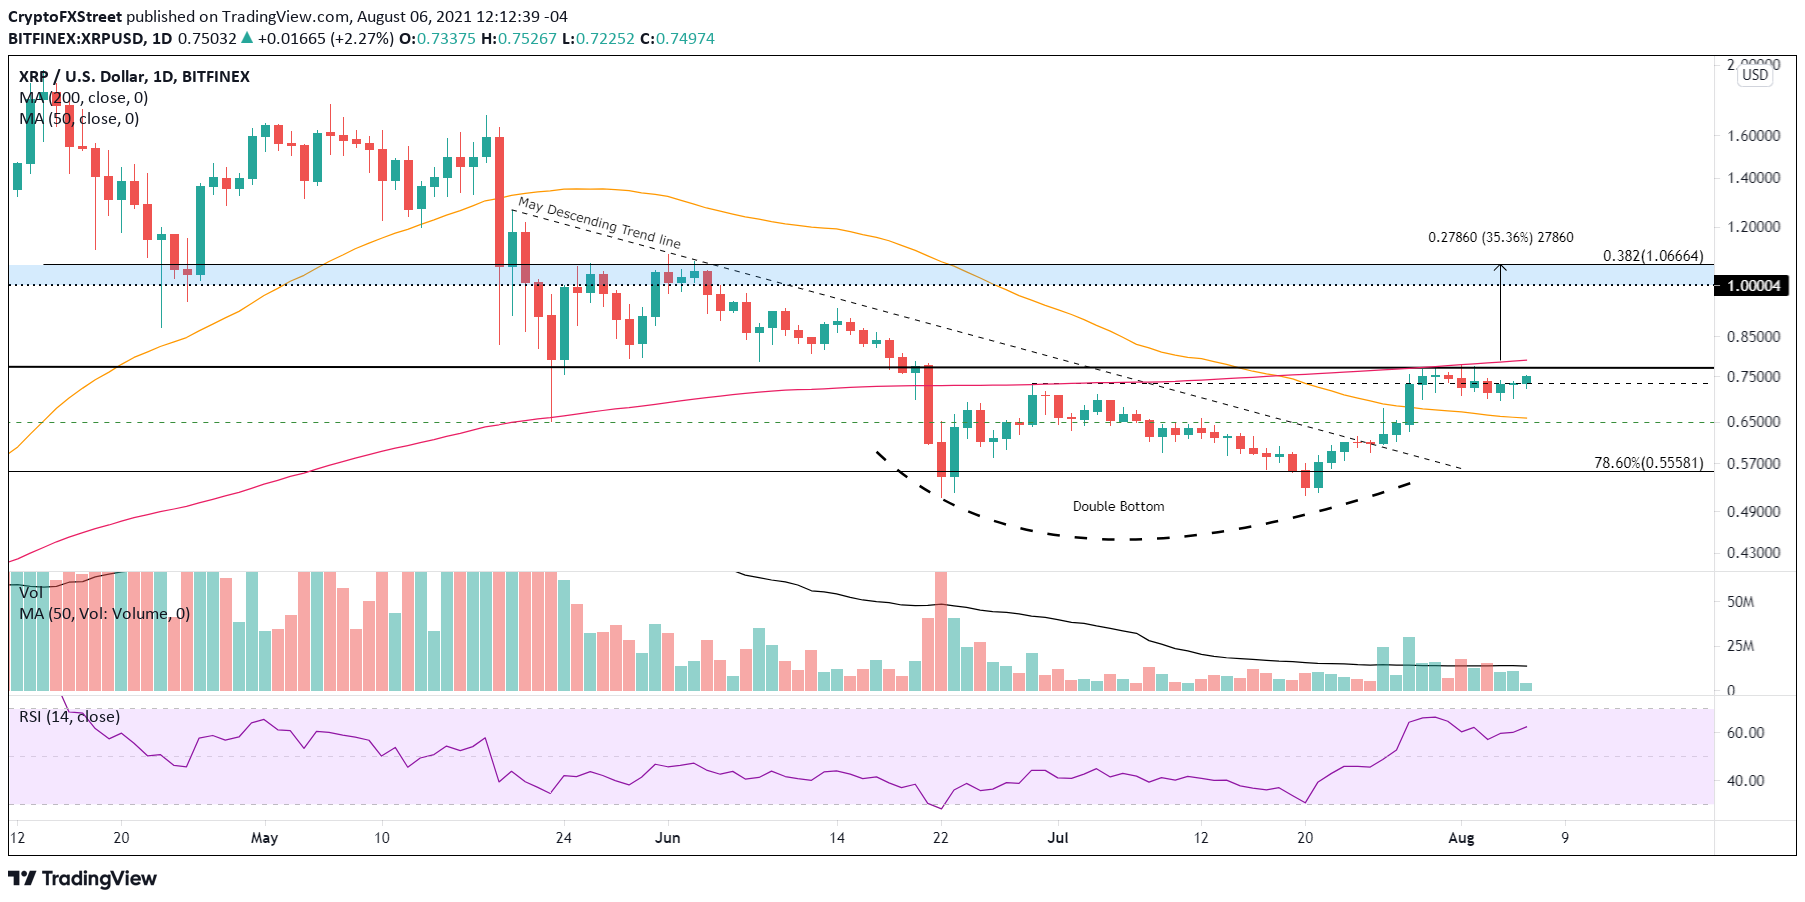
XRP/USD daily chart
However, if the XRP corrective process evolves from just being in time, Ripple needs to limit the selling to the convergence of the 50-day SMA at $0.657 with the May 23 low of $0.652. A breakdown from those levels shifts the outlook to neutral and raises the probability of at least a test of the 78.6% retracement of the rally from the December 2020 low at $0.555, or potentially lower.
All three cryptocurrency majors have benefited from a committed bid off the July lows, substantiating that the tape has ignited. However, Ethereum price now faces overheated social media interest and declining interaction with ETH. Meanwhile, Bitcoin price is nearing a stand-off with a trifecta of resistance and XRP price positions for the first attempt to break through fierce technical opposition.
Here, FXStreet's analysts evaluate where Ripple could be heading next as it remains stagnant.
Author

Sheldon McIntyre, CMT
Independent Analyst
Sheldon has 24 years of investment experience holding various positions in companies based in the United States and Chile. His core competencies include BRIC and G-10 equity markets, swing and position trading and technical analysis.


