![]() Sheldon McIntyre, CMT
Sheldon McIntyre, CMT
Independent Analyst
- Bitcoin price wavers at the 50% retracement level at $46,849 as underlying momentum continues to weaken.
- Ethereum price trying to hold the July trend line as a bearish momentum divergence accompanies recent highs.
- XRP price strength lifts the daily Relative Strength Index (RSI) to the most overbought reading since April high.
Bitcoin price and Ethereum meet transition points for the July rally as pivotal Fibonacci levels emerge as formidable resistance. XRP price pauses, but it probably will not be for long.
Bitcoin price has reached a minor inflection point
Bitcoin price closed last week with its fourth consecutive weekly gain, marking the first time since February and lifting BTC to an August gain of 11.48% and 32.14% for Q3. It is the best August performance since the August 2017 gain of 66.05% and the best third-quarter return since the 76.73% rise in Q32017.
However, the momentum has declined measurably since the August 7 close, just below the 200-day simple moving average (SMA) at $44,637. Over the last nine trading days, Bitcoin price has rallied only 3.61%, carrying BTC to new highs but forging a bearish momentum divergence as the RSI has not confirmed the price highs on various timeframes.
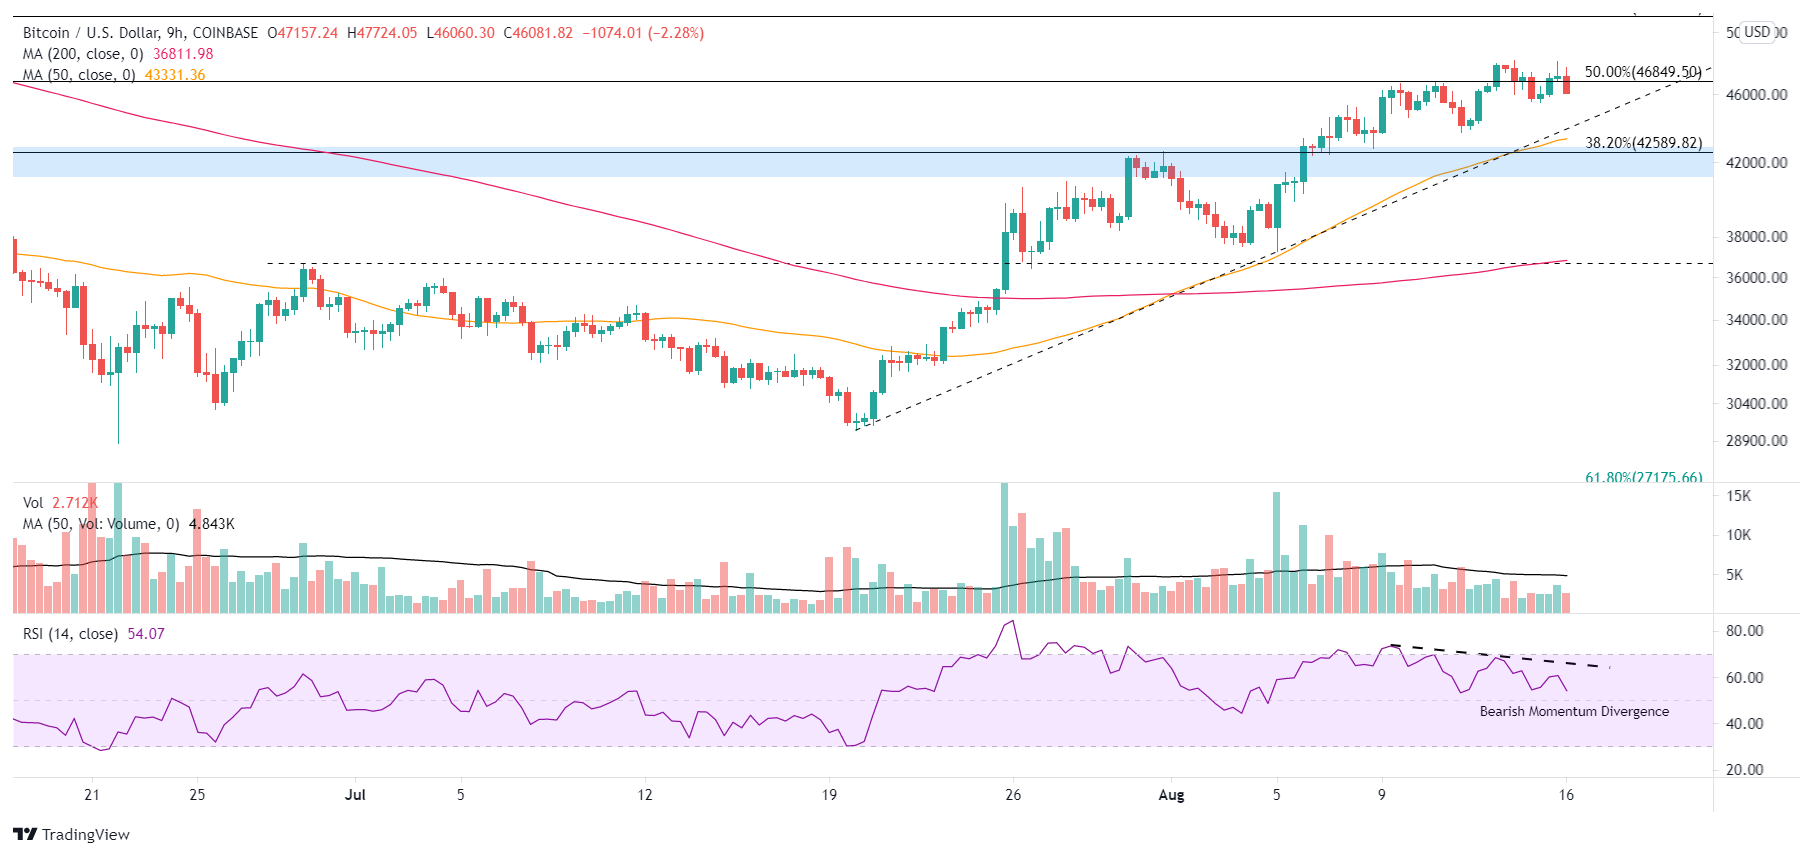
BTC/USD 9-hour chart
The bearish momentum divergence does put the July rally at risk in the short term. It raises the probability that BTC will test the previous trifecta of resistance (now support) between $41,500 and $43,000, including the 38.2% retracement of the April-July correction, yielding an 11% correction from the current price.
If a BTC correction gains traction below the trifecta of support, Bitcoin price will not encounter support until the 50-day SMA at $37,446, which currently rests close to the critical June 29 high of $35,301.
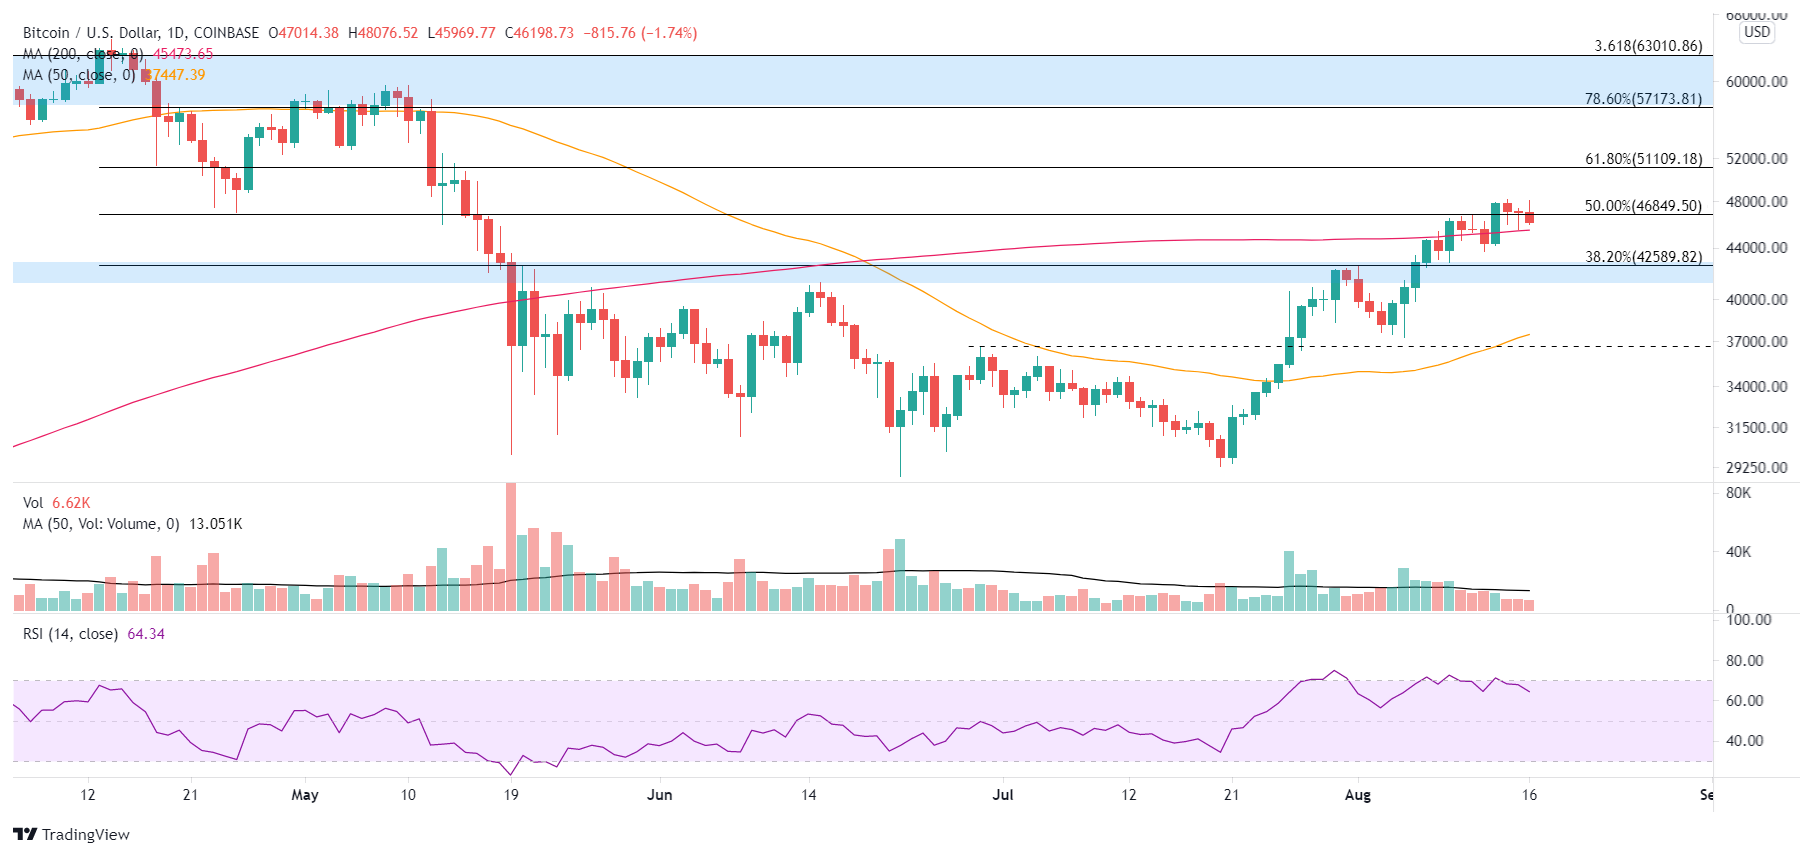
BTC/USD daily chart
The potential for a deeper pullback is higher than a week ago, but due to the assortment of support, including the 200-day SMA at $45,473 and the 38.2% retracement at $42,589, Bitcoin price weakness could be well-contained and lead to a correction in time versus price. It would still reconcile the bearish momentum divergence, create an additional entry price for latecomers and remove the weaker holders.
As a result of the slowing Bitcoin price momentum and the broadening of the altcoin participation in the general upswing in the cryptocurrency complex, the BTC market dominance has broken the May uptrend. It is now correcting, currently at 44.15%. It does not warn of a pending collapse for the bellwether cryptocurrency but a correction.
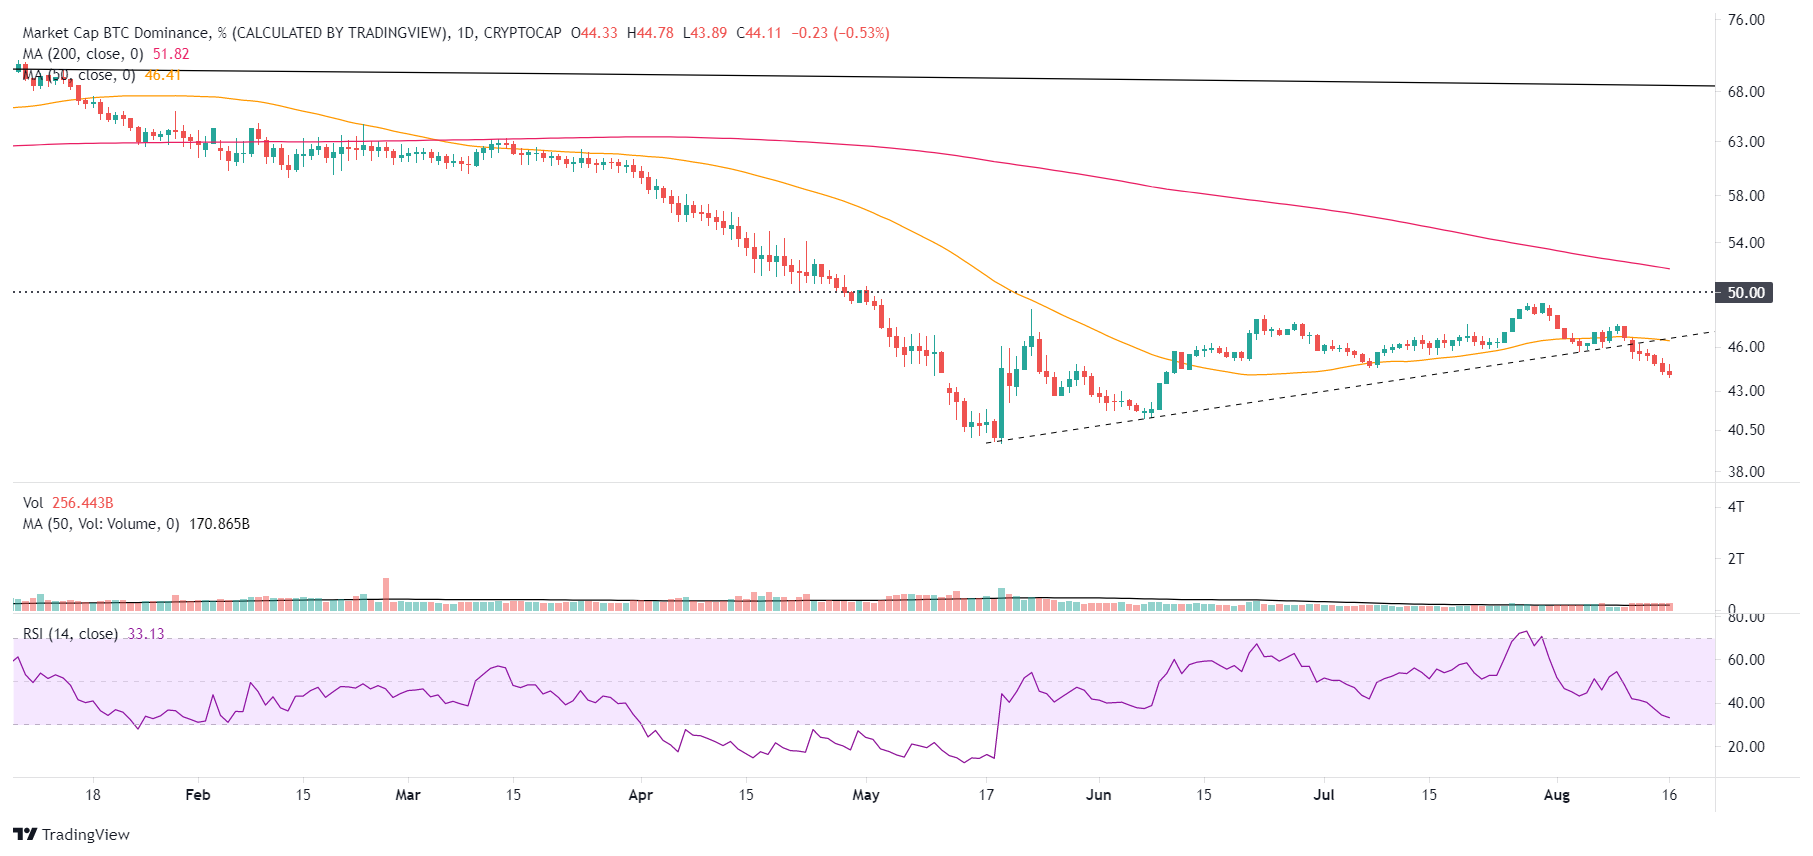
BTC/USD market dominance - daily chart
Here, FXStreet's analysts evaluate where BTC could be heading next as it looks primed to retrace.
Ethereum price hits key market dominance level
Ethereum price closed last week with its fourth consecutive weekly gain, marking the first time since May and lifting ETH to an August gain of 27.12% and 41.48% for Q3. It is the best August performance since the August 2017 gain of 93.81%.
Similar to Bitcoin price, Ethereum price has registered an evident decline in momentum since claiming the 50% retracement on August 7. Over the last nine sessions, ETH is up 5.62%, printing new rally highs but showing a bearish momentum divergence at the same time as the RSI has not confirmed price on various timeframes.
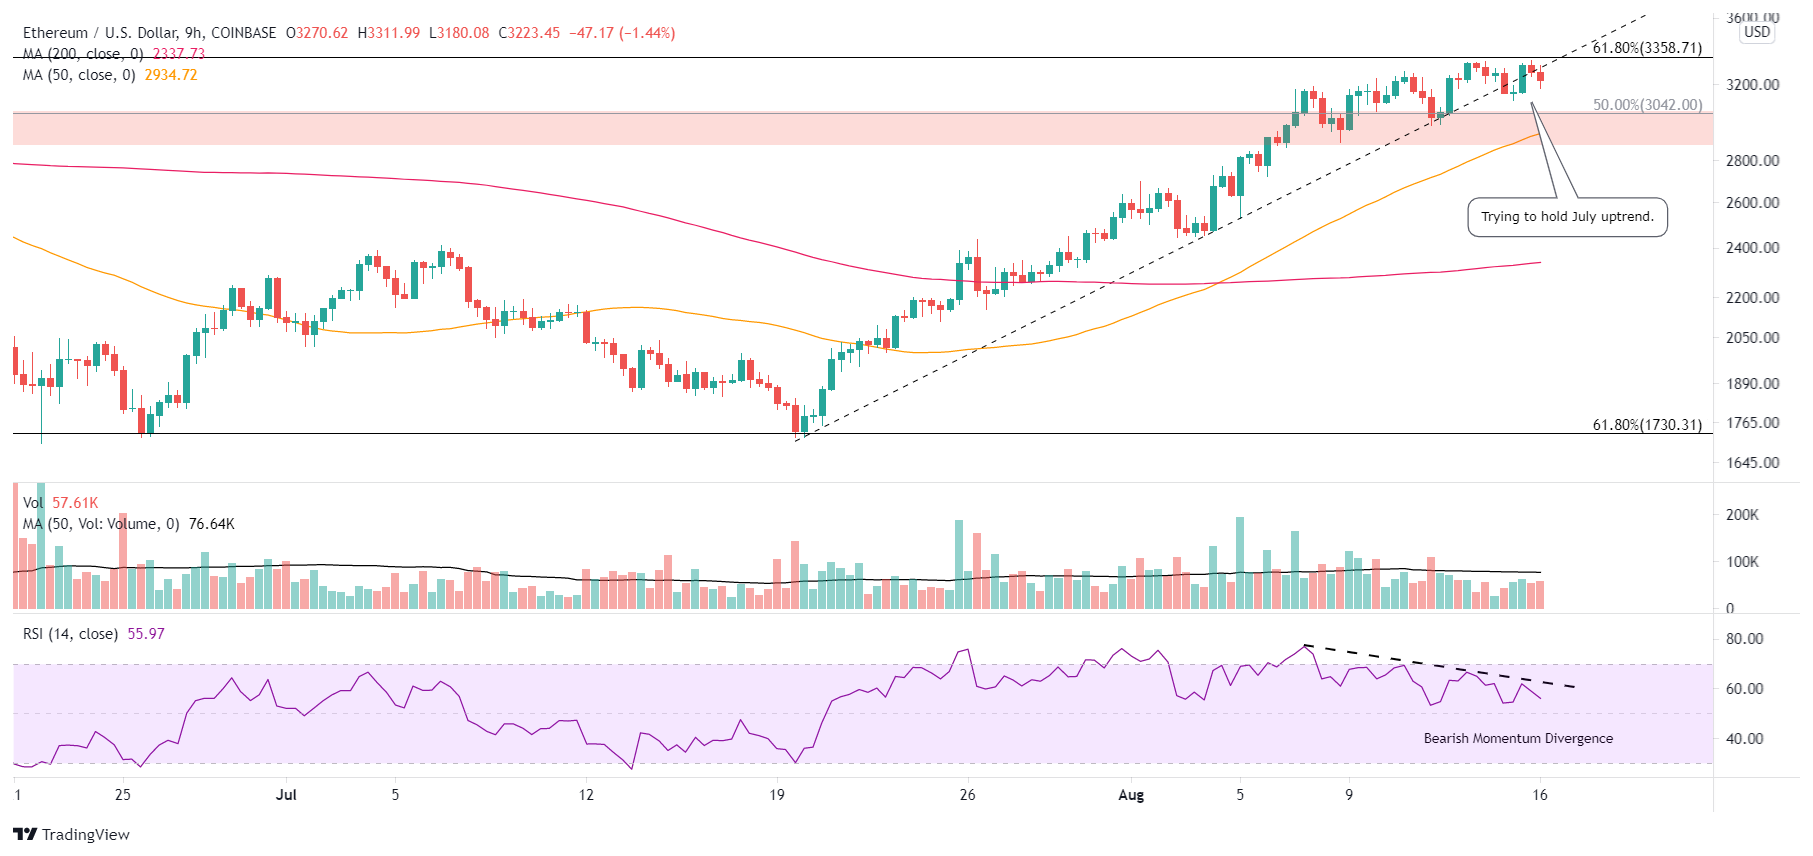
ETH/USD 9-hour chart
The bearish momentum divergence does raise the probability of an ETH pullback, potentially pushing Ethereum price down to the $2,900 to $3,050 range, representing an 11% correction. The range is strengthened by the 50% retracement level of the May-July correction at $3,042 and the 50 nine-hour SMA at $2,934.
A daily close below $2,900 changes the outlook for Ethereum price for at least the short term as there is no meaningful support until the confluence of the July 7 high of $2,411 and the 50-day SMA at $2,410.
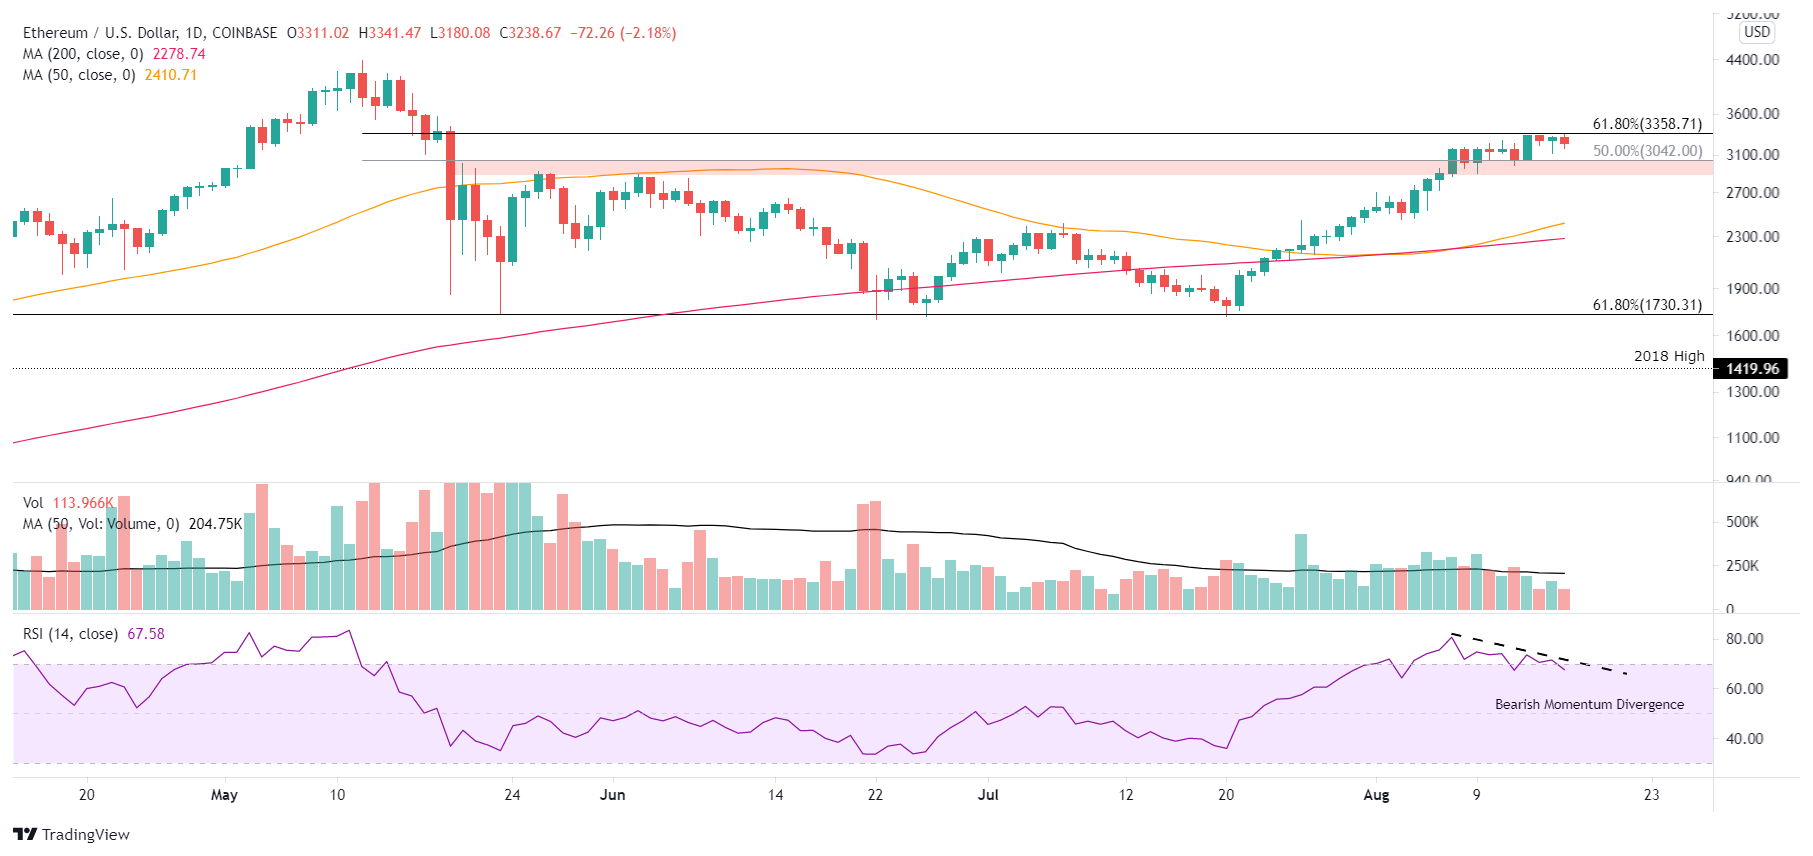
ETH/USD daily chart
Since the July low, the 80%+ rally for Ethereum price has pushed ETH market dominance past the 50% retracement of the 2017-2019 correction at 18.82% and the psychologically important 20.00% where the smart contracts giant found resistance in early May.
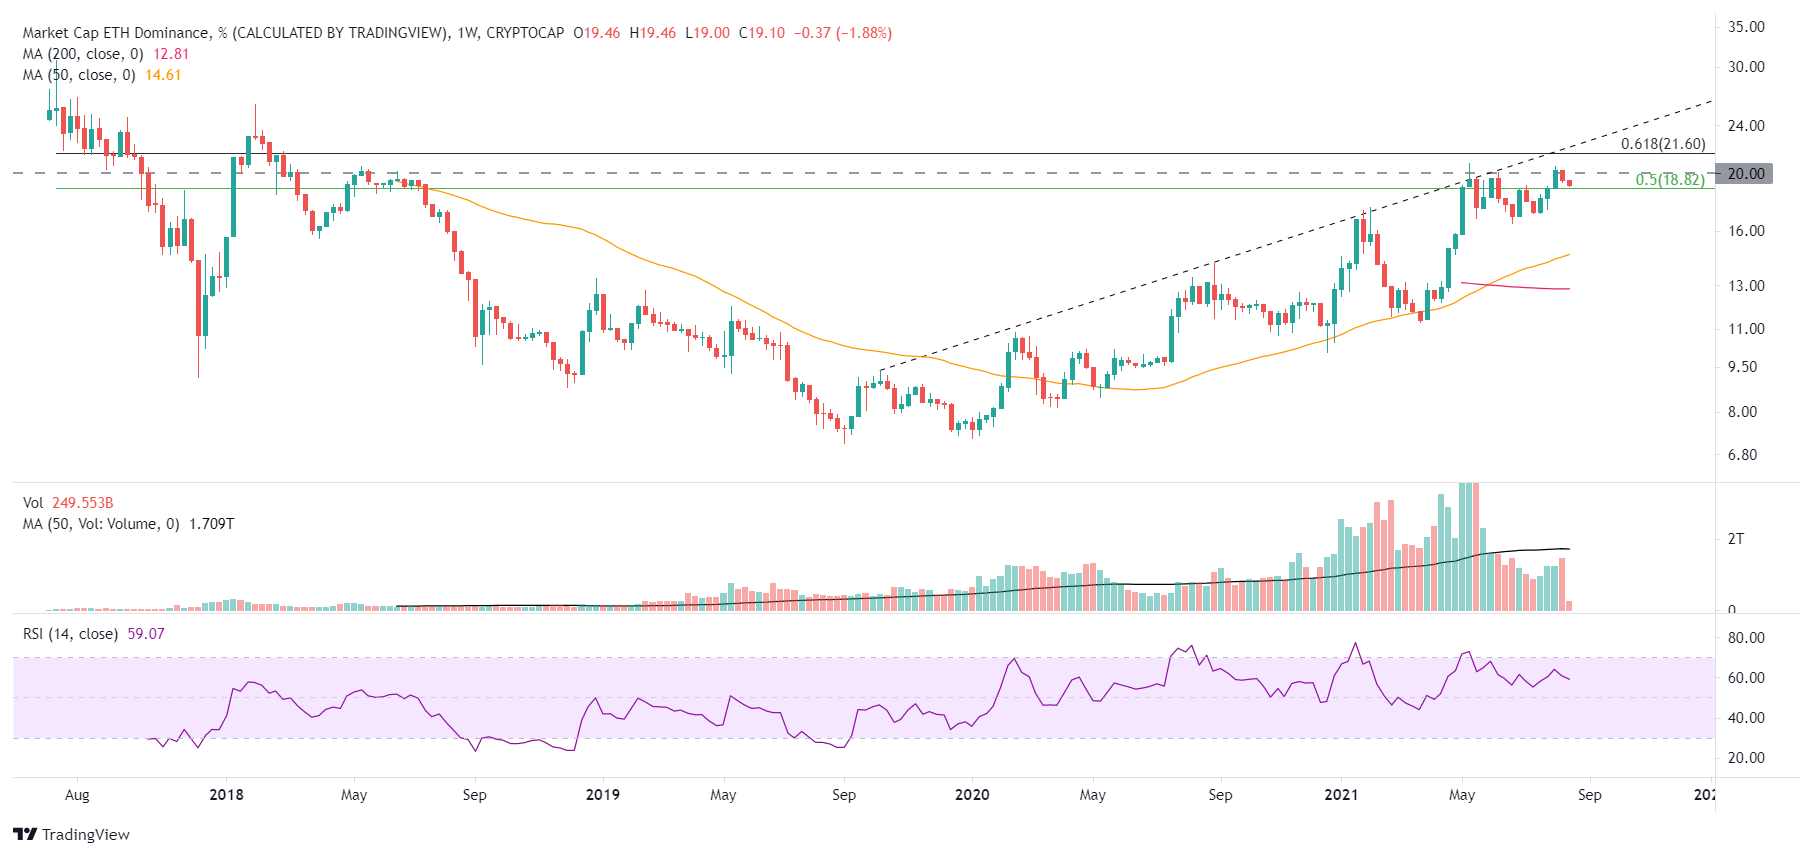
ETH/USD market dominance - weekly chart
Here, FXStreet's analysts evaluate where ETH could be heading next as it tests a crucial resistance level.
XRP price regains impulsive form of earlier in the year
XRP price closed last week with its fourth consecutive weekly gain, marking the first time since April and lifting Ripple to an August gain of 65.77% and 74.75% for Q3. It is the best August performance since the August 2017 gain of 57.68%.
Last week’s gain of 65.04% was the best weekly performance since the beginning of April. It shattered the resistance composed by the psychologically important $1.00 and the 38.2% retracement of the April-July correction at $1.06, as well as the 50% retracement at $1.23.

XRP/USD daily chart
The Ripple daily RSI shows an extreme overbought condition that may portend a pullback in the short term. As long as XRP price holds the support granted by $1.00 and the 38% retracement at $1.06, Ripple is primed for higher prices. The combination of the 78.6% retracement at $1.65 with the highs of the first half of May will be compelling resistance before a test of the April high of $1.96.
XRP price has positioned the international settlements token to achieve better outcomes, including a test of the April high of $1.96. Still, it is essential for Ripple investors not to overlook the ongoing legal battle with the SEC. If Ripple suffers a temporary defeat in the proceedings, it may negatively impact XRP price, potentially dramatically.
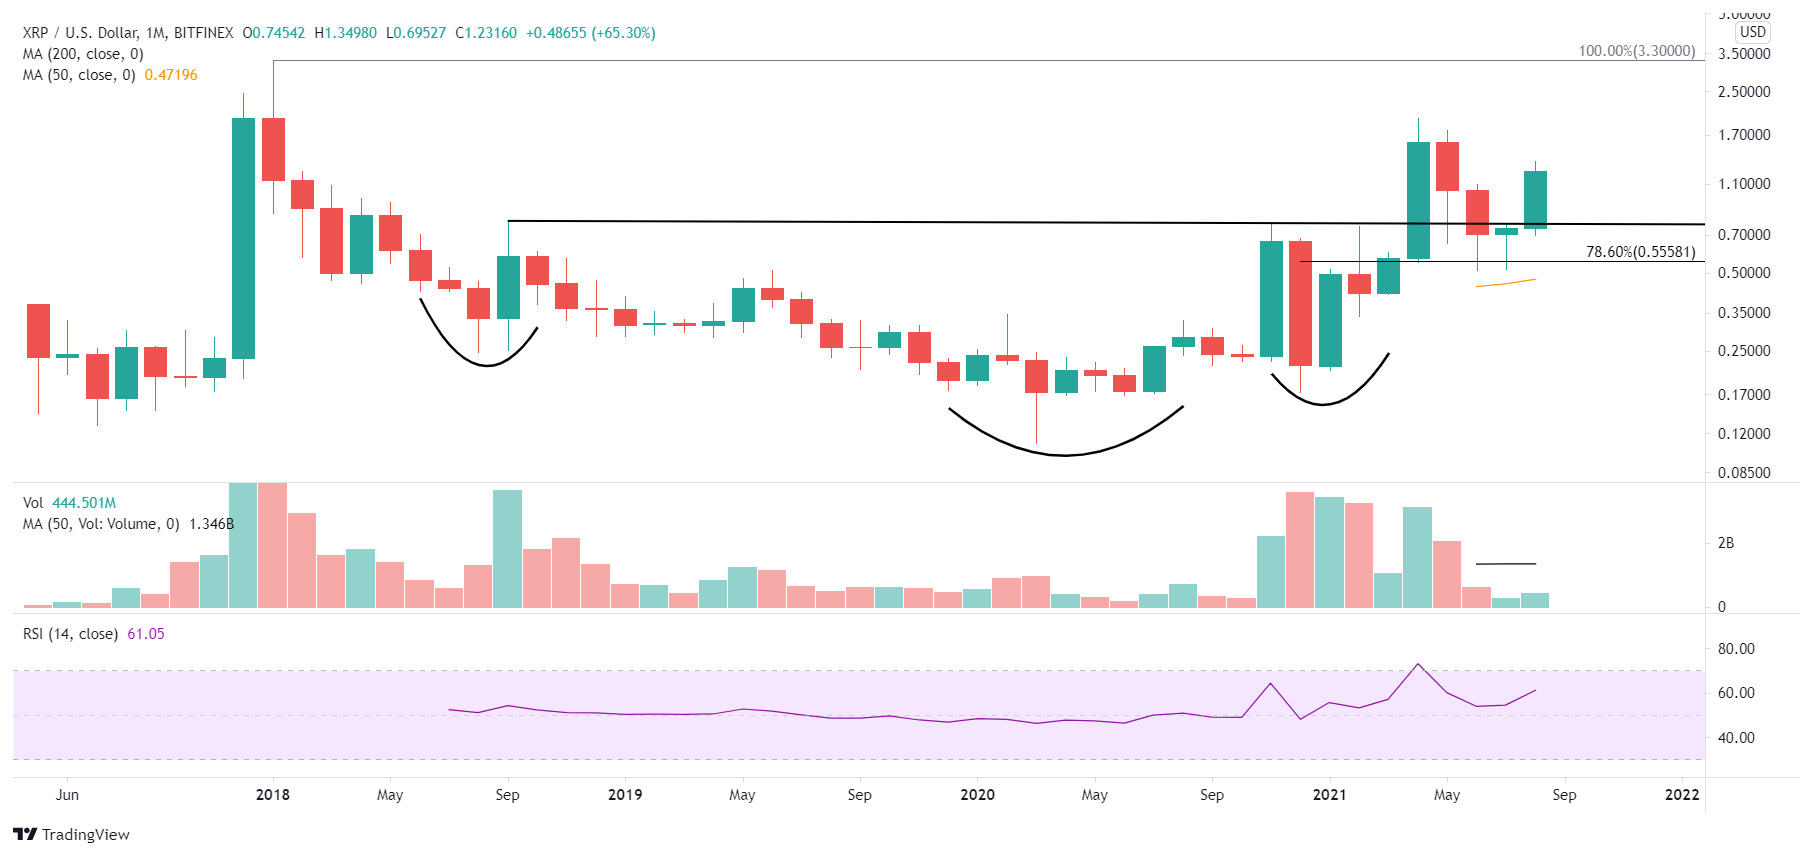
XRP/USD monthly chart
The charts for BTC and ETH project a period of consolidation or pullback. Still, the availability of robust support below the current prices suggests that any retreat will be limited, taking the form of correction in time versus price. Alternatively, XRP price reached escape velocity last week, which soon prepared Ripple for higher prices, especially in a cryptocurrency complex aggressively broadening into the altcoin ranks.
Here, FXStreet's analysts evaluate where Ripple could be heading next as it attempts to resume the uptrend.
Note: All information on this page is subject to change. The use of this website constitutes acceptance of our user agreement. Please read our privacy policy and legal disclaimer. Opinions expressed at FXstreet.com are those of the individual authors and do not necessarily represent the opinion of FXstreet.com or its management. Risk Disclosure: Trading foreign exchange on margin carries a high level of risk, and may not be suitable for all investors. The high degree of leverage can work against you as well as for you. Before deciding to invest in foreign exchange you should carefully consider your investment objectives, level of experience, and risk appetite. The possibility exists that you could sustain a loss of some or all of your initial investment and therefore you should not invest money that you cannot afford to lose. You should be aware of all the risks associated with foreign exchange trading, and seek advice from an independent financial advisor if you have any doubts.
Recommended Content
Editors’ Picks

Bitcoin Weekly Forecast: BTC nosedives below $95,000 as spot ETFs record highest daily outflow since launch
Bitcoin price continues to edge down, trading below $95,000 on Friday after declining more than 9% this week. Bitcoin US spot ETFs recorded the highest single-day outflow on Thursday since their launch in January.

Bitcoin crashes to $96,000, altcoins bleed: Top trades for sidelined buyers
Bitcoin (BTC) slipped under the $100,000 milestone and touched the $96,000 level briefly on Friday, a sharp decline that has also hit hard prices of other altcoins and particularly meme coins.

Solana Price Forecast: SOL’s technical outlook and on-chain metrics hint at a double-digit correction
Solana (SOL) price trades in red below $194 on Friday after declining more than 13% this week. The recent downturn has led to $38 million in total liquidations, with over $33 million coming from long positions.

SEC approves Hashdex and Franklin Templeton's combined Bitcoin and Ethereum crypto index ETFs
The SEC approved Hashdex's proposal for a crypto index ETF. The ETF currently features Bitcoin and Ethereum, with possible additions in the future. The agency also approved Franklin Templeton's amendment to its Cboe BZX for a crypto index ETF.

Bitcoin: 2025 outlook brightens on expectations of US pro-crypto policy
Bitcoin (BTC) price has surged more than 140% in 2024, reaching the $100K milestone in early December. The rally was driven by the launch of Bitcoin Spot Exchange Traded Funds (ETFs) in January and the reduced supply following the fourth halving event in April.

Best Forex Brokers with Low Spreads
VERIFIED Low spreads are crucial for reducing trading costs. Explore top Forex brokers offering competitive spreads and high leverage. Compare options for EUR/USD, GBP/USD, USD/JPY, and Gold.