- BTC/USD plummets without a compelling reason as volatility explodes upwards.
- ETH/USD sets new lows for the year and puts all its capital at risk.
- XRP/USD suffers like all Altcoins, but escapes the 2018 trough and can become the positive surprise of the year.
In the finance sector, the appearance of an unexpected event which massively affects the market and causes a large sell-off is called a "Black Swan". Did a "Black Swan" appear yesterday? A "black whale"? Or did the market simply need to shake off drowsiness and start its engines?
There are three candidates and one key fact in this preliminary forensic report.
The first candidate to be blamed was Goldman Sachs' statement that they were leaving the project of creating a Crypto trading desk. This may be bad news for markets but probably not for the Crypto community. Why? The financial services behemoth added in their communiqué they were going to focus on the service of deposit and certification of Crypto transactions for institutional clients. This is good news for markets and neutral for the Crypto community.
The second candidate comes from Switzerland and appears under the name ShapeShift. This company offers a service that allows the exchange of Altcoins and Bitcoins anonymously. The company announced yesterday that from 2019 it will require a declaration of identity and that customer data will be disclosed in cases where justice requires it. The argument to blame ShifShape for yesterday's crash is that its clients would have liquidated huge amounts of Altcoins causing panic.
The third candidate under the microscope is the news of a huge bearish position worth 10,000 BTC. The position would have been taken a few days ago and there is speculation that it could be an Insider Trading operation originating in the orbit of GS.
As an interesting fact and to follow the track, the market signals company Ronin IA issued a note where it states that their algorithms detected an unlikely (less than 0.3% probability) increase in social networking activity within the Crypto Segment. The explosion of activity occurred a few minutes before the collapse of cryptocurrencies. A lot of people knew that something was about to happen and probably a lot of people had their trading screens ready to fish in these troubled waters.
Here is my personal contribution on the subject from a technical point of view:
- Despite the strong declines we are seeing since yesterday, the activity levels of the bulls have not plummeted. Naturally, they have diminished in strength, but they continue at high levels.
- The movement started yesterday has increased volatility in all assets. This indicator, which was at lows and had decreased even more during the whole bullish period, does not understand ups or downs, it only measures the degree of "excitement" in the price.
Well, following the theories of Benoît Mandelbrot in his study "Fractals and Finance", volatility is grouped into areas of "high" or "low" volatility, and transitions from one state to another cause a gradual increase, fractal structure, in the "excitement" in prices.
When an asset with very low levels of volatility approaches a zone of "high volatility", very violent movements begin to appear both upwards and downwards and in increasingly longer time periods.
It is like starting an old BMW Boxer engine. At first, the motorcycle shoots from left to right without stopping and with strong vibrations, until it reaches a point where one movement compensates the other and the machine is ready to take advantage of its maximum power.
BTC/USD 1-D
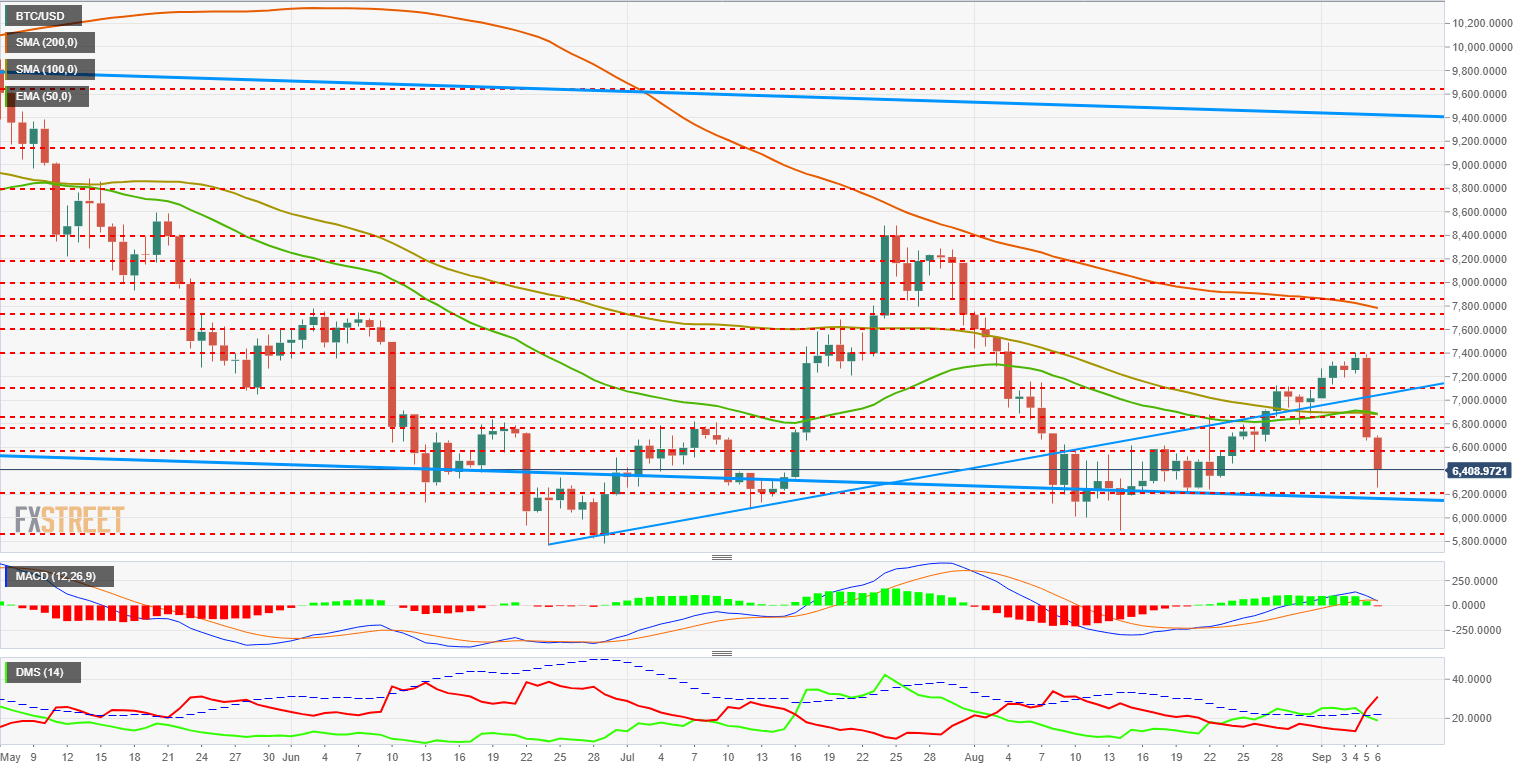
The BTC/USD currently trades at the $6,416 price level. It leaves the session low at $6.259 at only $260 from the base of the long-term channel that governs the movement since late 2017.
Above the current price, the first clear objective is to recover the $6,600 level (price congestion resistance), followed by the $6,800 price level (price congestion resistance) and the key price level of $6,850 (EMA50, SMA100 and price congestion resistance).
Below the current price, very little room for maneuver for the BTC/USD, with the first support seen around $6,200 followed immediately by the channel base at $6,150. As a key price level, the $5,875 support already exercised in July and August serves as a minimum level.

The MACD to 1D turns down and is about to cross the signal line. It does so just above the 0 level so the underlying strength continues to be positive for the BTC/USD.
The DMI at 1D shows the bears controlling the situation while the bulls decrease some of their strength but not as much is expected after yesterday's heavy falls. This indicator should be closely watched. The ADX is not immutable and remains practically flat.
ETH/USD 1-D
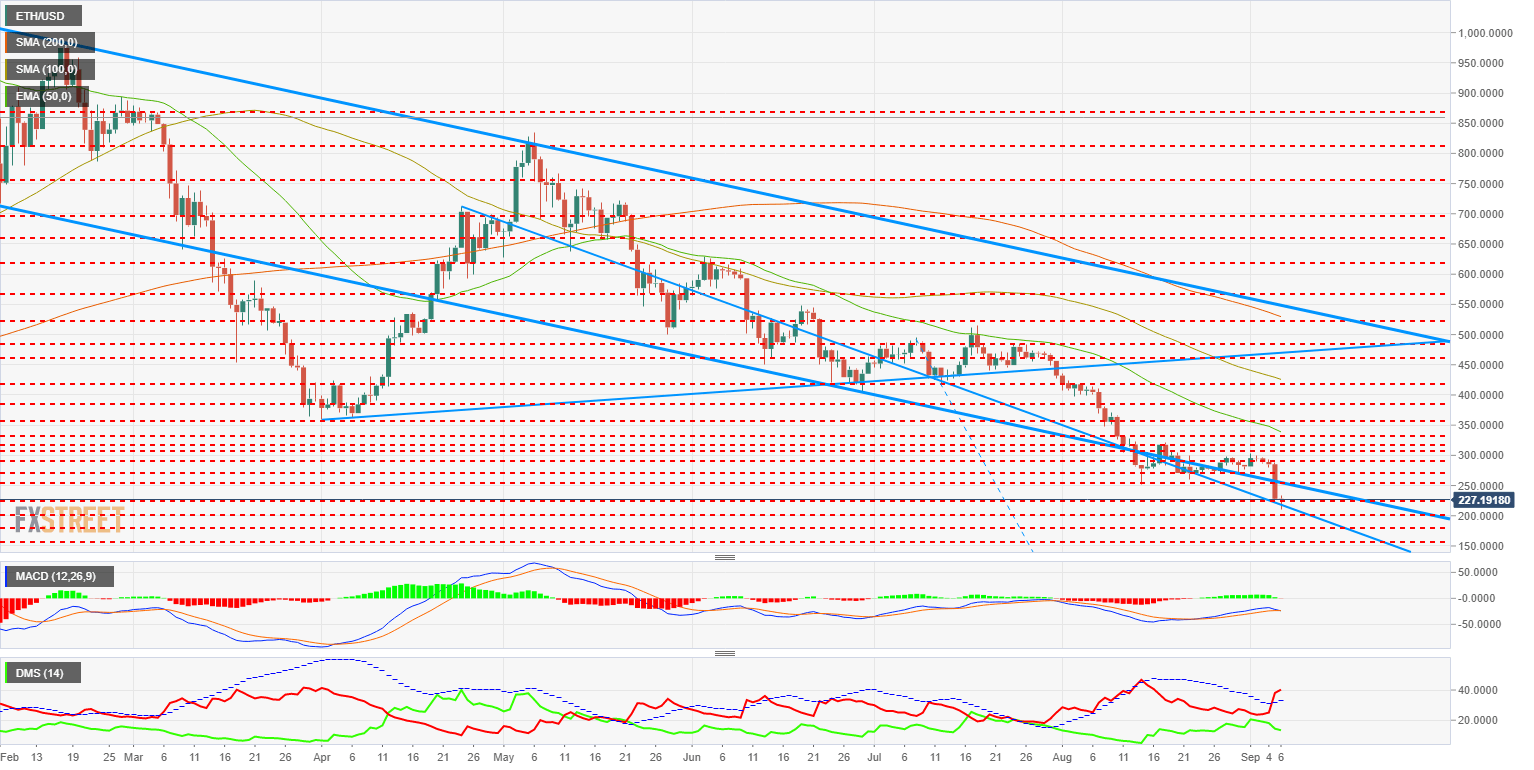
The ETH/USD is in a borderline situation and has no margin for error. Yesterday's fall brought the price to the $220 price level. Very early on today, it left the minimum at $211 and has now returned to the $220 range. The current figure is bullish again but there are many hours ahead to undo it. Keep in mind that in its correlation with Bitcoin the Ethereum is also in a limit situation.
Above the current price, the first resistance is at $250 (price congestion resistance), followed by the next resistance level at $270 (price congestion resistance). The first major moving average is far away, at $330 (EMA50).
Below the current price, the ETH/USD would enter a scenario of falls and would only find support at levels that were resilient throughout 2017. The first support is at $200 (price congestion support), followed by $180 (price congestion support) and as a third support level we can point out $158 (price congestion support).
The MACD to 1D shows a low cut profile similar to the one we have seen in the Bitcoin. However, there is an important difference. that in the case of the ETH/USD, the crossing takes place in the negative zone of the indicator. For this reason, the bearish bottom of the ETH/USD is even more powerful.
The DMI at 1D shows us how bears increase their advantage over bulls, which decreases their strength but not in the magnitude that the large-scale falls and low price levels would make us expect.
XRP/USD 1-D
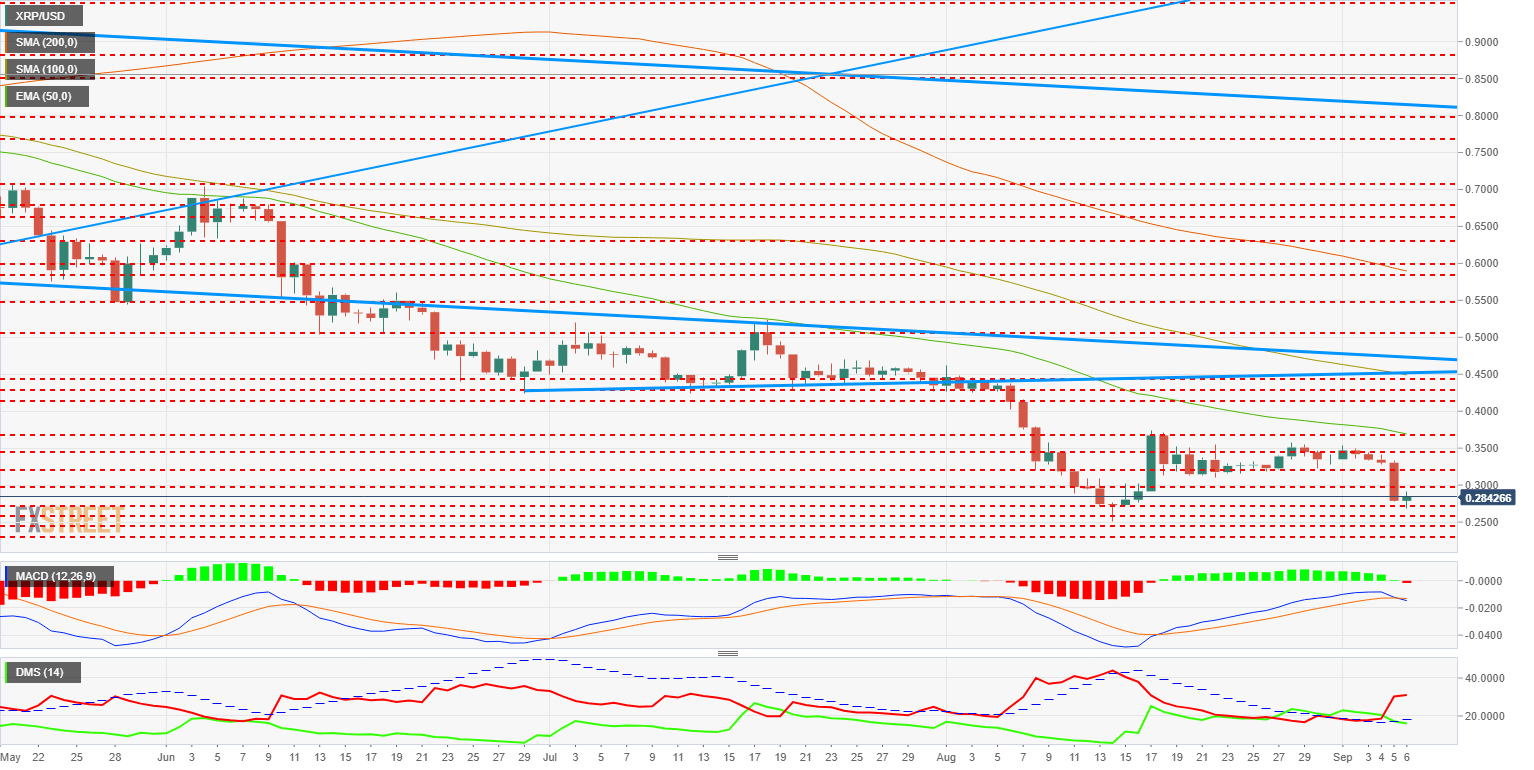
XRP/USD bounces from the low-bottom level of $0.267 recorded on Wednesday. It is still above the minimum left at the end of August, so structurally, the damage has not been as severe as in the case of Ethereum. Today it is drawing a doji although there is a lot of work ahead and everything can happen.
Above the current price, the XRP/USD has the first resistance at the price level of $0.297 (price congestion resistance), followed by $0.320 (price congestion resistance) and as a third target level, we see $0.344 (price congestion resistance). It should be noted that the first moving average is at the price level of $0.3691 (EMA50, price congestion resistance, and range maximum).
Below the current price, the first support is at the price level of $0.271 (price congestion support), followed by $0.259 (price congestion support) and finally $0.251 (relative minimum).

The MACD at 1D crosses down as the indicator in negative territory. The bearish factor is strengthened.
The DMI at 1D shows us the bears are in control and increasing their activity quite a bit, while the bulls slightly decrease their strength, diverging from the price behavior. The ADX follows the bears and increases their activity.
Information on these pages contains forward-looking statements that involve risks and uncertainties. Markets and instruments profiled on this page are for informational purposes only and should not in any way come across as a recommendation to buy or sell in these assets. You should do your own thorough research before making any investment decisions. FXStreet does not in any way guarantee that this information is free from mistakes, errors, or material misstatements. It also does not guarantee that this information is of a timely nature. Investing in Open Markets involves a great deal of risk, including the loss of all or a portion of your investment, as well as emotional distress. All risks, losses and costs associated with investing, including total loss of principal, are your responsibility. The views and opinions expressed in this article are those of the authors and do not necessarily reflect the official policy or position of FXStreet nor its advertisers. The author will not be held responsible for information that is found at the end of links posted on this page.
If not otherwise explicitly mentioned in the body of the article, at the time of writing, the author has no position in any stock mentioned in this article and no business relationship with any company mentioned. The author has not received compensation for writing this article, other than from FXStreet.
FXStreet and the author do not provide personalized recommendations. The author makes no representations as to the accuracy, completeness, or suitability of this information. FXStreet and the author will not be liable for any errors, omissions or any losses, injuries or damages arising from this information and its display or use. Errors and omissions excepted.
The author and FXStreet are not registered investment advisors and nothing in this article is intended to be investment advice.
Recommended Content
Editors’ Picks
Crypto Today: Bitcoin is less than 10% away from all-time high as Ethereum ETF approval anticipation brews

Bitcoin trades around $68,000 early on Monday, less than 10% away from its all-time high of $73,777 on Binance. Ethereum ETF anticipation brews among traders and Ether investment products see inflow of over $45 million in the past week.
Ripple lawsuit settlement likely soon, says Brad Garlinghouse, XRP hovers around $0.60

Ripple (XRP) trades around a key psychological level of $0.60, early on Monday. The altcoin recently made headlines for its highest weekly gain of 2024, over 40%. XRP sustained nearly 21% of the gains from the last seven days.
Solana could cross $200 if these three conditions are met

Solana’s total value locked climbs 18% in July to $5.38 billion, as seen on DeFiLlama. Solana sustains over 20% gains in the past seven days, corrects nearly 3% on Monday. Active addresses and new address count in the Solana network have increased throughout July.
ALT, WLD, ENA, ID set for $200 million token unlocks next week

The crypto market is set to experience another wave of token unlocks next week, with Altlayer (ALT), Worldcoin (WLD), Ethena (ENA), and Space ID (ID) set for a combined token unlock worth about $200 million.
Bitcoin: Will BTC continue its bullish momentum?

Bitcoin (BTC) price increased by 5.5% this week until Friday after breaking above a descending trendline. Currently, it is trading slightly higher by 0.23% at $64,166.
