- Bitcoin price gets squeezed between the trendlines of a symmetrical triangle pattern.
- Ethereum price likely to have a pullback into its major support area between $3,400 and $3,200.
- Ripple price is poised to end the 50-day consolidation between $0.467 and $0.571 range.
Bitcoin (BTC) price consolidates in a symmetrical triangle pattern, showing directional bias. Ripple (XRP) also follows BTC’s footsteps as it continues on its 50-day consolidation streak. Ethereum (ETH) price, on the other hand, shows signs of an incoming correction.
Bitcoin price ready for triangle breakout
Bitcoin price has produced three lower highs and higher lows since May 19. Connecting these swing points using a trend line reveals a symmetrical triangle formation in the 4-hour chart. This technical pattern has no bias, and the target is obtained by adding the triangle’s height to the breakout point.
Assuming BTC triggers a bullish breakout at roughly $67,700, the height of the triangle sets the target near $73,777, its all-time high.
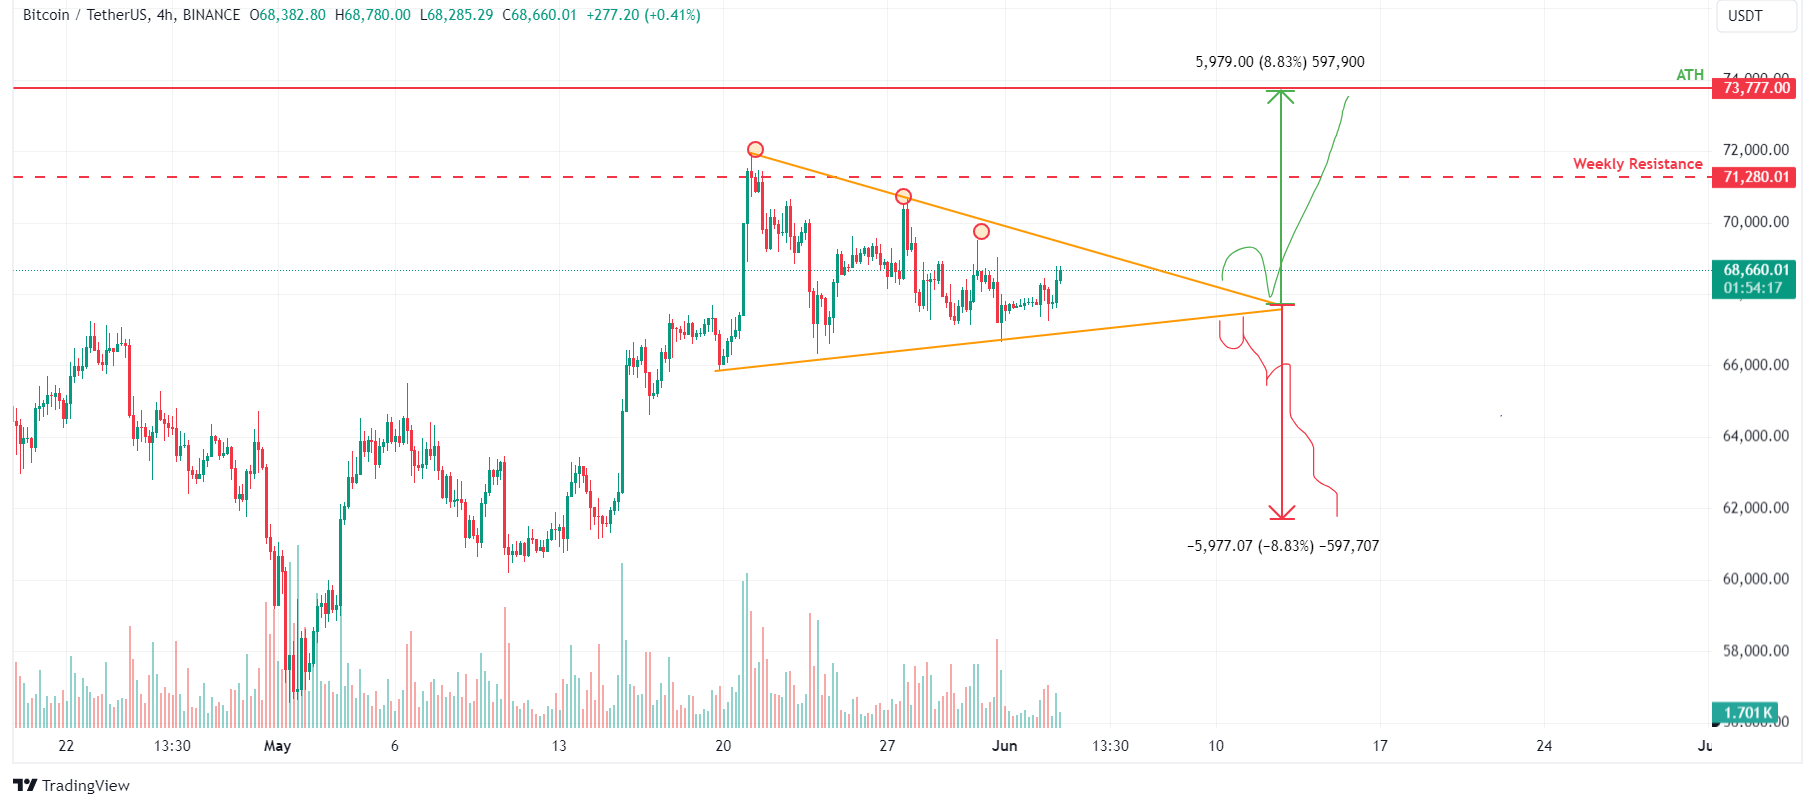
BTC/USDT 4-hour chart
However, if BTC breaks the upward trendline of the triangle and closes below $67,700, the bullish thesis could be invalidated, leading to a crash of 8%, which is the technical target given by the height of the triangle, to $61,734.
Ethereum price looks promising
Ethereum's price broke above a falling wedge pattern in the 4-hour chart on May 20 and rallied 21%. However, the bearish order block from March 12, extending from $3,980 to $4,093, is rejecting ETH price.
Investors looking to buy ETH could do so at the following levels:
- At the 50% Fibonacci retracement level, drawn from the swing high of $3,984 on May 27 to the swing low of $2,864 on May 13, at $3,424.
- At the 61.8% Fibonacci retracement level of the same movement at $3,279.
If the conditions mentioned above are to play out, then the Ethereum price could revisit its previous resistance level at $4,000.
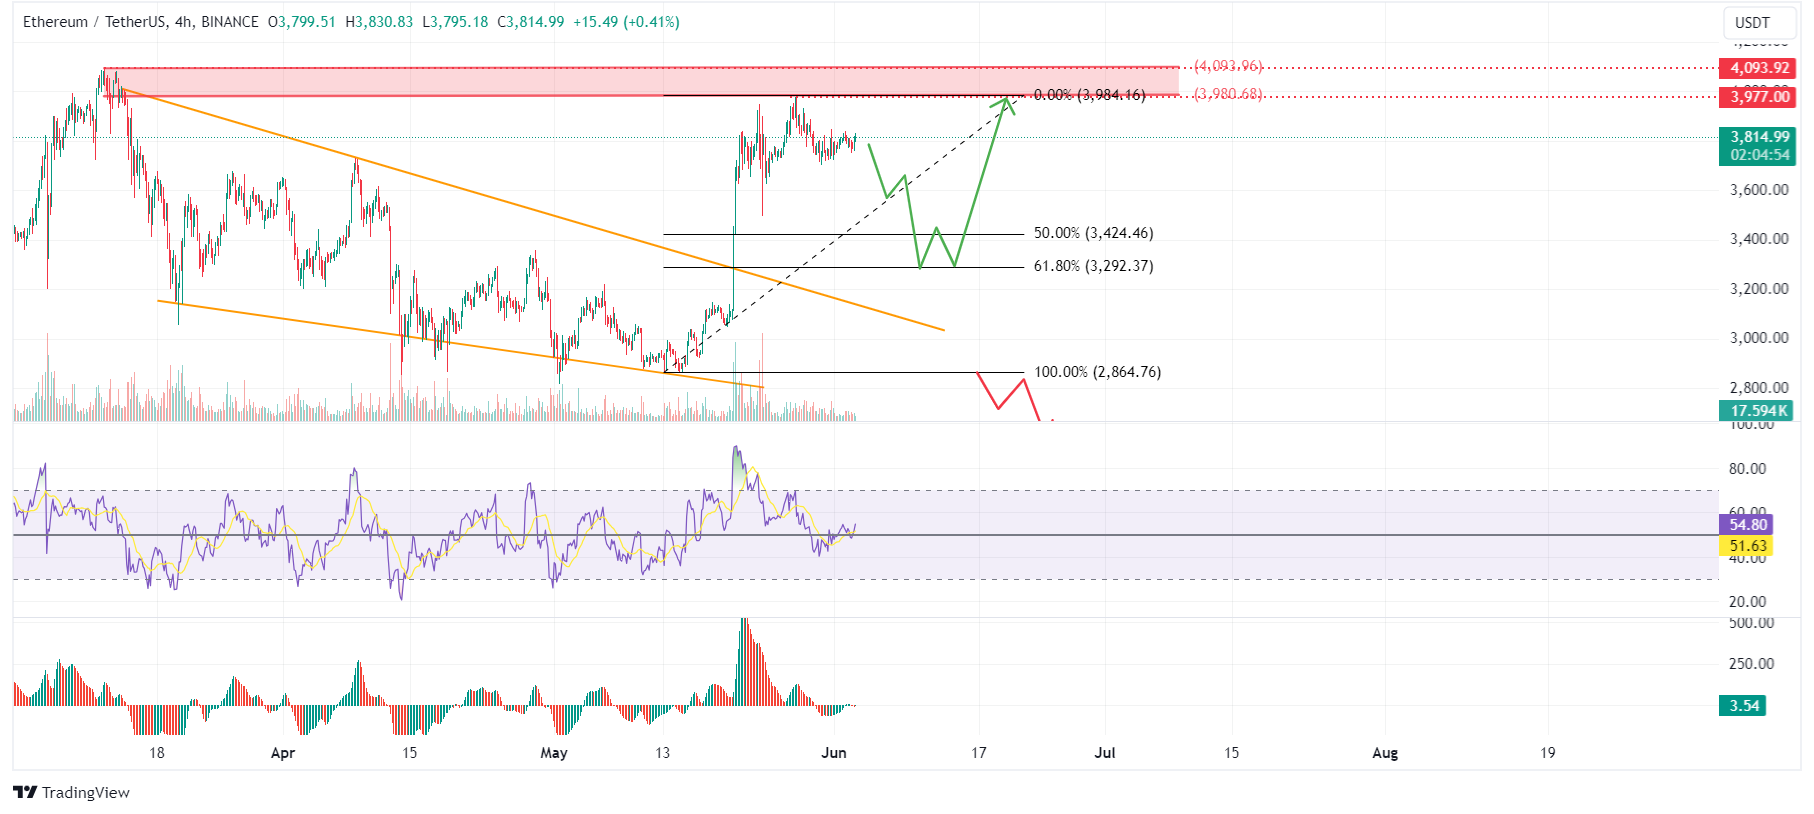
ETH/USDT 4-hour chart
On the other hand, if Ethereum's daily candlestick price closes below the $2,864 level, it would produce a lower low and signal a break in the market structure. This move would invalidate the aforementioned bullish thesis, potentially triggering an extra 9% crash to the previous support level of $2,600.
Ripple price to end the consolidation phase
Ripple price is currently consolidating between $0.571 and $0.467 after a major 33% fall in mid-April. This 49-day consolidation has seen XRP volume weakening.
If Ripple price breaks above $0.571 and the 50% Fibonacci retracement level from the swing high of $0.744 on March 11 to the swing low of $0.419 on April 14 at $0.581, it could rally 8% to revisit the 61.8% Fibonacci retracement at $0.621.
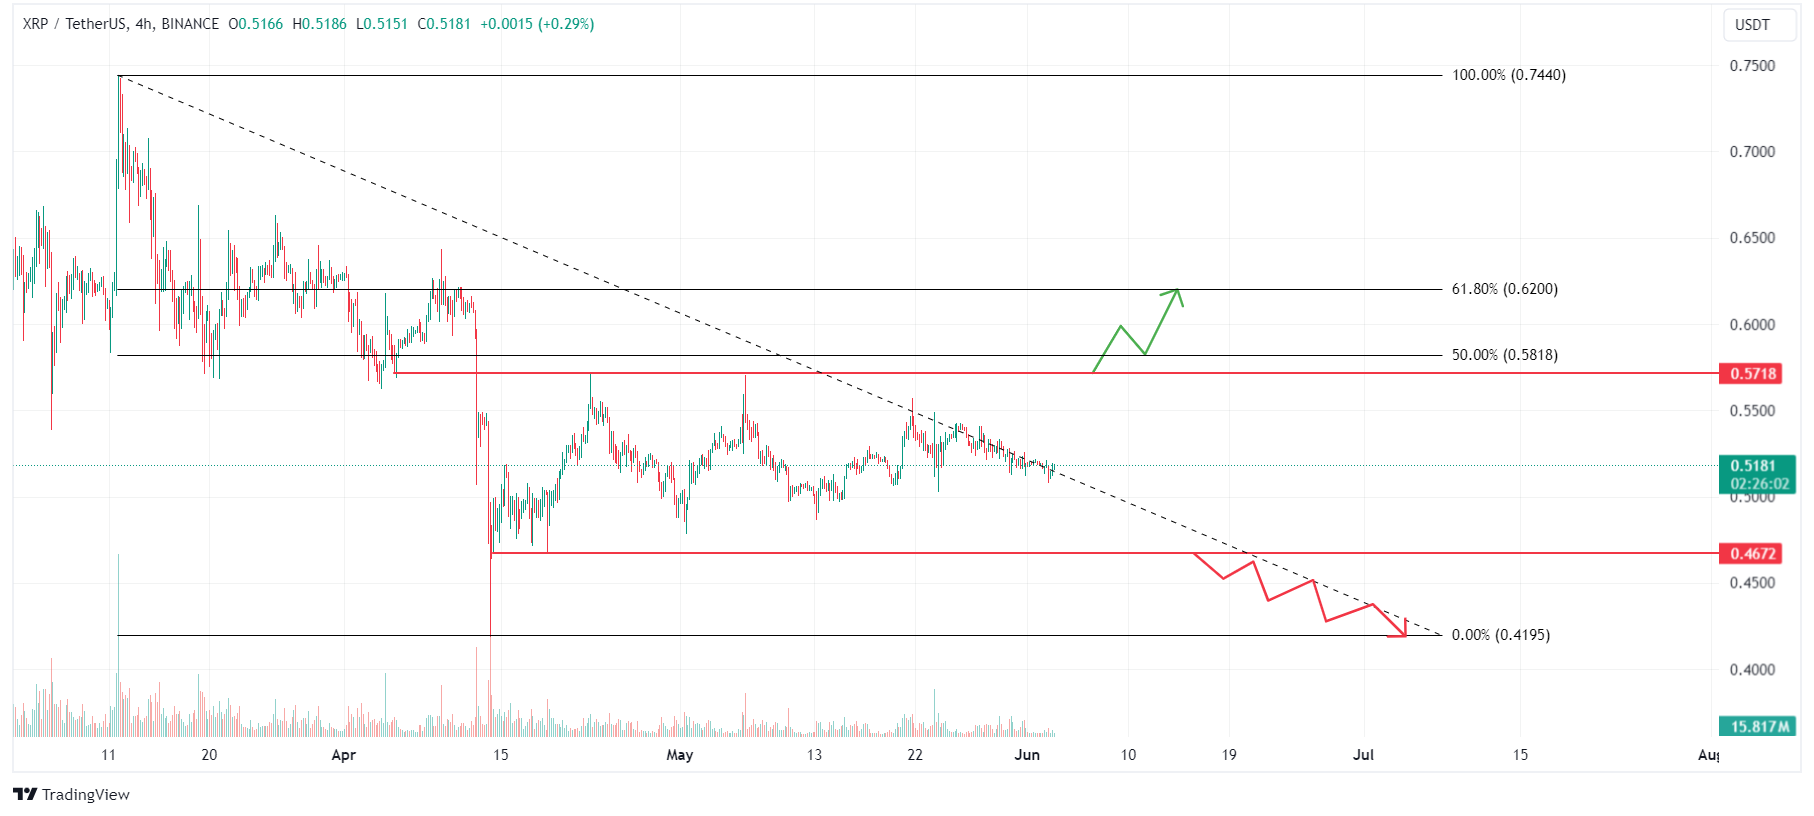
XRP/USDT 4-hour chart
However, if the Ripple daily candlestick closes below $0.467, then XRP could crash an additional 10% to its previous support at $0.419.
Information on these pages contains forward-looking statements that involve risks and uncertainties. Markets and instruments profiled on this page are for informational purposes only and should not in any way come across as a recommendation to buy or sell in these assets. You should do your own thorough research before making any investment decisions. FXStreet does not in any way guarantee that this information is free from mistakes, errors, or material misstatements. It also does not guarantee that this information is of a timely nature. Investing in Open Markets involves a great deal of risk, including the loss of all or a portion of your investment, as well as emotional distress. All risks, losses and costs associated with investing, including total loss of principal, are your responsibility. The views and opinions expressed in this article are those of the authors and do not necessarily reflect the official policy or position of FXStreet nor its advertisers. The author will not be held responsible for information that is found at the end of links posted on this page.
If not otherwise explicitly mentioned in the body of the article, at the time of writing, the author has no position in any stock mentioned in this article and no business relationship with any company mentioned. The author has not received compensation for writing this article, other than from FXStreet.
FXStreet and the author do not provide personalized recommendations. The author makes no representations as to the accuracy, completeness, or suitability of this information. FXStreet and the author will not be liable for any errors, omissions or any losses, injuries or damages arising from this information and its display or use. Errors and omissions excepted.
The author and FXStreet are not registered investment advisors and nothing in this article is intended to be investment advice.
Recommended Content
Editors’ Picks

Axiom’s volume surpasses $100M as meme trading platform war escalates on Solana
Axiom meme coin trading volume hit $101 million for the first time, surpassing other platforms on Solana. Axiom accounts for 30% of the ecosystem’s trading users, followed by Photon and Bullx at 24% each.

Bitcoin aiming for $95,000 as Global M2 money supply surges
Bitcoin (BTC) price edges higher and trades slightly above $85,500 at the time of writing on Tuesday after recovering nearly 7% the previous week. The rising Global M2 money supply could be a favorable signal for both Gold and Bitcoin.

Top 3 gainers Brett, Story and Virtuals Protocol sparkle as Bitcoin eyes $90,000
Cryptocurrencies have sustained a buoyant outlook since last week as US President Donald Trump’s tariff war was paused for 90 days, except for China, propping global markets for lifeline relief rallies.

Three altcoins to watch this week: ALGO, MANA and JASMY show bullish signs
Algorand, Decentraland and JasmyCoin hovers around $0.19, $0.27, and $0.015 on Tuesday after a double-digit recovery last week. ALGO, MANA and JASMY approach their key resistance levels; breakout suggests a rally ahead.

Bitcoin Weekly Forecast: Market uncertainty lingers, Trump’s 90-day tariff pause sparks modest recovery
Bitcoin (BTC) price extends recovery to around $82,500 on Friday after dumping to a new year-to-date low of $74,508 to start the week. Market uncertainty remains high, leading to a massive shakeout, with total liquidations hitting $2.18 billion across crypto markets.

The Best brokers to trade EUR/USD
SPONSORED Discover the top brokers for trading EUR/USD in 2025. Our list features brokers with competitive spreads, fast execution, and powerful platforms. Whether you're a beginner or an expert, find the right partner to navigate the dynamic Forex market.