- Bitcoin price hovers above the $58,700 level; a close below would continue its bearish trend.
- Ethereum price finds resistance around its trendline pullback, eyeing a decline ahead.
- Ripple price finds support around the 200-day EMA at $0.552; a slip below would signal a bearish move on the horizon.
Bitcoin (BTC) and Ripple (XRP) prices hover around their critical support level; closing below could signal a decline ahead. While the Ethereum (ETH) price finds rejection around its resistance level, eyeing a bearish move on the horizon.
Bitcoin price is set for a downleg if it breaks below $58,700 level
Bitcoin price was rejected around the daily resistance level at $65,379 on Sunday, declining by 8% in the next three days. At the time of writing, on Friday, it hovers around the $59,306 level.
If BTC continues to decline and closes below the $58,783 level, it could fall further by 4.5% to retest its daily support at $56,002.
The Relative Strength Index (RSI) and the Awesome Oscillator (AO) on the daily chart have slipped below their neutral level of 50 and zero, respectively. Both indicators suggest a weak momentum and an impending bearish trend.
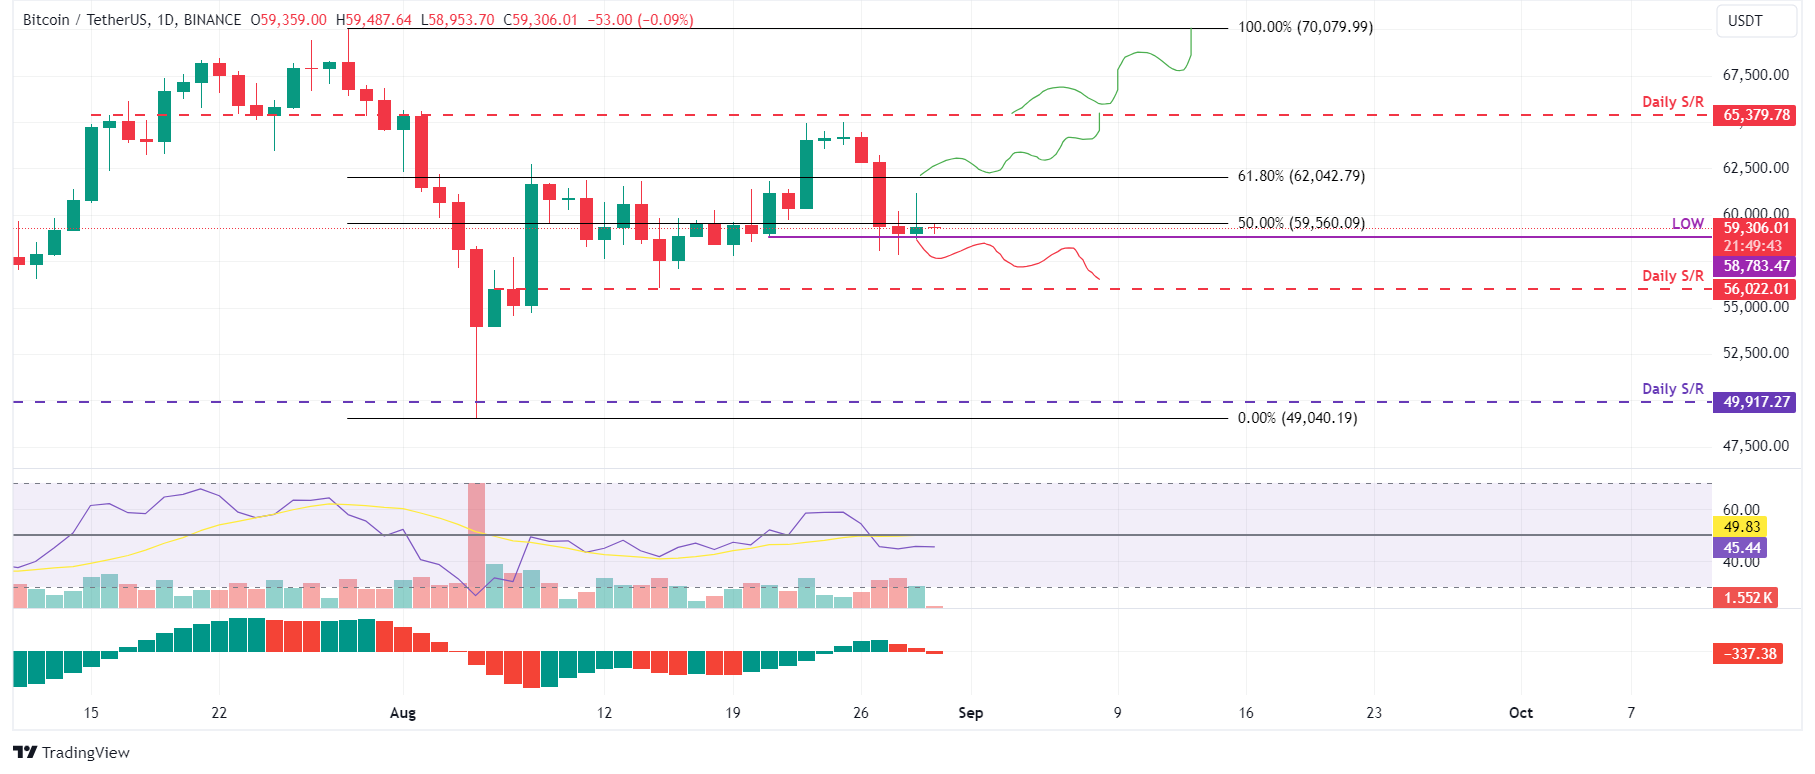
BTC/USDT daily chart
However, suppose Bitcoin's price finds support at around $58,700 and closes above $62,042, its 61.8% Fibonacci retracement level (drawn from a high in late July to a low in early August), the bearish thesis will be invalidated. BTC could rise by 5.5% to revisit its daily resistance level at $65,379.
Ethereum price is poised for a downward trend after retesting its resistance barrier
Ethereum price retested its broken ascending trendline around $2,619 on Thursday and faced resistance around it. This trend line was formed by connecting multiple low levels from August 7. As of Friday, it continues to trade slightly down by 0.4% at $2,516.
If the previously broken ascending trendline at $2,619 continues to act as resistance, ETH could further decline 6% to retest its August 8 low of $2,327.
The daily chart's RSI and AO are trading below the neutral levels of 50 and zero. These momentum indicators strongly indicate bearish dominance.
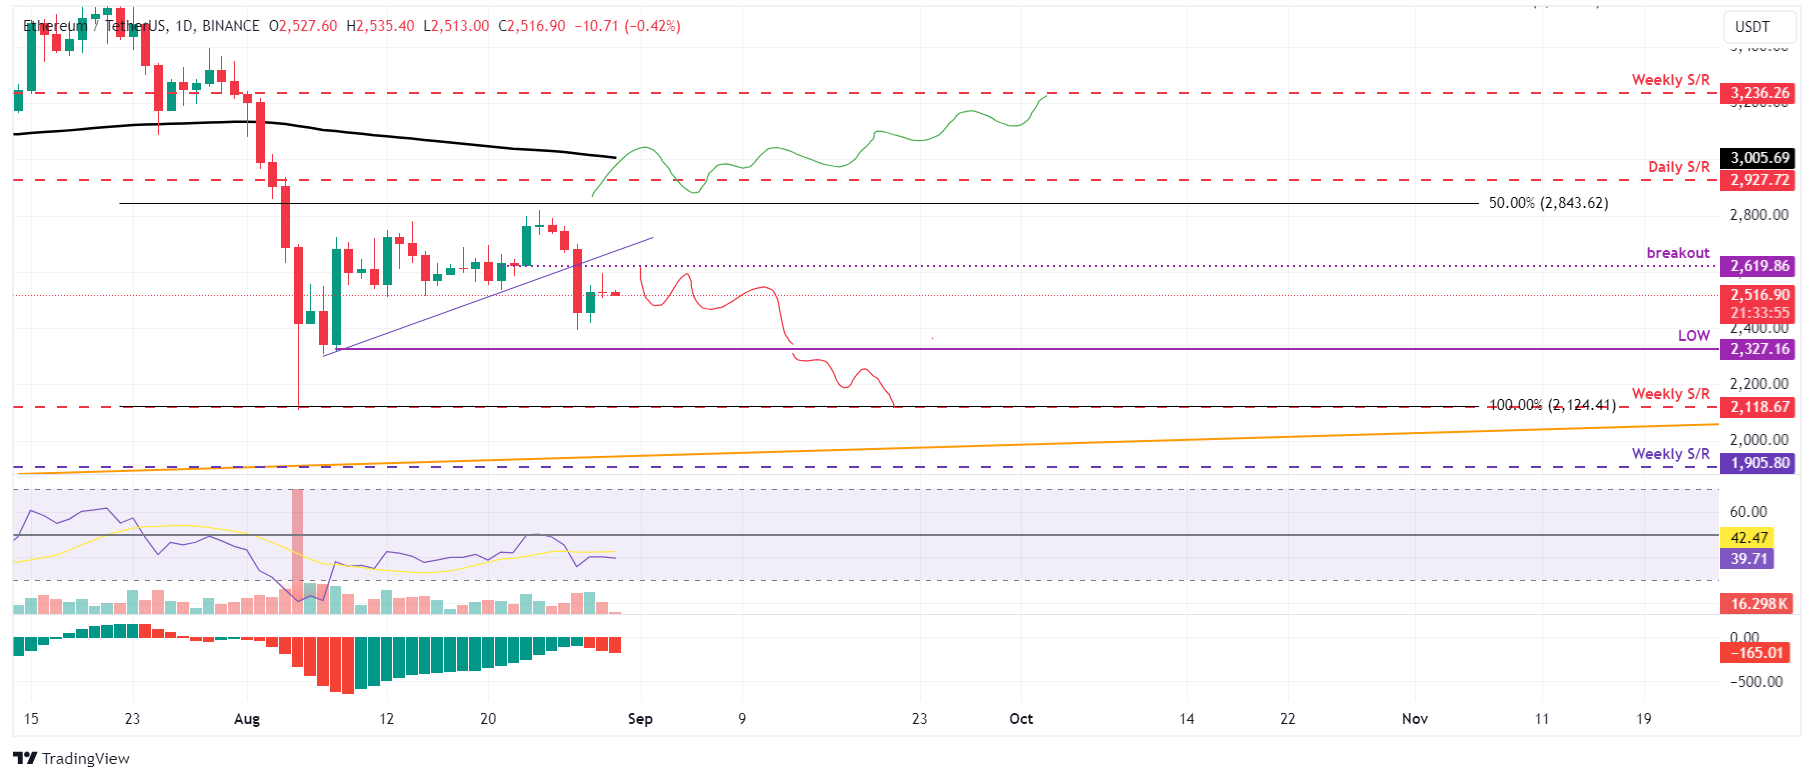
ETH/USDT daily chart
If ETH breaks above the $2,619 level and closes above the daily resistance at $2,927, forming a higher high on the daily chart, this would invalidate the bearish thesis, and it could rally 11% to retest its weekly resistance level at $3,236.
Ripple price is at risk of decline if it falls below the 200-day EMA
Ripple price found support around the 200-day Exponential Moving Average (EMA) at $0.552 after being rejected by its daily resistance level of $0.626 on August 24. As of Friday, it trades slightly up by 0.4% to $0.564.
If XRP breaks below the 200-day EMA and closes below $0.544, its daily support level, it could decline by 10% to retest its August 7 low of $0.492.
The RSI and AO are trading below the neutral levels of 50 and zero on the daily chart. These momentum indicators strongly indicate bearish dominance and impending decline on the horizon.
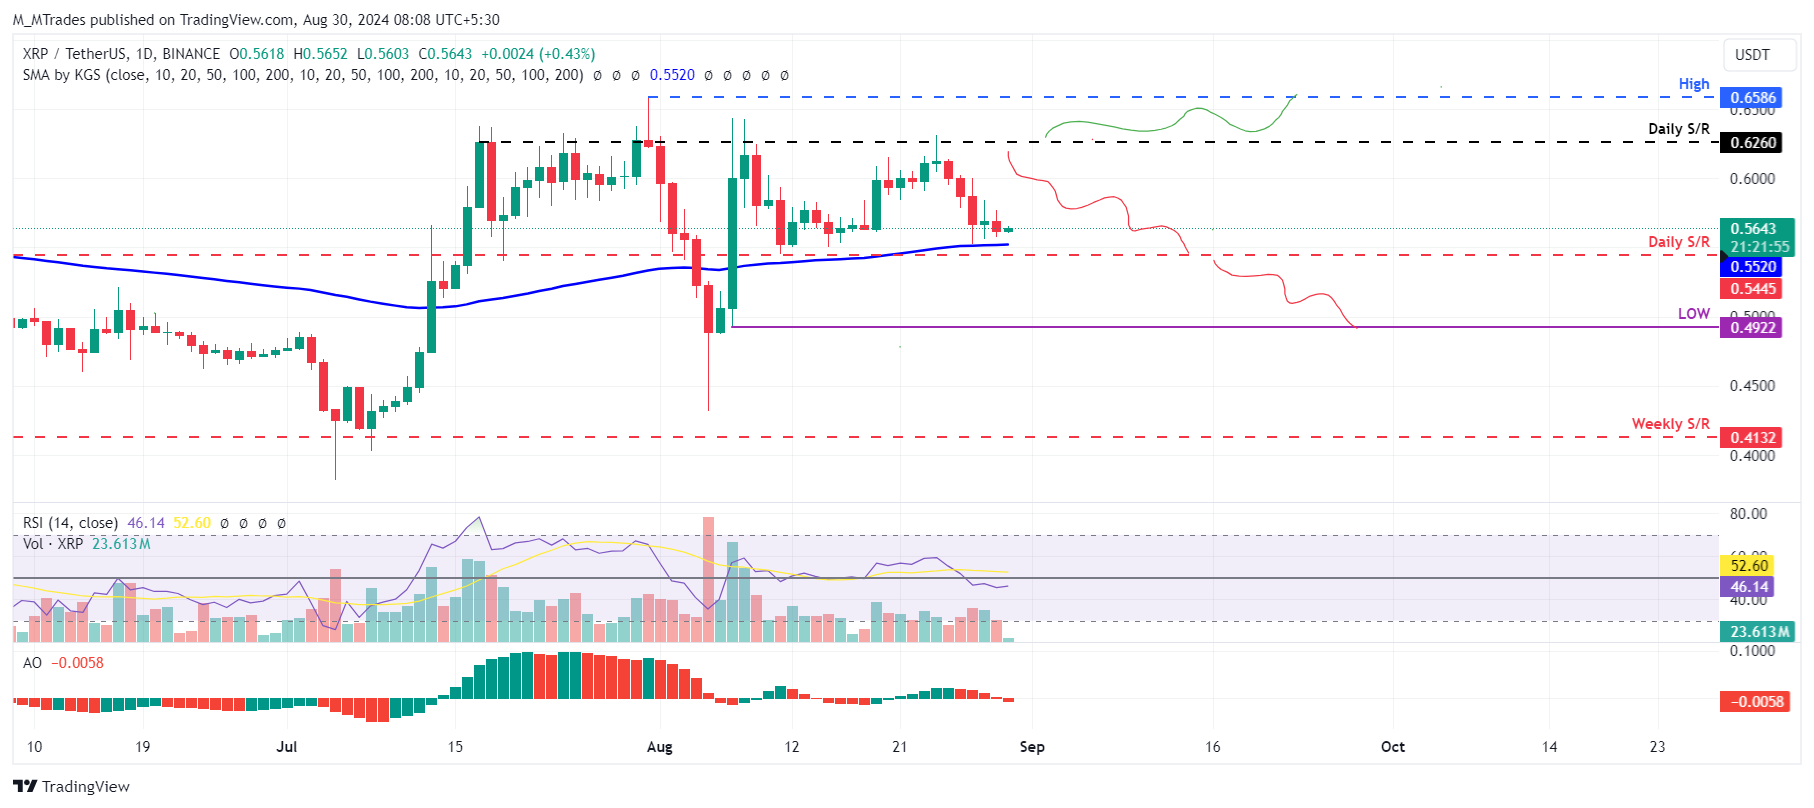
XRP/USDT daily chart
However, if the Ripple price closes above the $0.626 daily resistance level, it would shift the market structure by creating a higher high on the daily chart, potentially leading to a 5.3% rise to revisit the July 31 high of $0.658.
Cryptocurrency metrics FAQs
The developer or creator of each cryptocurrency decides on the total number of tokens that can be minted or issued. Only a certain number of these assets can be minted by mining, staking or other mechanisms. This is defined by the algorithm of the underlying blockchain technology. Since its inception, a total of 19,445,656 BTCs have been mined, which is the circulating supply of Bitcoin. On the other hand, circulating supply can also be decreased via actions such as burning tokens, or mistakenly sending assets to addresses of other incompatible blockchains.
Market capitalization is the result of multiplying the circulating supply of a certain asset by the asset’s current market value. For Bitcoin, the market capitalization at the beginning of August 2023 is above $570 billion, which is the result of the more than 19 million BTC in circulation multiplied by the Bitcoin price around $29,600.
Trading volume refers to the total number of tokens for a specific asset that has been transacted or exchanged between buyers and sellers within set trading hours, for example, 24 hours. It is used to gauge market sentiment, this metric combines all volumes on centralized exchanges and decentralized exchanges. Increasing trading volume often denotes the demand for a certain asset as more people are buying and selling the cryptocurrency.
Funding rates are a concept designed to encourage traders to take positions and ensure perpetual contract prices match spot markets. It defines a mechanism by exchanges to ensure that future prices and index prices periodic payments regularly converge. When the funding rate is positive, the price of the perpetual contract is higher than the mark price. This means traders who are bullish and have opened long positions pay traders who are in short positions. On the other hand, a negative funding rate means perpetual prices are below the mark price, and hence traders with short positions pay traders who have opened long positions.
Information on these pages contains forward-looking statements that involve risks and uncertainties. Markets and instruments profiled on this page are for informational purposes only and should not in any way come across as a recommendation to buy or sell in these assets. You should do your own thorough research before making any investment decisions. FXStreet does not in any way guarantee that this information is free from mistakes, errors, or material misstatements. It also does not guarantee that this information is of a timely nature. Investing in Open Markets involves a great deal of risk, including the loss of all or a portion of your investment, as well as emotional distress. All risks, losses and costs associated with investing, including total loss of principal, are your responsibility. The views and opinions expressed in this article are those of the authors and do not necessarily reflect the official policy or position of FXStreet nor its advertisers. The author will not be held responsible for information that is found at the end of links posted on this page.
If not otherwise explicitly mentioned in the body of the article, at the time of writing, the author has no position in any stock mentioned in this article and no business relationship with any company mentioned. The author has not received compensation for writing this article, other than from FXStreet.
FXStreet and the author do not provide personalized recommendations. The author makes no representations as to the accuracy, completeness, or suitability of this information. FXStreet and the author will not be liable for any errors, omissions or any losses, injuries or damages arising from this information and its display or use. Errors and omissions excepted.
The author and FXStreet are not registered investment advisors and nothing in this article is intended to be investment advice.
Recommended Content
Editors’ Picks

Bitcoin, Ethereum and XRP steady as China slaps 125% tariff on US, weekend sell-off looming?
The Cryptocurrency market shows stability at the time of writing on Friday, with Bitcoin (BTC) holding steady at $82,584, Ethereum (ETH) at $1,569, and Ripple (XRP) maintaining its position above $2.00.

Bitcoin Weekly Forecast: Market uncertainty lingers, Trump’s 90-day tariff pause sparks modest recovery
Bitcoin price extends recovery to around $82,500 on Friday after dumping to a new year-to-date low of $74,508 to start the week. Market uncertainty remains high, leading to a massive shakeout, with total liquidations hitting $2.18 billion across crypto markets.

Bitcoin, Ethereum, Dogecoin and Cardano stabilze – Why crypto is in limbo
Bitcoin, Ethereum, Dogecoin and Cardano stabilize on Friday as crypto market capitalization steadies around $2.69 trillion. Crypto traders are recovering from the swing in token prices and the Monday bloodbath.

Can FTX’s 186,000 unstaked SOL dampen Solana price breakout hopes?
Solana price edges higher and trades at $117.31 at the time of writing on Friday, marking a 3.4% increase from the $112.80 open. The smart contracts token corrected lower the previous day, following a sharp recovery to $120 induced by US President Donald Trump’s 90-day tariff pause on Wednesday.
Bitcoin Weekly Forecast: Market uncertainty lingers, Trump’s 90-day tariff pause sparks modest recovery
Bitcoin (BTC) price extends recovery to around $82,500 on Friday after dumping to a new year-to-date low of $74,508 to start the week. Market uncertainty remains high, leading to a massive shakeout, with total liquidations hitting $2.18 billion across crypto markets.

The Best brokers to trade EUR/USD
SPONSORED Discover the top brokers for trading EUR/USD in 2025. Our list features brokers with competitive spreads, fast execution, and powerful platforms. Whether you're a beginner or an expert, find the right partner to navigate the dynamic Forex market.