Top 3 Price Prediction Bitcoin, Ethereum, Ripple: Bitcoin sells 2020 top, crypto market bull run hits pause
- Bitcoin price slumps from 2020 high as selling pressure intensifies the call to $16,500.
- Ethereum correction at tipping point; sliding below the 50 SMA could send it to $440 major support.
- Ripple bulls are busy hunting for higher support to protect the gains accrued this week and reignite the uptrend.

The cryptocurrency market uphill battle to new yearly highs, especially for Bitcoin, is unlikely to stop soon. However, what goes up must come down, at least according to science. Note that in markets, demand areas are likely to control the potential correction.
Bitcoin seems to have activated thrust reversers after hitting a recent yearly high at $18,500. The retreat has affected most of the crypto assets in the top 50, leaving a dominant red paint.
Ethereum is fighting for support above $470 while Ripple closed the day under $0.29. If bulls do not resume the uptrend across the board, selling pressure is likely to surge in the coming sessions.
Bitcoin correction eyes $16,500
The flagship cryptocurrency has been rejected from the yearly high at $18,500. The move has also thrown buyers slightly off-balance, thus the price action below $18,000. At the time of writing, Bitcoin is dancing at $17,625 as the bearish momentum continues to gain traction.
Meanwhile, if Bitcoin falls below the initial support at $17,500, BTC might plunge further. The most formidable point of contact would be the 50 Simple Moving Average in the 4-hour timeframe.
On the other hand, the Relative Strength Index bearish divergence after hitting a higher high in the overbought region and a higher low reinforced the bearish outlook. The 100 SMA, at $15,714, and the 200 SMA, at 14,300, are other key support levels to keep in mind.
 (65)-637413756834963854.png)
BTC/USD 4-hour chart
The TD Sequential indicator has presented a sell signal on the daily chart. The bearish formation was illustrated in a green nine candlestick. Normally, this indicator pictures that a rise in supply against BTC may result in the price falling for one to four daily candlesticks. A massive correction may also resume selling pressure and increased the headwind against Bitcoin.
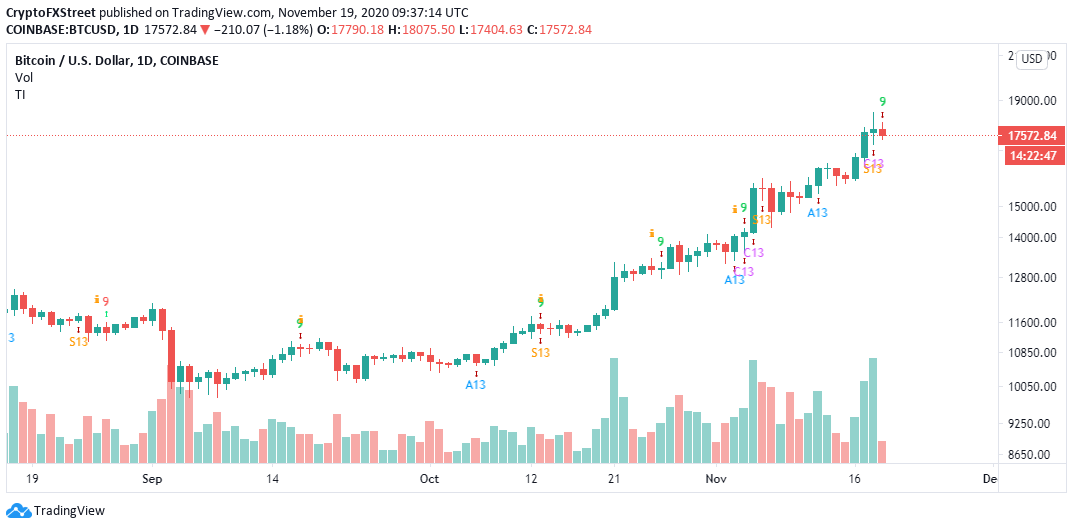
BTC/USD daily chart
It is important to note that the bearish outlook will be invalidated if Bitcoin closed the day above $17,500. This way, buyers will have enough time to prepare for a liftoff past $18,000.
Ethereum slides to a make-or-break point
The smart contract token has failed to resume the uptrend above the ascending parallel channel middle boundary. The price has also slipped under $470 and is now sitting slightly above the 50 SMA on the 4-hour chart.
Holding above this crucial level might help the bulls resume the uptrend towards $480. Moreover, a daily close above the channel's middle layer would help refocus the bulls' attention to $500.
 - 2020-11-19T120741.749-637413757855899804.png)
ETH/USD 4-hour chart
In the meantime, if Ether slides under the 50 SMA, massive sell orders would be triggered, opening the door to losses eying $460. The RSI in the same 4-hour timeframe doubles down on the impending breakdown, mainly due to retreat from the overbought territory to the midline.
Similarly, the channel's lower boundary must stay intact; otherwise, declines could extend to the 100 SMA at $445 and the primary support at $440.
Ripple hunting for a higher support
XRP bulls have one single mission; to find relatively higher support. This will help in protecting the gains made this week. Moreover, the support will allow the bulls to focus on renewing the uptrend beyond $0.3.
For now, the path of least resistance seems downwards, especially with the RSI diving fast to the midline from the overbought territory. The cross-border token will likely find support at $0.28. However, if push comes to shove, XRP may extend the bearish leg to the 50 SMA, at $0.275.
The 4-hour chart brings to light other vital support levels, including $0.27, the 100 SMA slightly above $0.26 and the 200 SMA at $0.254.
 (2)-637413758510855567.png)
XRP/USD 4-hour chart
The search for formidable support will be invalidated if XRP closes the day above $0.29. Trading above this crucial level may call for more buy orders, creating enough volume to elevate XRP above $0.3.
Author

John Isige
FXStreet
John Isige is a seasoned cryptocurrency journalist and markets analyst committed to delivering high-quality, actionable insights tailored to traders, investors, and crypto enthusiasts. He enjoys deep dives into emerging Web3 tren


