- According to crypto analyst Plan B, the average price level for the next Bitcoin bullish move is beyond $250K.
- The fight for market shares between cryptocurrencies continues and sets the pace of events.
- Volatility is likely to increase in the coming sessions, a trend that could last for months.
The crypto market continues to move forward as if nothing has changed after the halving event. In the previous halvings, the bullish reaction of Bitcoin – and the whole crypto board – only started on average after six months.
A leading analyst in the crypto ecosystem on Twitter, Plan B (https://twitter.com/100trillionUSD), has tweeted its post-halving price forecast for Bitcoin. According to their S2F (Stock to Flow) model, the price of Bitcoin would start a strong upward movement six months after the event (November 2020). Plan B expects BTC/USD to move into a price range around $288000 by 2024.
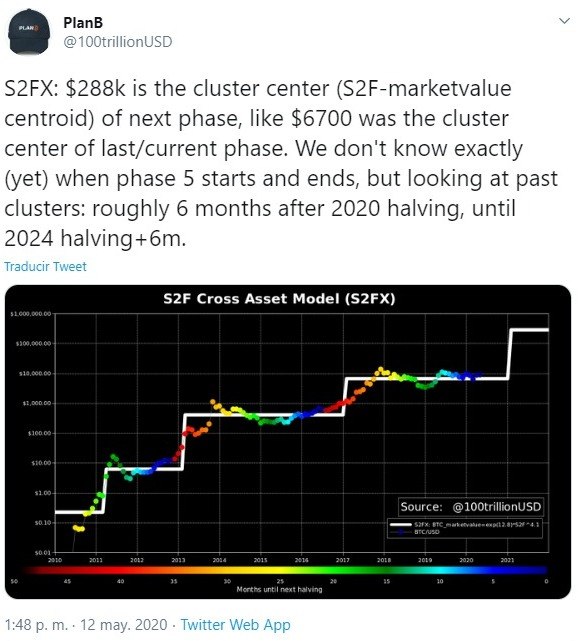
Source: Twitter
The BTC/USD pair tries again this morning to break above the $9000 level without success, while in the case of ETH/USD it is the $190 level that limits a possible recovery from last week's levels. The worst performer in the top 3 is the XRP/USD pair, which lost support in the weekend sell-off and is in a weak position until it breaks through the $0.20 level.
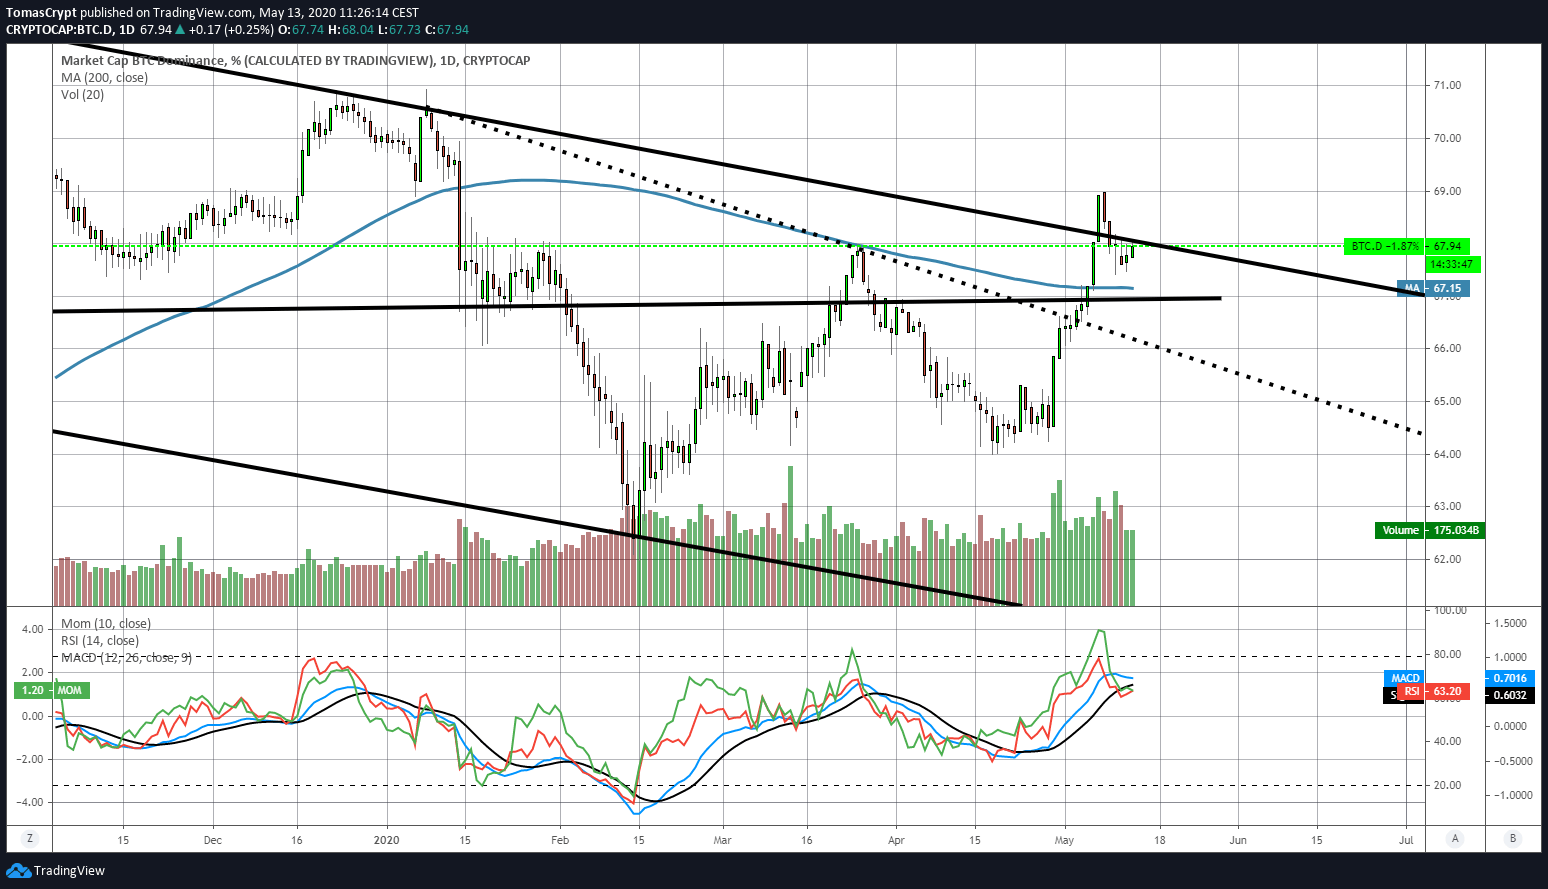
In the dispute for dominance in the crypto market, Bitcoin fails to break the upper limit of the long-term bearish channel. Indicators show potential for a final upward breakout attempt, but not enough to get much distance from current levels.
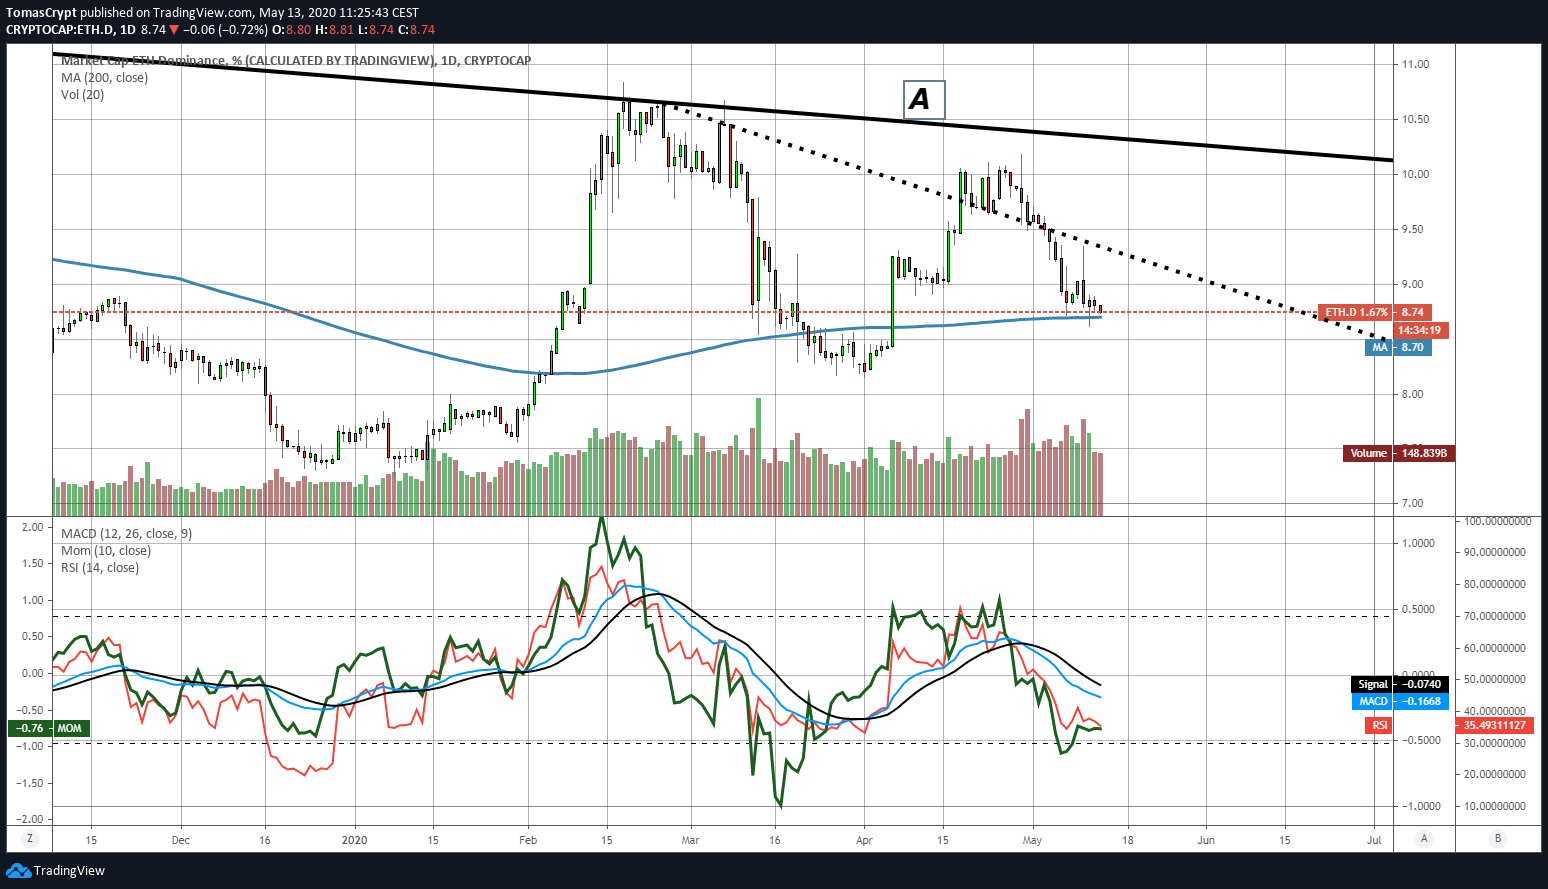
The Ethereum dominance chart shows the other side of the coin and is still waiting on the 200-day moving average to launch its attack. Technical indicators are beginning to show signs of upward pressure, but it seems unlikely that the bullish structure will be complete until the end of this month.
Market sentiment is improving by two points from yesterday, and the 41 level indicates that fear is the dominant factor at the moment.
ETH/BTC Daily Chart
The ETH/BTC pair is currently trading at the price level of 0.0213 and is moving dangerously far away from the 200-day simple moving average. If the downward movement is confirmed, the target would be the 0.0203 level. At this level, a price congestion support and an uptrend line that begins at the January lows converge. The time projection marks the end of this month as the probable date for this – not yet confirmed – bearish movement.
Above the current price, the first resistance level is at 0.221, then the second at 0.227 and the third one at 0.235.
Below the current price, the first support level is at 0.203, then the second at 0.198 and the third one at 0.187.
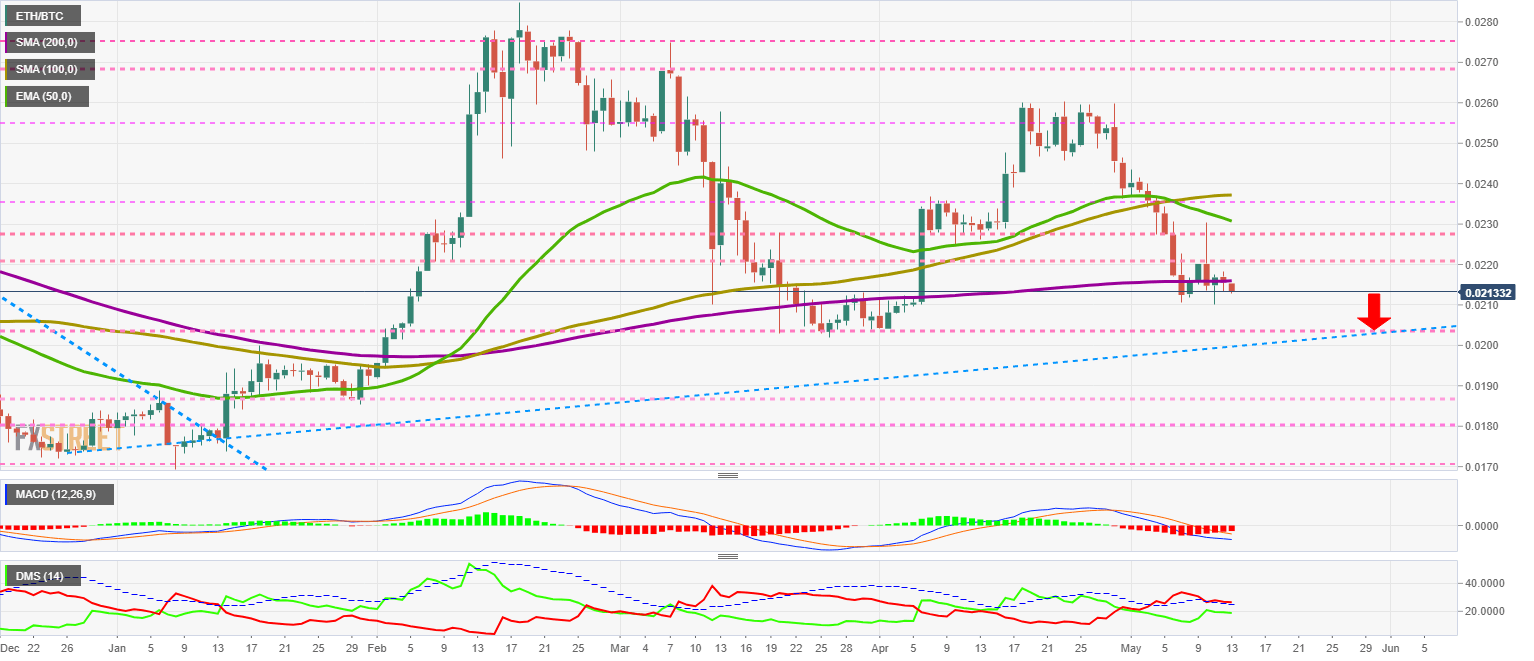
The MACD on the daily chart retains the previous bearish profile. If it improved a little yesterday, it makes the opposite move today and worsens enough to risk the current price levels.
The DMI on the daily chart shows the bears holding well above the ADX line and retains all the downward potential. The bulls remain confident that they can enter the leadership contest and maintain a healthy level of strength.
BTC/USD Daily Chart
The BTC/USD pair is currently trading at the price level of $8906 and is unable to break through the $9000 resistance level. The main moving averages are concentrated around the $8000 level forming a bullish golden cross. This remarkable confluence of key technical indicators is going to have a strong pull on the price, and we may see this level in the BTC/USD pair soon.
Above the current price, the first resistance level is at $9150, then the second at $9650 and the third one at $10,000.
Below the current price, the first support level is at $8800, then the second at $8400 and the third one at $8200.
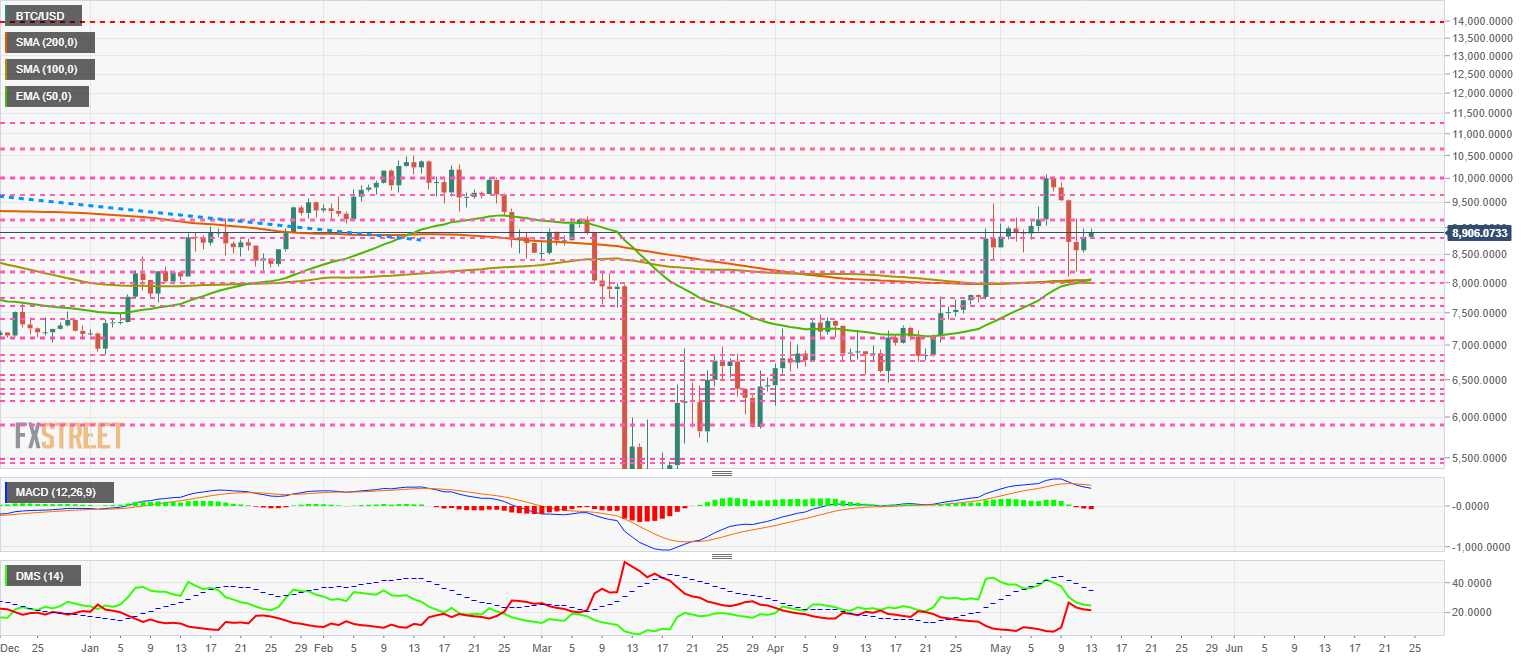
The MACD on the daily chart continues with the bearish setup, although it doesn't increase the slope or the opening between the lines. With the current structure, a short-term upward movement that could undo the bearish cross it's still possible.
The DMI on the daily chart shows both sides of the market following each other tightly. This type of structure can precede a violent movement.
ETH/USD Daily Chart
The ETH/USD pair is currently trading at $190.06. On the upside, the movement is limited y the presence of the 100-day simple moving average at $191.2.
Above the current price, the first resistance level is at $191, then the second at $195 and the third one at $200.
Below the current price, the first support level is at $186, then the second at $180 and the third one at $175.
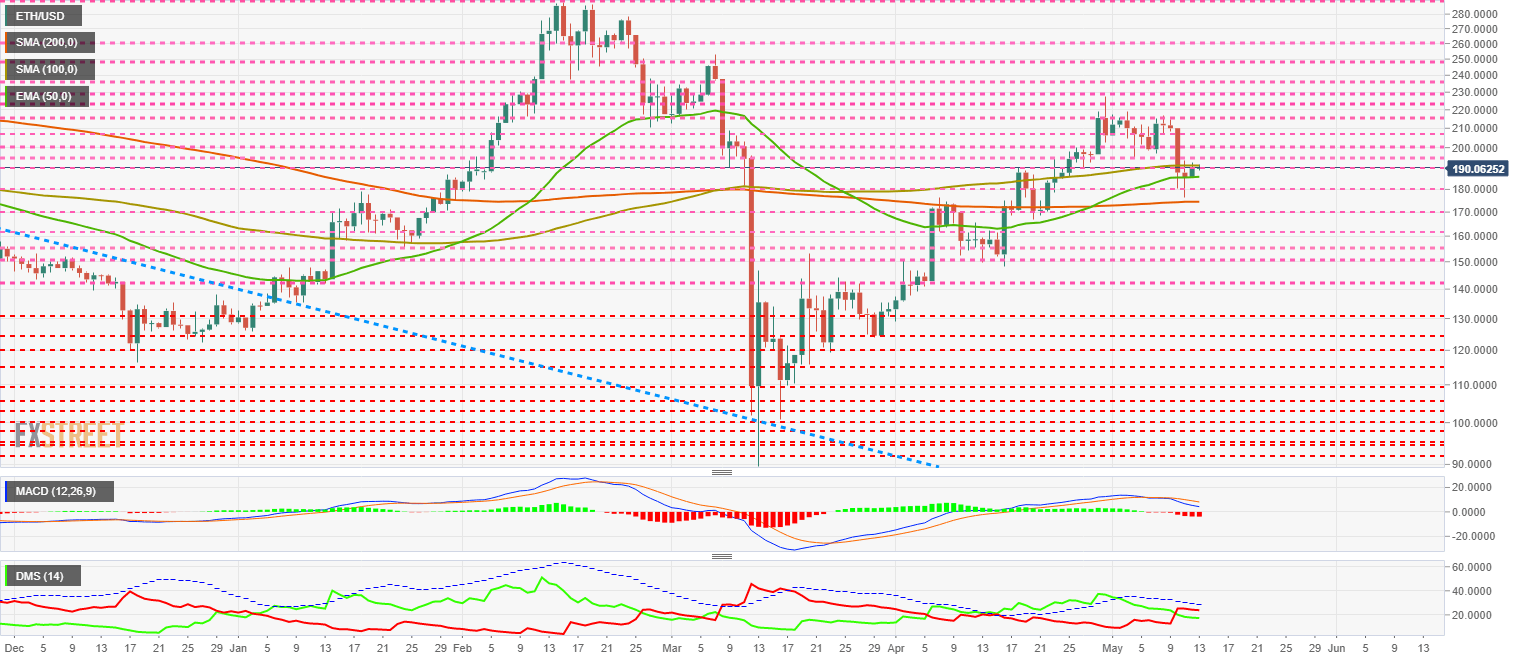
The MACD on the daily chart shows an increase in the bearish momentum.
The DMI on the daily chart shows the bears maintaining control over the bulls, but being unable to break the ADX line, the sell-side does not activate the bearish pattern.
.
XRP/USD Daily Chart
The XRP/USD pair is currently trading at the price level of $0.1980 and appears unable to break through the $0.20 resistance level. The main moving averages continue to point down.
Above the current price, the first resistance level is at $0.20, then the second at $0.218 and the third one at $0.238.
Below the current price, the first support level is at $0.192, then the second at $0.171 and the third one at $0.15.
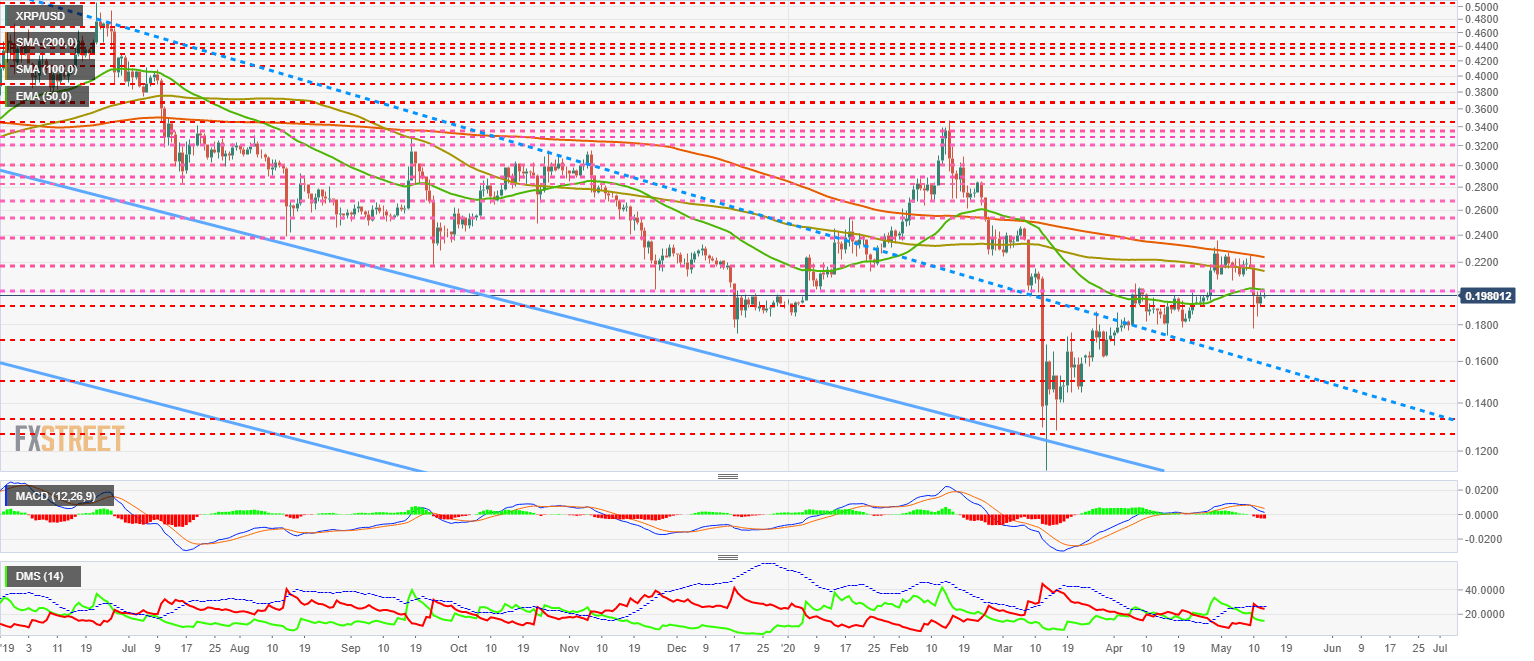
The MACD on the daily chart is approaching the neutral level of the indicator, where it could find support and open a bullish opportunity for XRP.
The DMI on the daily chart shows bears dominating XRP/USD but failing to move above the ADX line. The bulls are still losing strength consistently.
Information on these pages contains forward-looking statements that involve risks and uncertainties. Markets and instruments profiled on this page are for informational purposes only and should not in any way come across as a recommendation to buy or sell in these assets. You should do your own thorough research before making any investment decisions. FXStreet does not in any way guarantee that this information is free from mistakes, errors, or material misstatements. It also does not guarantee that this information is of a timely nature. Investing in Open Markets involves a great deal of risk, including the loss of all or a portion of your investment, as well as emotional distress. All risks, losses and costs associated with investing, including total loss of principal, are your responsibility. The views and opinions expressed in this article are those of the authors and do not necessarily reflect the official policy or position of FXStreet nor its advertisers. The author will not be held responsible for information that is found at the end of links posted on this page.
If not otherwise explicitly mentioned in the body of the article, at the time of writing, the author has no position in any stock mentioned in this article and no business relationship with any company mentioned. The author has not received compensation for writing this article, other than from FXStreet.
FXStreet and the author do not provide personalized recommendations. The author makes no representations as to the accuracy, completeness, or suitability of this information. FXStreet and the author will not be liable for any errors, omissions or any losses, injuries or damages arising from this information and its display or use. Errors and omissions excepted.
The author and FXStreet are not registered investment advisors and nothing in this article is intended to be investment advice.
Recommended Content
Editors’ Picks

Crypto fraud soars as high-risk addresses on Ethereum, TRON networks receive $278 billion
The cryptocurrency industry is growing across multiple facets, including tokenized real-world assets, futures and spot ETFs, stablecoins, Artificial Intelligence (AI), and its convergence with blockchain technology, as well as the dynamic decentralized finance (DeFi) sector.

Bitcoin eyes $100,000 amid Arizona Reserve plans, corporate demand, ETF inflows
Bitcoin price is stabilizing around $95,000 at the time of writing on Tuesday, and a breakout suggests a rally toward $100,000. The institutional and corporate demand supports a bullish thesis, as US spot ETFs recorded an inflow of $591.29 million on Monday, continuing the trend since April 17.

Meme coins to watch as Bitcoin price steadies
Bitcoin price hovers around $95,000, supported by continued spot BTC ETFs’ inflows. Trump Official is a key meme coin to watch ahead of a stakeholder dinner to be attended by President Donald Trump. Dogwifhat price is up 47% in April and looks set to post its first positive monthly returns this year.

Cardano Lace Wallet integrates Bitcoin, boosting cross-chain capabilities
Cardano co-founder Charles Hoskinson announced Monday that Bitcoin is integrated into the Lace Wallet, expanding Cardano’s ecosystem and cross-chain capabilities. This integration enables users to manage BTC alongside Cardano assets, providing support for multichain functionality.
Bitcoin Weekly Forecast: BTC consolidates after posting over 10% weekly surge
Bitcoin (BTC) price is consolidating around $94,000 at the time of writing on Friday, holding onto the recent 10% increase seen earlier this week.

The Best brokers to trade EUR/USD
SPONSORED Discover the top brokers for trading EUR/USD in 2025. Our list features brokers with competitive spreads, fast execution, and powerful platforms. Whether you're a beginner or an expert, find the right partner to navigate the dynamic Forex market.