- Crypto market shows signs of fatigue, but no one ventures to open short positions.
- Extreme bullish sentiment weighs on the crypto market.
- Ripple could accompany the Bitcoin upwards if the bulls manage to keep control.
Traders moving in the crypto environment have their sights set on breaking the $12000 level in the BTC/USD pair. Bitcoin has spent three weeks playing with this resistance level, and now, once it's passed, it seems to be figuring out what to do.
The natural cycle of the market usually leaves Bitcoin moves for last, but technically, it doesn't seem that the King of cryptocurrencies has the strength needed for such a move.
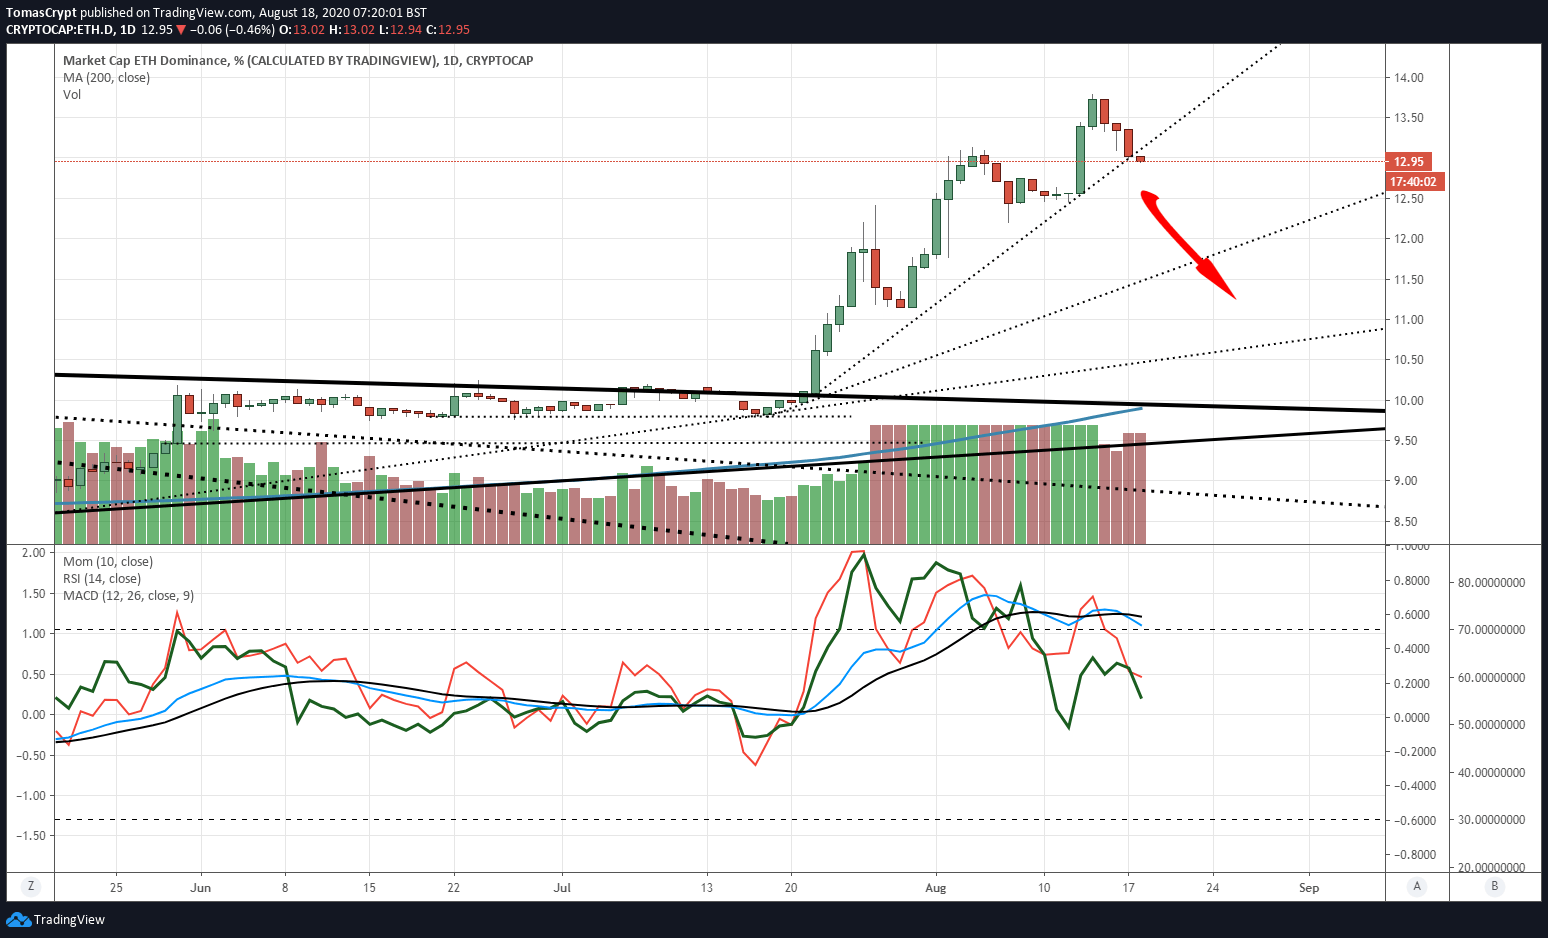
The technical indicators on the Bitcoin dominance chart are not well set up for a new bullish stretch and urgently need a radical upward move to change this situation.
Ethereum's dominance chart also shows the exhaustion of the brutal uptrend of the past few weeks. Ether's current market share level is 13%, and it may move down to seek support at the 12% level first and 11% later.
The risk of ending the current bullish phase and proceeding to a consolidation of gains is high by the very high level of greed shown by the sentiment indicator prepared by the website alternative.me.
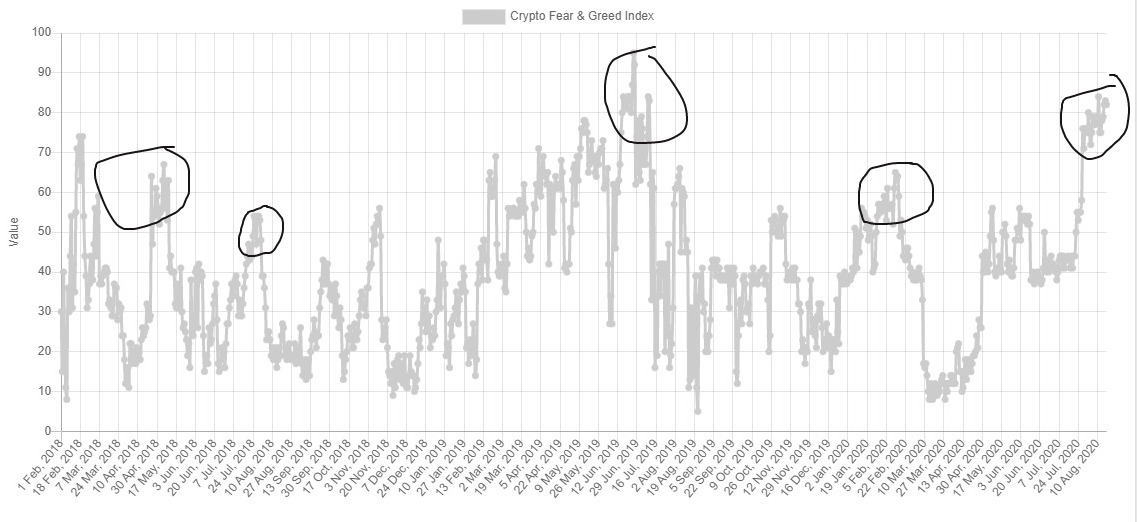
The indicator is currently at level 82, on a scale ranging from 0 to 100, and continues to build a ceiling that statistically ends in price drops in the market and correction of the euphoria towards more neutral levels.
ETH/BTC Daily Chart
The ETH/BTC pair is currently trading at 0.0350 and makes it clear that the goal for the day is to avoid closing below this support level. If Ethereum's value drop against Bitcoin accelerates, the primary target is at 0.031, where the 50-day exponential moving average passes.
Above the current price, the first resistance level is at 0.0372, then the second at 0.03815 and the third one at 0.0387.
Below the current price, the first support level is at 0.035, then the second at 0.0333 and the third one at 0.0316.
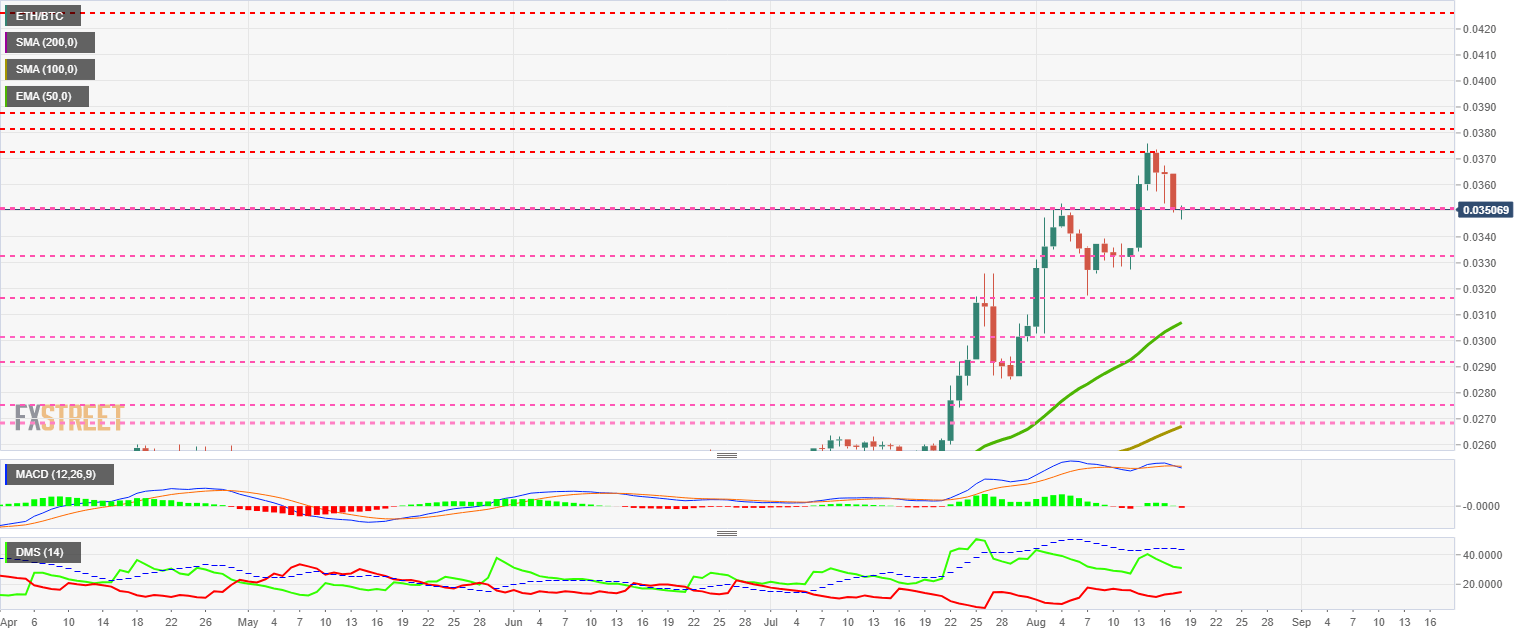
The MACD on the daily chart has crossed back into the downtrend after last week's false move. The behavior pattern of this indicator does not give it much chance of turning around, and therefore the price development should be bearish.
The DMI on the daily chart shows the bears rising sharply, while the bulls do not seem to be worried and do not move at the same level of intensity.
BTC/USD Daily Chart
The BTC/USD pair is currently trading at the price level of $12250 and is just two resistance levels away from the relative high reached in the spring of 2019 at $14000.
Above the current price, the first resistance level is at $12850, then the second at $13975 and the third one at $17150.
Below the current price, the first support level is at $12250, then the second at $11300 and the third one at $10675.
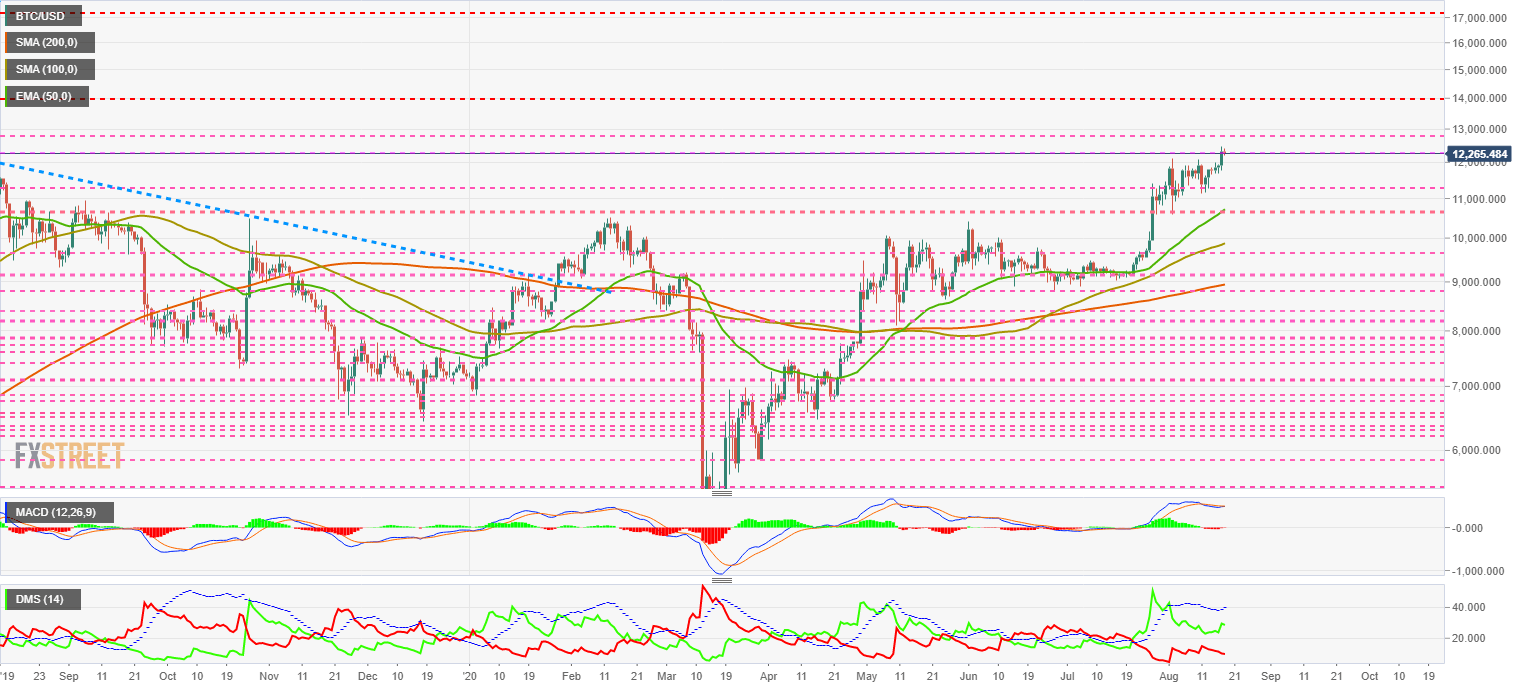
The MACD on the daily chart shows a bullish cross attempt in progress. BTC/USD needs to move to the next resistance level to complete the bullish cross, or it will drop to the $11000 price zone.
The DMI on the daily chart shows bulls rebounding upwards, while bears are moving downwards, cautious of the upward breach of the $12000 price congestion resistance.
ETH/USD Daily Chart
The ETH/USD pair is currently trading at a price level of $430, showing great difficulty in overcoming the price congestion resistance level at $440. The upward extension movement from the $385 price level seems to have consumed the remaining energy of ETH/USD.
Above the current price, the first resistance level is at $440, then the second at $485 and the third one at $525.
Below the current price, the first support level is at $385, then the second at $350 and the third one at $335.
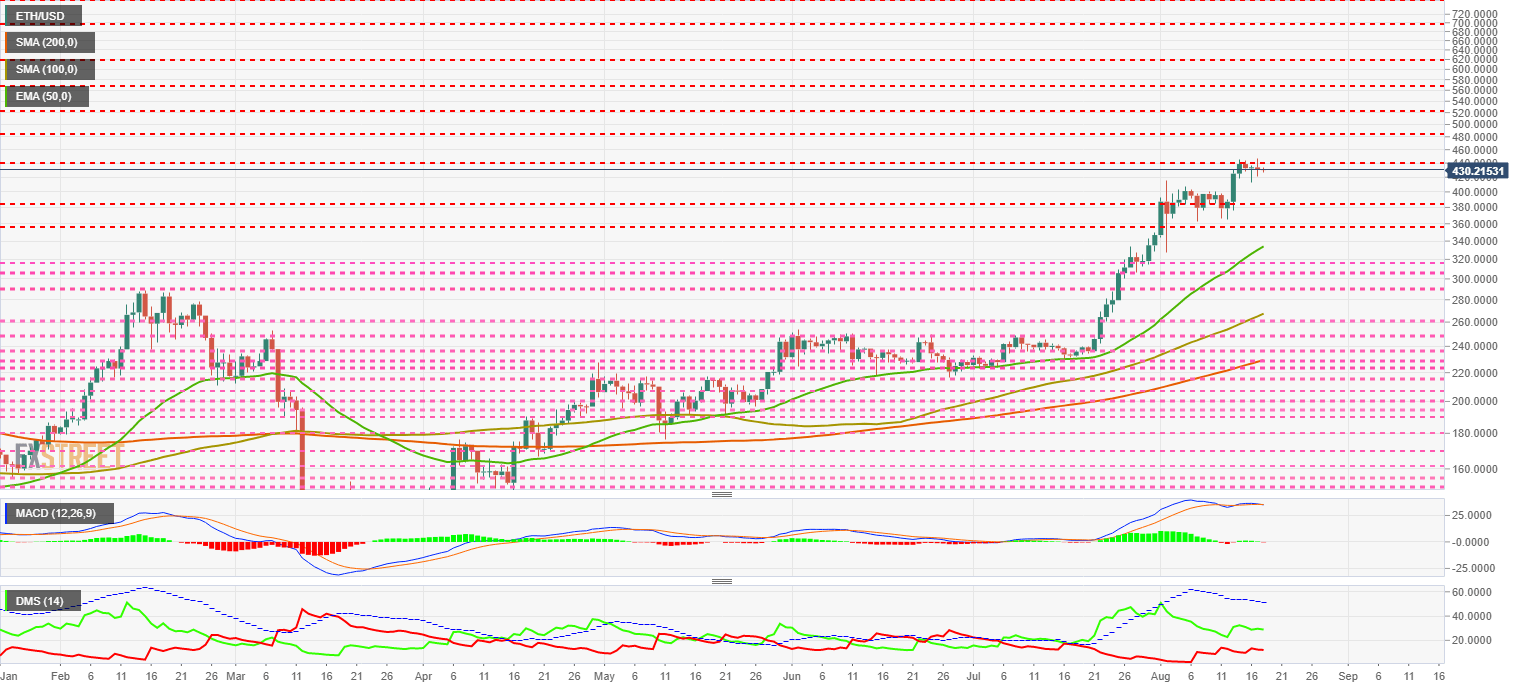
The MACD on the daily chart shows an ongoing bearish cross. ETH/USD could accelerate the price drop in the next few hours.
The DMI on the daily chart shows bears increasing their trend force and approaching the level of a bull that is losing strength day by day.
XRP/USD Daily Chart
The XRP/USD pair is currently trading at the price level of $0.316 after closing above its relative high in February.
Above the current price, the first resistance level is at $0.32, then the second at $0.33 and the third one at $0.335.
Below the current price, the first support level is at $0.30, then the second at $0.29 and the third one at $0.285.
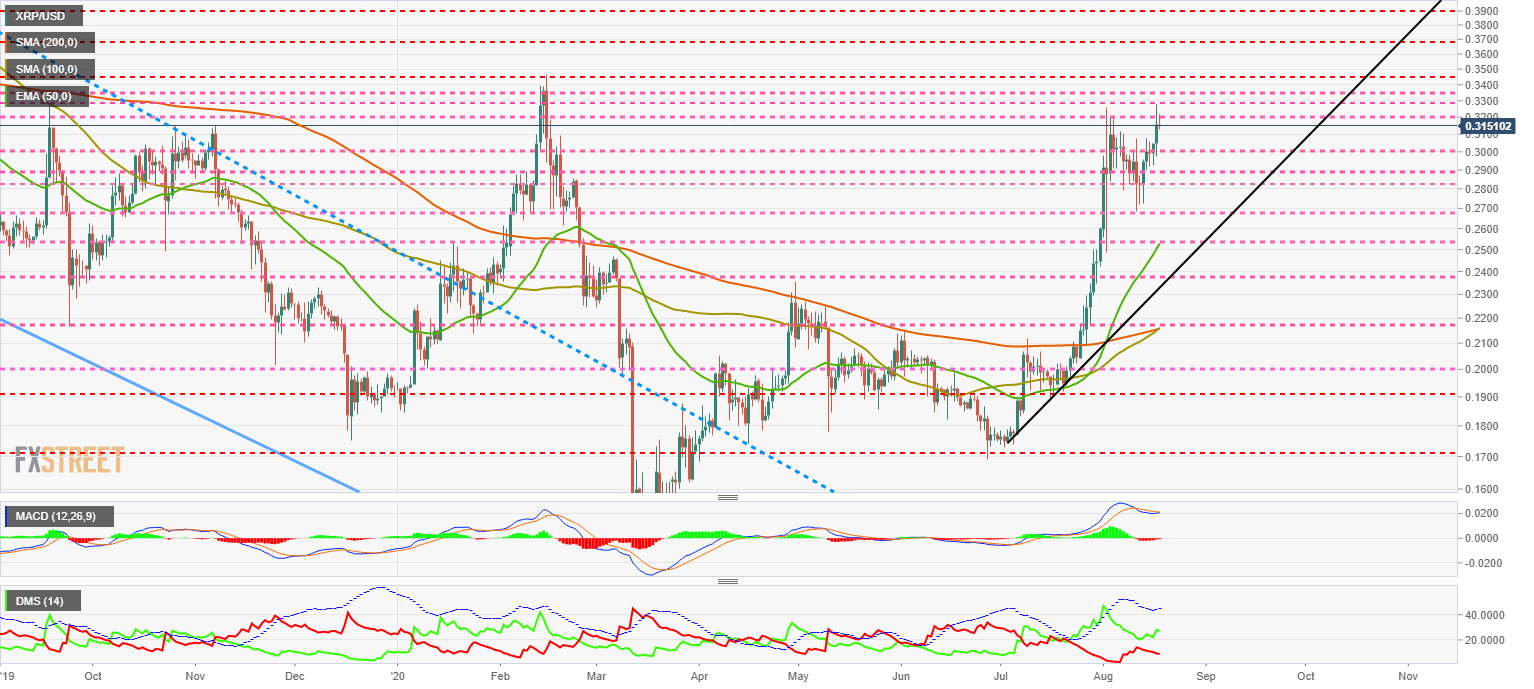
The MACD on the daily chart is trying to undo the bearish cross. The bullish cross is not yet confirmed and won't be for another two days.
The DMI on the daily chart shows the bulls increasing their strength while the bears continue to lose muscle. This setup is favorable for a further bullish move in the XRP/USD pair.
Information on these pages contains forward-looking statements that involve risks and uncertainties. Markets and instruments profiled on this page are for informational purposes only and should not in any way come across as a recommendation to buy or sell in these assets. You should do your own thorough research before making any investment decisions. FXStreet does not in any way guarantee that this information is free from mistakes, errors, or material misstatements. It also does not guarantee that this information is of a timely nature. Investing in Open Markets involves a great deal of risk, including the loss of all or a portion of your investment, as well as emotional distress. All risks, losses and costs associated with investing, including total loss of principal, are your responsibility. The views and opinions expressed in this article are those of the authors and do not necessarily reflect the official policy or position of FXStreet nor its advertisers. The author will not be held responsible for information that is found at the end of links posted on this page.
If not otherwise explicitly mentioned in the body of the article, at the time of writing, the author has no position in any stock mentioned in this article and no business relationship with any company mentioned. The author has not received compensation for writing this article, other than from FXStreet.
FXStreet and the author do not provide personalized recommendations. The author makes no representations as to the accuracy, completeness, or suitability of this information. FXStreet and the author will not be liable for any errors, omissions or any losses, injuries or damages arising from this information and its display or use. Errors and omissions excepted.
The author and FXStreet are not registered investment advisors and nothing in this article is intended to be investment advice.
Recommended Content
Editors’ Picks
XRP funding rates flashes negative, eyes $2.17 following 4% decline
Ripple's XRP declined 4% on Friday following a decline in its funding rates. The remittance-based token could decline to test the $2.17 support level if the crypto market decline extends.

Pro-crypto Senator Lummis likely to chair potential crypto subcommittee
In a post on Thursday, Fox Business reporter Eleanor Terret unveiled the Senate Banking Committee's latest plan to kick off a new subcommittee committed to crypto, likely to be headed by Bitcoin strategic reserve advocate Senator Cynthia Lummis.

Lack of Bitcoin allocation could be risky for nations in 2025: Fidelity
Fidelity Digital Assets' Look Ahead report for the crypto market in 2025 highlights key trends expected for the year, including increased Bitcoin adoption by governments worldwide, broader use cases for stablecoins and more app blockchain launches.

Crypto Today: BTC traders hold $90K support as SUI, LTC, TIA see green
The cryptocurrency market’s losing streak entered its third day; aggregate market cap declined 10.9% to hit $3.1 trillion. Bitcoin price stabilized around the $91,800 area as bulls moved to avoid further downside.
Bitcoin: 2025 outlook brightens on expectations of US pro-crypto policy
Bitcoin price has surged more than 140% in 2024, reaching the $100K milestone in early December. The rally was driven by the launch of Bitcoin Spot ETFs in January and the reduced supply following the fourth halving event in April.

Best Forex Brokers with Low Spreads
VERIFIED Low spreads are crucial for reducing trading costs. Explore top Forex brokers offering competitive spreads and high leverage. Compare options for EUR/USD, GBP/USD, USD/JPY, and Gold.