Top 3 Price Prediction Bitcoin, Ethereum, Ripple: Bitcoin losing his anonymity because of Nakamoto?
- Bitcoin's anonymity hasn't disappeared and it's impossible to know if Nakamoto is behind the 50 BTC transfer.
- Bitcoin loses ground in front of the Altcoins and drags the market down versus US dollar.
- Ripple shows a dual structure, suitable for going to the moon or to hell.

The top entertainment story of the day revolves around a 50 BTC transaction made yesterday from a wallet that had been in hibernation since February 2009.
This transaction triggered a wave of news about a possible account of Satoshi Nakamoto goes live.
One of the most outstanding qualities of Bitcoin is the ability to maintain anonymity, and so far, it has not been possible to break this layer of security.
To say now that Nakamoto moved the 50 BTC yesterday sounds like a bad joke.
In February 2009, Bitcoin had just been born, and the reward per mined block was 50 BTC. It's known that the leading miner at that time was Mr Nakamoto, and it's legendary that he disappeared without a trace.
The tokens moved to other wallets mand it is not possible to know who is behind this movement.
What we can know is where the market is moving, towards Ethereum.
The dominance charts indicated five days ago a new trend change that should benefit the Ethereum versus Bitcoin, and it is happening.
After the last attempt to break through the long-term bearish channel, Bitcoin dominance level is now looking for support at the 67 levels, where a price congestion support level and the 200-day simple moving average converge.
Below that level, the next support level is at 64, then the next at 62 and the third one at 60.
Technical indicators show a high probability of support failure, which would give wings to the Altcoin segment.
The market continues to move close to the line that marks a new bullish stretch, and yesterday it was the turn for sales. The declines have increased the chances that we will not see the Bitcoin above $10000 until the summer.
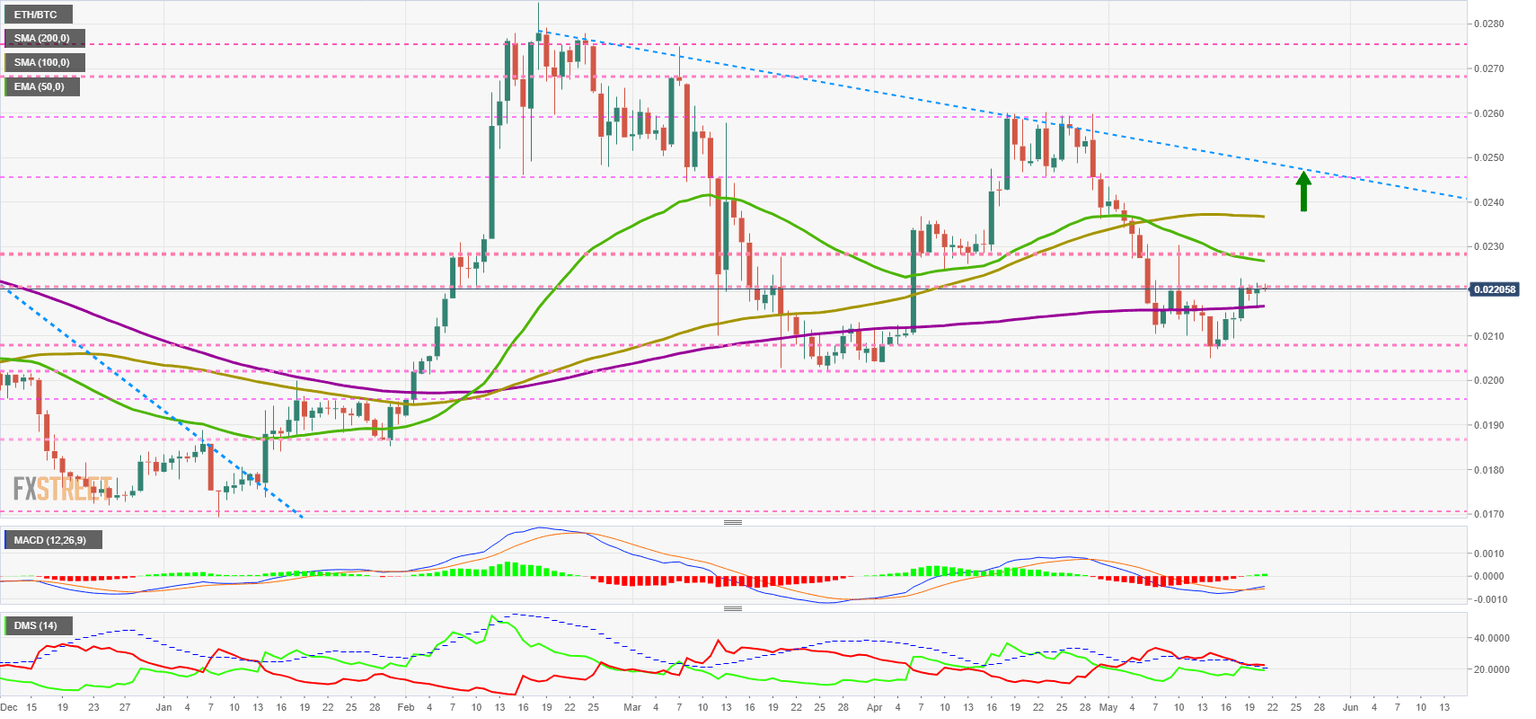
ETH/BTC Daily Chart
The ETH/BTC pair is currently trading at the price level of 0.022, only one-hundredth of a point below the price congestion resistance level of 0.0221. The critical resistance level is at 0.0245, and a breakout would take the valuation of the Ethereum to levels not seen since the summer of 2019.
Above the current price, the first resistance level is at 0.0221, then the second at 0.0227 and the third one at 0.0237.
Below the current price, the first support level is at 0.0217, then the second at 0.0207 and the third one at 0.0202.
The MACD on the daily chart continues the upward trend from the previous day's lows. The current profile is still fragile and may need several days to acquire a more decidedly bullish profile.
The DMI on the daily chart shows the bears in an advantageous position above the ADX line but may be short-lived. The bulls are very close to the sell-side level and continue to draw an upward trend since the beginning of this month.
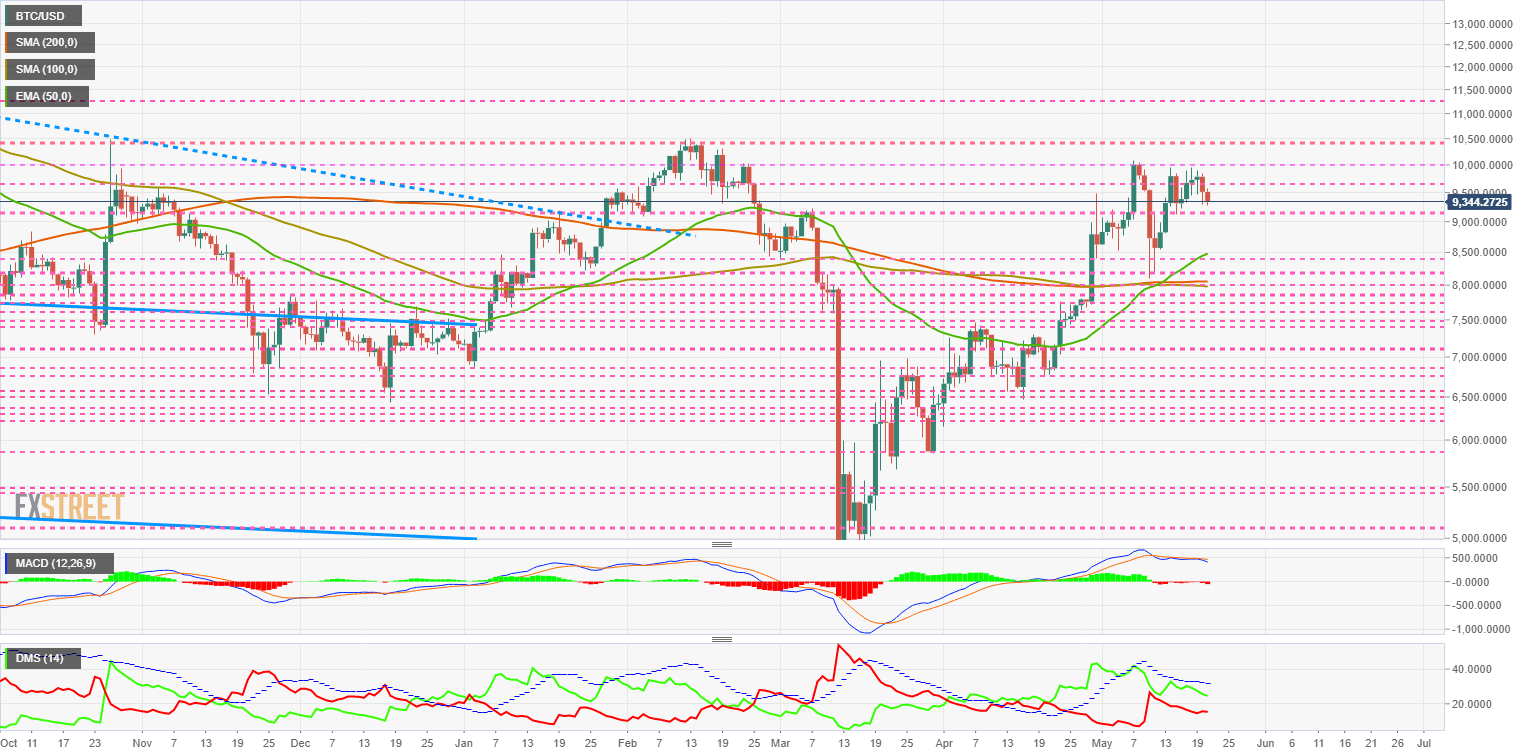
BTC/USD Daily Chart
The BTC/USD pair is currently trading at $9344 and continues to follow the sales that were made yesterday during the US session. The major moving averages are still at the $8000 level, except for the 50-day exponential moving average which can support the price at the $8500 level.
Above the current price, the first resistance level is at $9645, then the second at $10000 and the third one at $10400.
Below the current price, the first support level is at $9200, then the second at $8800 and the third one at $8500.
The MACD on the daily chart breaks the horizontal profile of the last few days. The expected development is bearish, with a price target in the congestion zone of the leading moving averages.
The DMI on the daily chart shows bulls losing strength, a weakness that is not being exploited by bears, which are also losing power.
ETH/USD Daily Chart
The ETH/USD pair is currently trading at $206 and remains in the same range despite yesterday's declines. The structure is worsening in line with the rest of the market. The major moving averages offer support at the $190 level, and the 50-day exponential moving average crosses the 100 simple moving average.
The last time this bullish cross of the moving averages occurred was on January 31st, and the price of the ETH/USD pair went from $130 to $290 in six weeks.
Above the current price, the first resistance level is at $215, then the second at $225 and the third one at $230.
Below the current price, the first support level is at $200, then the second at $190 and the third one at $180.
The MACD on the daily chart shows a flat profile. The underlying trend continues to be upward, although the weakness of the Bitcoin has caused the entire market to lose momentum.
The DMI on the daily chart shows the bulls leading the market but with a slight advantage over the bears. The sell-side is moving below the ADX line, which favors the bulls.
XRP/USD Daily Chart
The XRP/USD pair is currently trading at the $0.0198 price level and is playing dangerously close to this critical support level. The price has opened below the 50-period exponential average line today, a sign of weakness in the short term.
Above the current price, the first resistance level is at $0.208, then the second at $0.217 and the third one at $0.238.
Below the current price, the first support level is at $0.190, then the second at $0.182 and the third one at $0.163.
The MACD on the daily chart moves on the zero levels of the indicator and could turn upwards from here. The structure of the chart is not favourable to the buy-side, but a bullish rebound may be possible.
The DMI on the daily chart shows bears in the process of breaking through the support of the ADX line, which could disable the current downward momentum. The bulls show no interest in taking the lead and are also moving lower.
Author

Tomas Salles
FXStreet
Tomàs Sallés was born in Barcelona in 1972, he is a certified technical analyst after having completing specialized courses in Spain and Switzerland.


