- Bitcoin is on its third positive consecutive session in a row on the dominance chart and points to strong market share increases.
- Crypto market raises doubts on price development in the short term.
- Technical indicators are showing volatility at the forefront as doubts are cleared in the short term.
This weekend saw one attempt by Bitcoin to break the $11000 barrier by taking advantage of the gap that Ethereum left with its sudden attempt to reach the $400 price level.
If both attempts failed and proved harmless against the US dollar, the effect on the Bitcoin/Ethereum interrelationship charts has not been the same. Bitcoin has significantly benefited and has won half the game in terms of market dominance.
The Bitcoin dominance chart shows three straight days of gains that confirm an upward break from the previous downward trend.
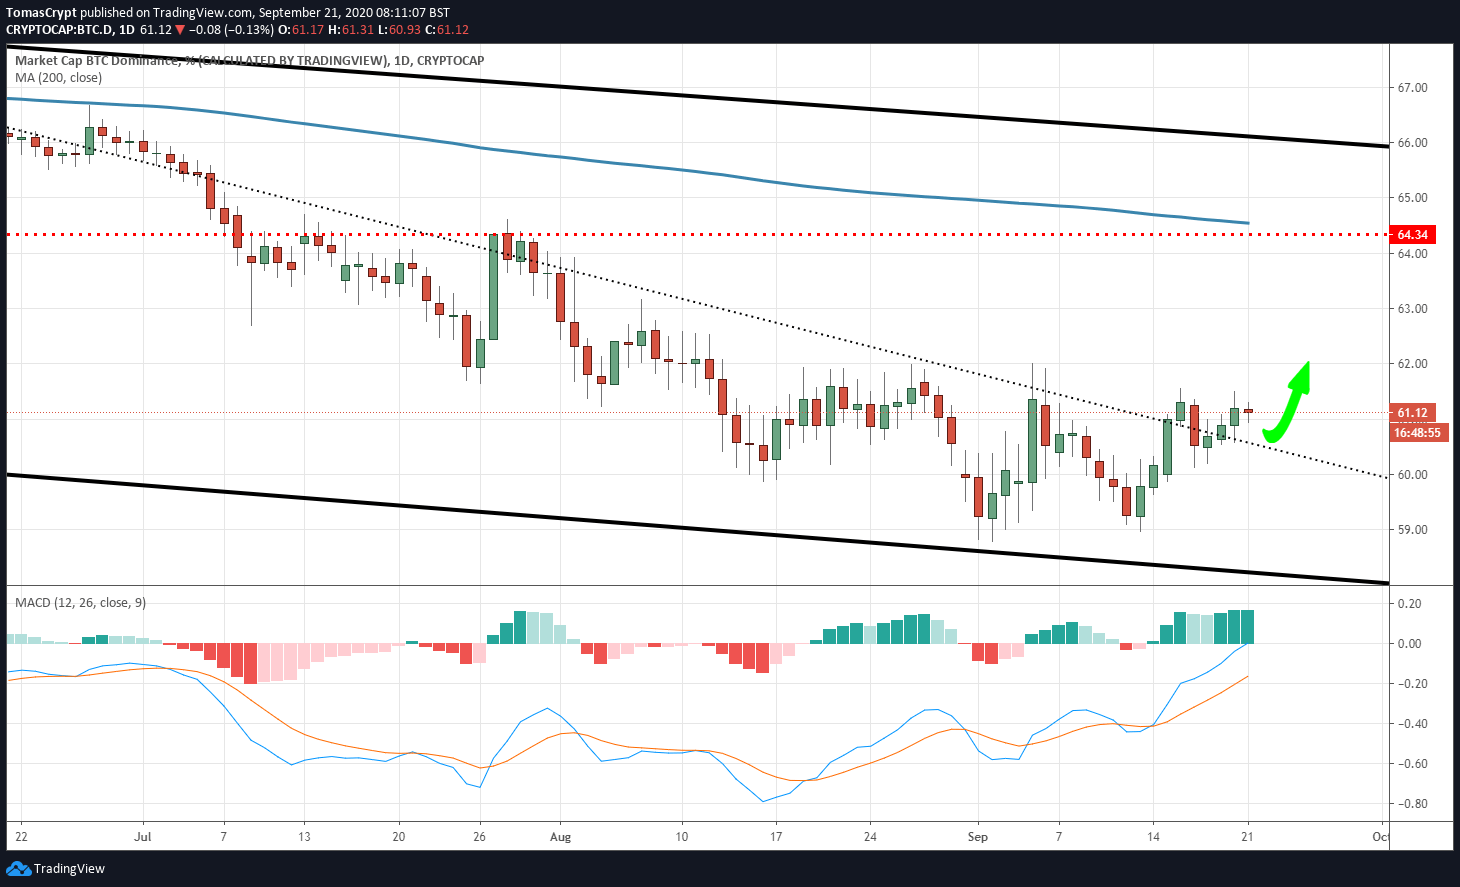
We can now expect the movement to be upward with a medium-term target at the 64% level of dominance, where significant price congestion resistance will soon match the 200-day simple moving average (SMA200).
The MACD indicator presents an aggressively bullish profile, only threatened by the presence of the zero levels that divides the bullish and bearish zones. The process of crossing this level in the MACD is always complicated and can even slow down the movement.
The big question in the short and mid-term is how the increase in Bitcoin's market share will affect the crypto board as a whole. The two expected scenarios imply that Bitcoin will behave better than the rest of the market. But it is not yet clear whether it will do so with a market moving upwards – optimism on the future of Bitcoin – or with generalised price falls – pessimism towards the future of the Altcoin segment.
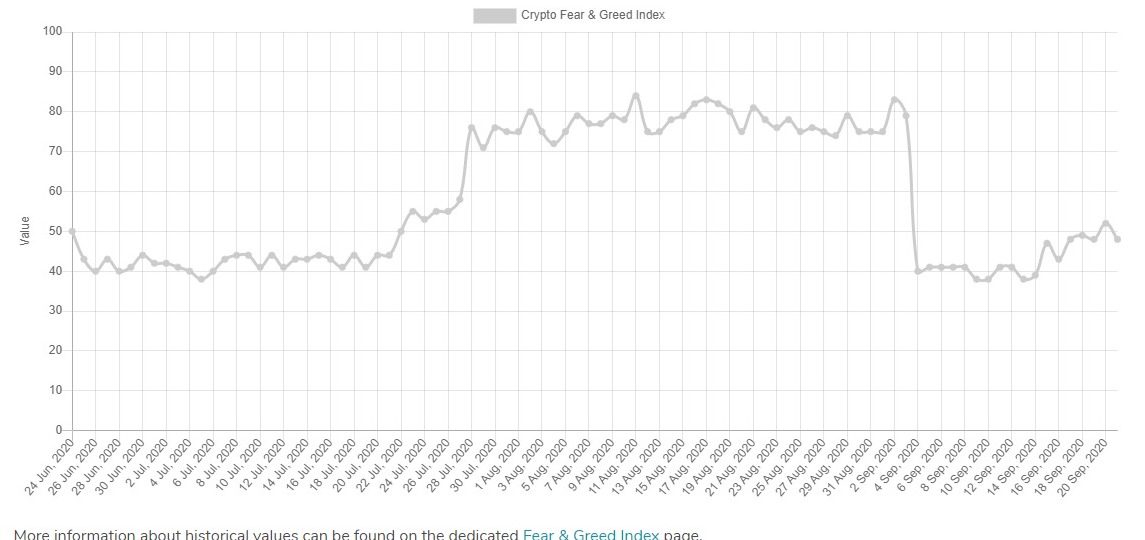
The market sentiment level accurately reflects the doubts that exist and is once again below the 50 level. The sentiment index prepared by the site alternative.me remains at the 47 level, pending what may happen in the coming sessions.
ETH/BTC Daily Chart
The ETH/BTC pair is currently trading at the price level of 0.0341, and for the first time in three sessions is moving upwards. ETH/BTC is following a sequence of decreasing highs, although the support zone is showing strength to hold above the 0.032 level.
Above the current price, the first resistance level is at 0.0348, then the second at 0.0371 and the third one at 0.040.
Below the current price, the first support level is at 0.0328, then the second at 0.0314 and the third one at 0.0307.
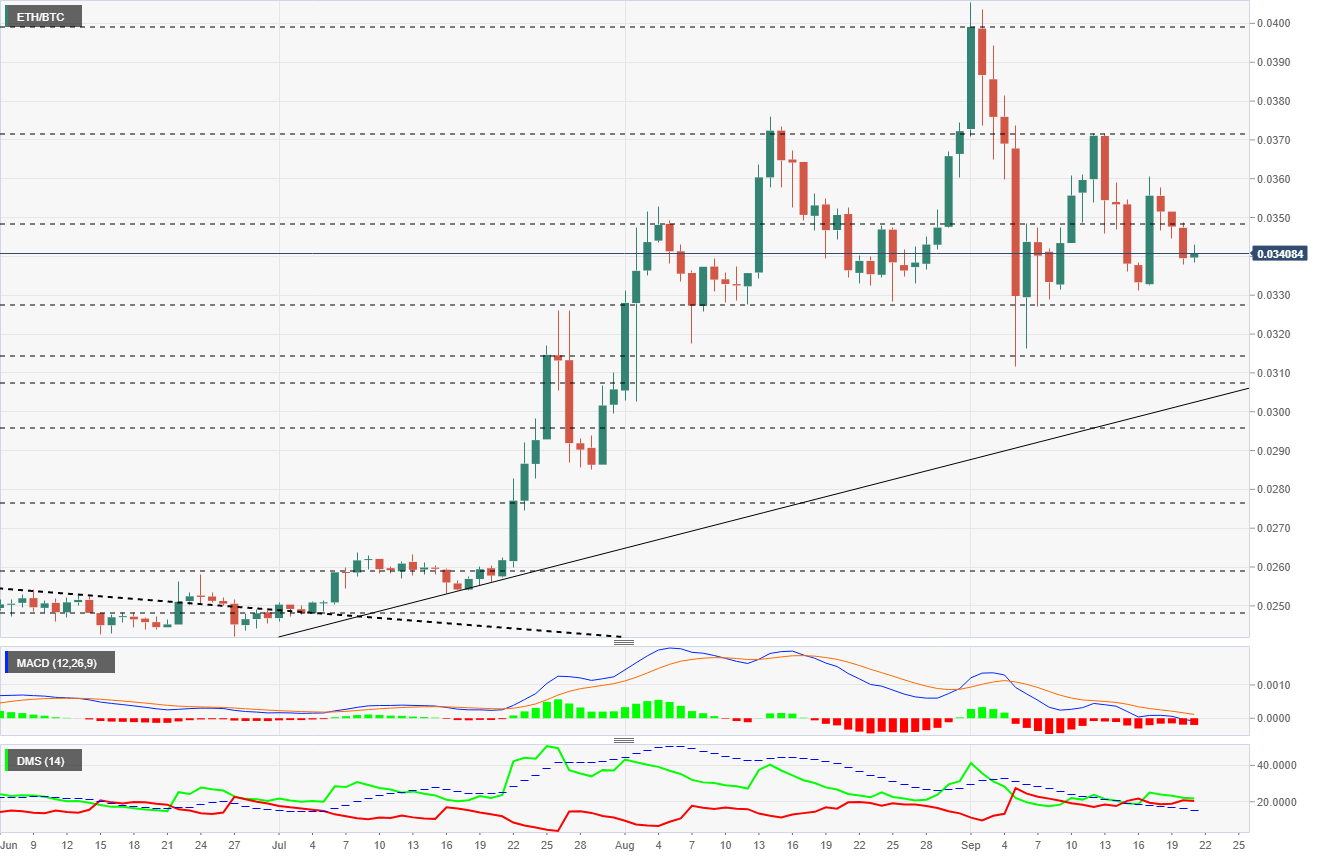
The MACD on the daily chart relies on the indicator's zero levels for strength to stop the downward trend and return to attack the relative highs at 0.040. A downward breach of this level would mean that the ETH/BTC pair would move quickly towards the 0.031 level.
The DMI on the daily chart shows bulls with a minimal lead over bears. Bears can easily take control and, faced with the position above the ADX line, do so quickly.
BTC/USD Daily Chart
The BTC/USD pair is currently trading at the price level of $10926 and remains in the attack zone towards the price congestion resistance level of $11088.
Above the current price, the first resistance level is at $11088, then the second at $10360 and the third one at $11575.
Below the current price, the first support level is at $10700, then the second at $10400 and the third one at $10175.
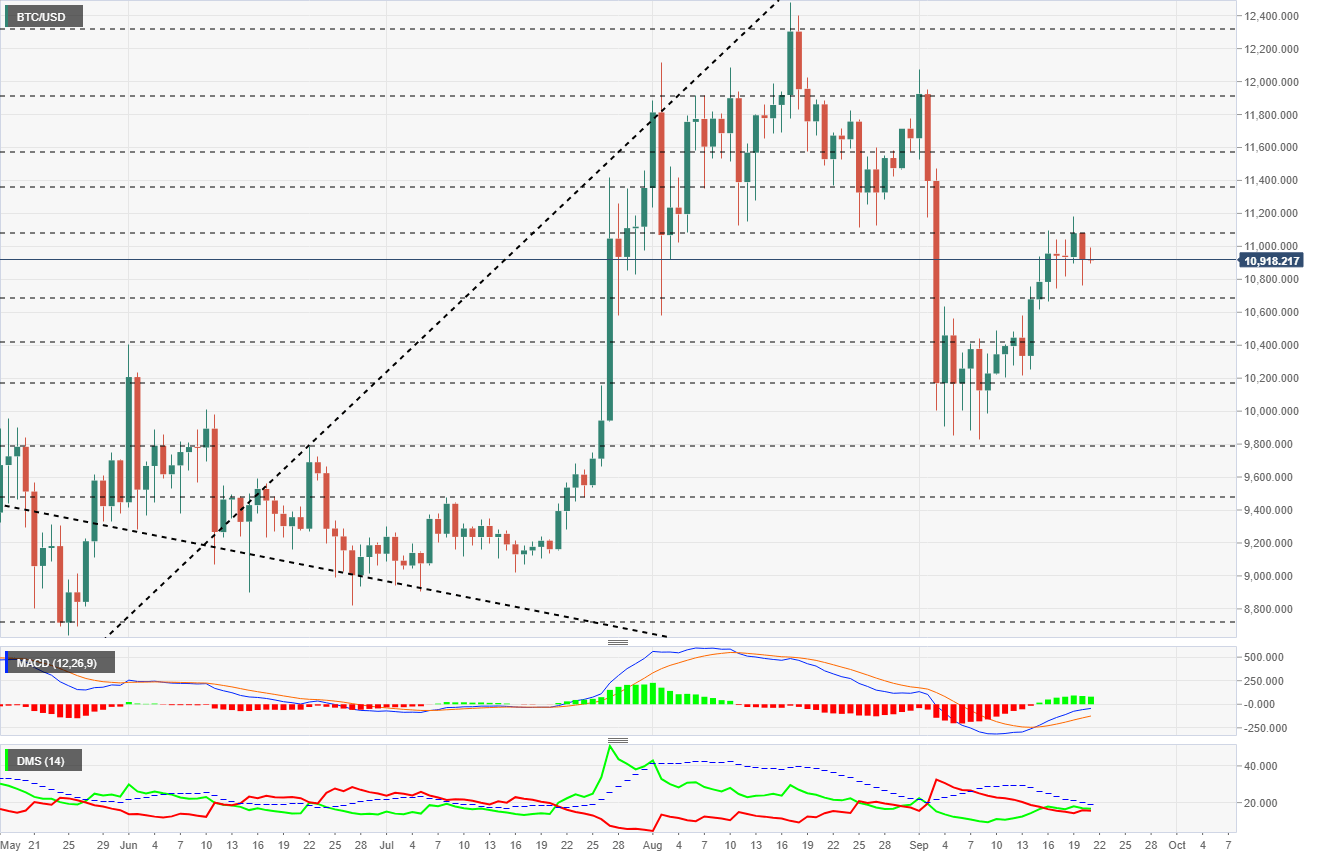
The MACD on the daily chart shows the moving averages losing strength as they approach the indicator's neutral zone. The BTC/USD pair must move up soon if you want to avoid a setting in the MACD that would weigh on your behavior for several days.
The DMI on the daily chart shows bulls with a small advantage over bears, insufficient to validate the dominance of the buying side.
ETH/USD Daily Chart
The ETH/USD pair is currently trading at $375 and continues for the third week in the range of $365 to $390.
Above the current price, the first resistance level is at $390, then the second at $400 and the third one at $425.
Below the current price, the first support level is at $365, then the second at $350 and the third one at $335.

The MACD on the daily chart shows a potentially bullish profile once the moving averages have confirmed the upward cross that occurred last week. The zero level of the indicator remains the final hurdle to see a consistent upward movement in the ETH/USD pair.
The DMI on the daily chart shows the bears controlling the pair, although with a slight advantage. The position of both sides of the market above the ADX line promises speed in the next price movement.
XRP/USD Daily Chart
The XRP/USD pair is currently trading at the price level of $0.245 and it is regaining this level of support due to congestion after losing it during the Asian session.
Above the current price, the first resistance level is at $0.255, then the second at $0.264 and the third one at $0.276.
Below the current price, the first support level is at $0.245, then the second at $0.231 and the third one at $0.225.
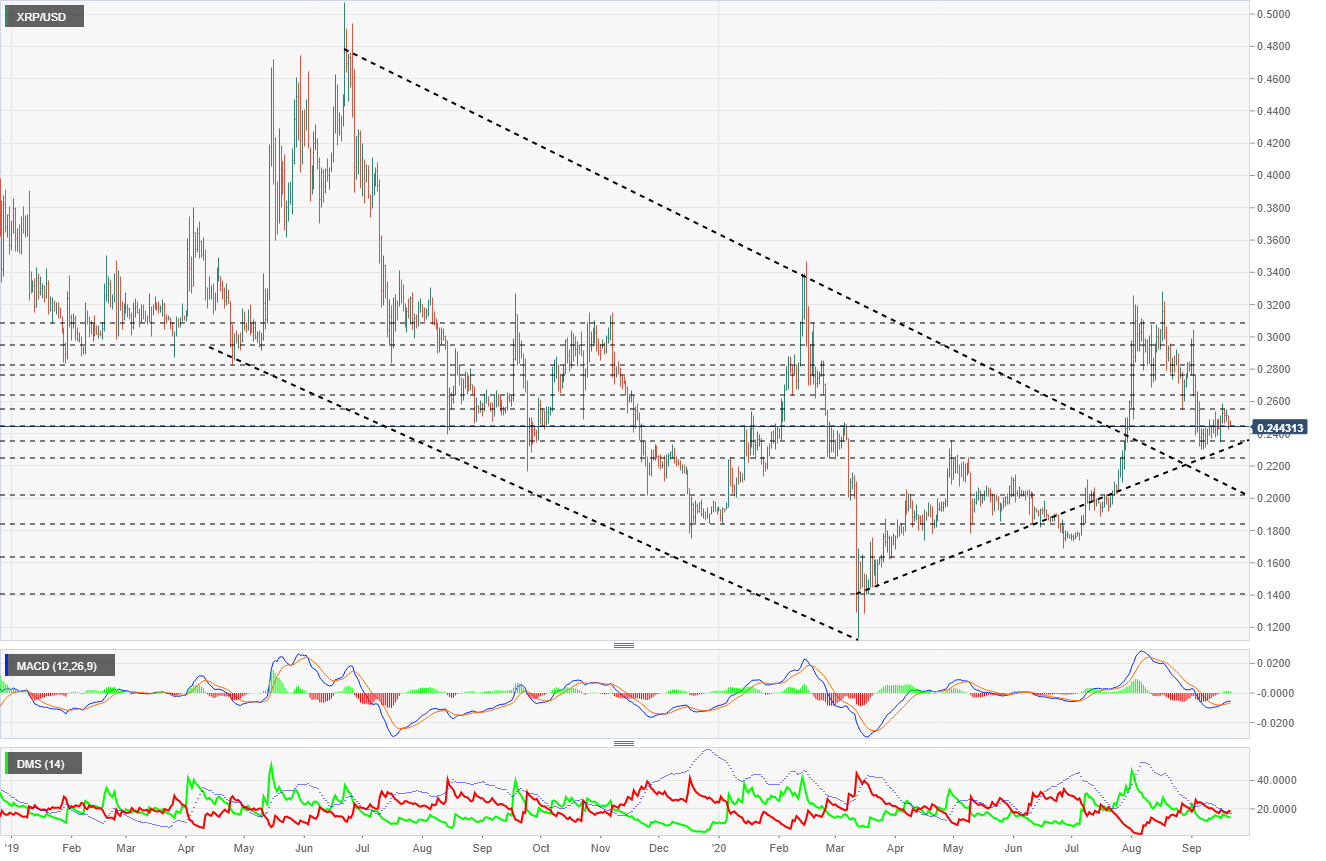
The MACD on the daily chart shows a very flat profile with little line spacing. The current structure suggests that an upward lateral move is most likely in the XRP/USD pair in the short term.
The DMI on the daily chart shows bears controlling the pair with a distinct advantage over bulls. The selling side is moving above the ADX line, which would give it significant upward potential.
Information on these pages contains forward-looking statements that involve risks and uncertainties. Markets and instruments profiled on this page are for informational purposes only and should not in any way come across as a recommendation to buy or sell in these assets. You should do your own thorough research before making any investment decisions. FXStreet does not in any way guarantee that this information is free from mistakes, errors, or material misstatements. It also does not guarantee that this information is of a timely nature. Investing in Open Markets involves a great deal of risk, including the loss of all or a portion of your investment, as well as emotional distress. All risks, losses and costs associated with investing, including total loss of principal, are your responsibility. The views and opinions expressed in this article are those of the authors and do not necessarily reflect the official policy or position of FXStreet nor its advertisers. The author will not be held responsible for information that is found at the end of links posted on this page.
If not otherwise explicitly mentioned in the body of the article, at the time of writing, the author has no position in any stock mentioned in this article and no business relationship with any company mentioned. The author has not received compensation for writing this article, other than from FXStreet.
FXStreet and the author do not provide personalized recommendations. The author makes no representations as to the accuracy, completeness, or suitability of this information. FXStreet and the author will not be liable for any errors, omissions or any losses, injuries or damages arising from this information and its display or use. Errors and omissions excepted.
The author and FXStreet are not registered investment advisors and nothing in this article is intended to be investment advice.
Recommended Content
Editors’ Picks

Bitcoin holds $84,000 despite Fed’s hawkish remarks and spot ETFs outflows
Bitcoin is stabilizing around $84,000 at the time of writing on Thursday after facing multiple rejections around the 200-day EMA at $85,000 since Saturday. Despite risk-off sentiment due to the hawkish remarks by the US Fed on Wednesday, BTC remains relatively stable.

Crypto market cap fell more than 18% in Q1, wiping out $633.5 billion after Trump’s inauguration top
CoinGecko’s Q1 Crypto Industry Report highlights that the total crypto market capitalization fell by 18.6% in the first quarter, wiping out $633.5 billion after topping on January 18, just a couple of days ahead of US President Donald Trump’s inauguration.

Top meme coin gainers FARTCOIN, AIDOGE, and MEW as Trump coins litmus test US SEC ethics
Cryptocurrencies have been moving in lockstep since Monday, largely reflecting sentiment across global markets as United States (US) President Donald Trump's tariffs and trade wars take on new shapes and forms each passing day.

XRP buoyant above $2 as court grants Ripple breathing space in SEC lawsuit
A US appellate court temporarily paused the SEC-Ripple case for 60 days, holding the appeal in abeyance. The SEC is expected to file a status report by June 15, signaling a potential end to the four-year legal battle.
Bitcoin Weekly Forecast: Market uncertainty lingers, Trump’s 90-day tariff pause sparks modest recovery
Bitcoin (BTC) price extends recovery to around $82,500 on Friday after dumping to a new year-to-date low of $74,508 to start the week. Market uncertainty remains high, leading to a massive shakeout, with total liquidations hitting $2.18 billion across crypto markets.

The Best brokers to trade EUR/USD
SPONSORED Discover the top brokers for trading EUR/USD in 2025. Our list features brokers with competitive spreads, fast execution, and powerful platforms. Whether you're a beginner or an expert, find the right partner to navigate the dynamic Forex market.