Top 3 Price Prediction Bitcoin, Ethereum, Ripple: Bitcoin gains ground amid US Dollar decline
- Bitcoin is negatively correlated with the US Dollar.
- Altcoins have been extending the recovery on Monday.
- ETH/BTC retreated from the recent high as Bitcoin's upside momentum gained traction.

The cryptocurrency market has been on fire since the end of the previous week. Bitcoin and all major altcoins smashed quite a number of important technical barriers before the upside momentum faded away. However, the bulls may resume the assault after a short pause and a technical correction from the overbought levels.
A massive rush to safety on the global markets manifests itself in a gold rally. The precious metal prices jumped to an all-time high as investors are concerns about second-wave outbreaks of the coronavirus. The stock markets and the US dollar are in the free fall as the rising COVID-19 cases in China and Spain deteriorate economic forecasts.
The July FOMC meeting should kick off a period from August into mid-September in which markets should price in an increasingly dovish, forward-looking Fed policy via lower real rates. This should benefit breakeven inflation rates, support risk assets, and weigh on the U.S. dollar, Morgan Stanley strategists including Matthew Hornbach wrote in a report.
While Bitcoin's correlation to gold and stock markets remains unclear, the sell-off of the US Dollar seems to be a supportive factor for the digital asset.
ETH/BTC Daily Chart
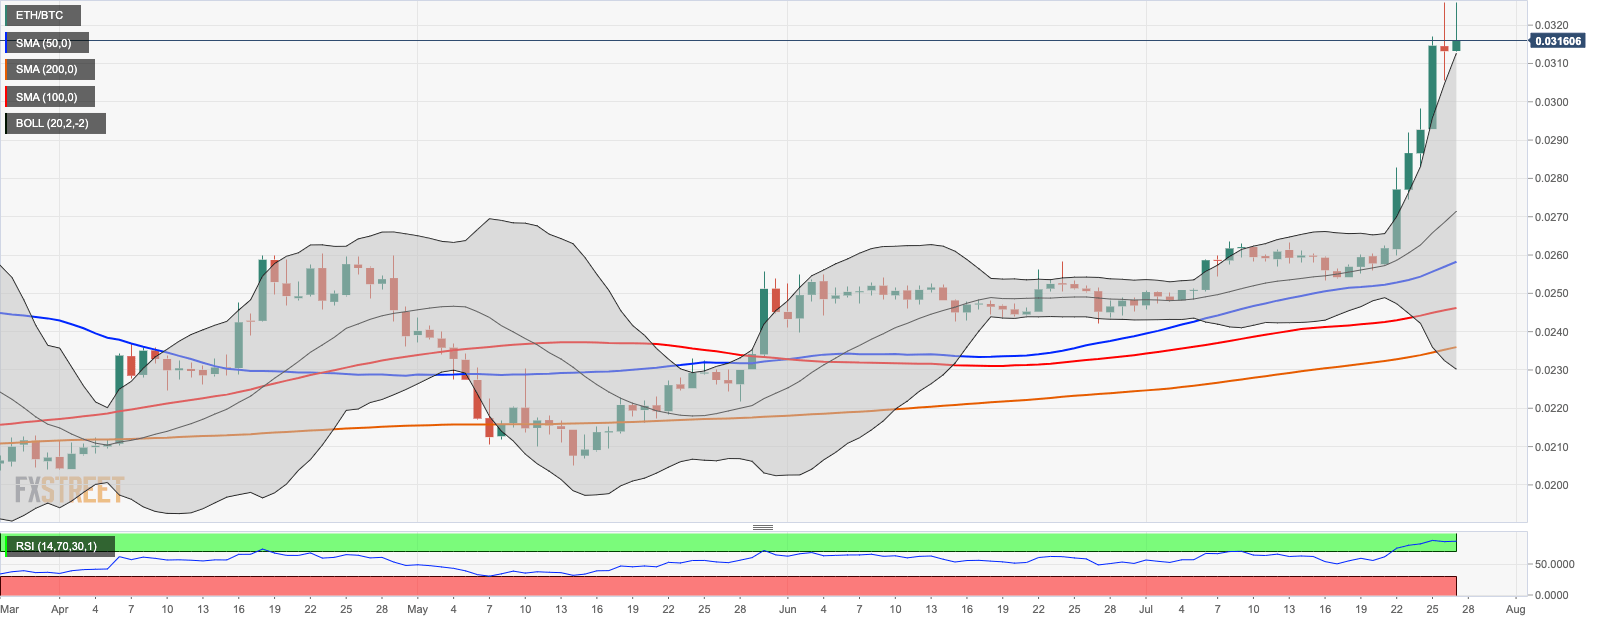
ETH/BTC is currently trading at 0.03160. The cross hit the recent high at $0.03259 and settled above the upper line of the daily Bollinger Band at $0.03126. Now this area serves as a local support that may stop the downside correction. If it is broken, the sell-off may be extended towards $0.0300 reinforced by the upper line of the weekly Bollinger Band. ETH/BTC needs to stay above this area, to retain the bullish bias. Once it is cleared, 100-week Simple Moving Average at $0.02642 will come into view. On the the upside the local resistance is created by $0.03200, followed by $0.03300
Above the current price, the first resistance level is at 0.03200, then the second at 0.03300 and the third one at 0.0350.
Below the current price, the first support level is at 0.03000, then the second at 0.0260 and the third one at 0.0250.
BTC/USD Daily Chart
-637314432662974288.png)
BTC/USD is currently trading at $10,240. The first digital coin retreated from the recent high of $10,334 but managed to settle above the psychological $10,000. This barrier served as a critical resistance and now provides a backstop in case of the downside correction. The short-term trend is bullish as long as the price stays above this technical level. BTC/USD has gained over 3% in the recent 24 hours. The next local resistance comes at $10,300. Once it is out of the way, the upside is likely to gain traction with the next focus on the highest level of $10,522.
Above the current price, the first resistance level is at $10,200, then the second at $10,500 and the third one at $11,000.
Below the current price, the first support level is at $10,000, then the second at $9,800 and the third one at $9,350.
ETH/USD Daily Chart
-637314433533938582.png)
ETH/USD is currently trading at $322.18. The second-largest digital asset has been growing for the seven days in a row amid strong bullish momentum supported by DeFi boom and growing retail interest to ETH options. ETH/USD rushed outside the daily Bollinger Band and now the upper line of this rising channel serves as local support for the coin that separates the price from a deeper decline to psychological $300.00. On the upside, the next resistance is created by the recent high at $329.21 followed by $350.00
Above the current price, the first resistance level is at $329, then the second at $350 and the third one at $400.
Below the current price, the first support level is at $310, then the second at $300 and the third one at $242.
XRP/USD Daily Chart
-637314434054423522.png)
XRP/USD is currently trading at $0.2188. The coin managed to stay above 200-dail SMA at $0.2100 after the retreat from the Sunday's high of $0.2252. The coin faced a stiff resistance on approach to $0.2250 reinforced by 50-week SMA and the upper line of the weekly Bollinger Band. On the downside, if $0.2100 gives way, the short-term bullish scenario will be invalidated and $0.2000 will come back into view. On the upside, the initial resistance is created by $0.2200. Once it is out of the way, the upside is likely to gain traction with the next focus on the recent high 0.2250.
Above the current price, the first resistance level is at $0.2200, then the second at $0.2250 and the third one at $0.2300.
Below the current price, the first level of support is at $0.2100, then the second at $0.2000 and the third one at $0.1900.
Author

Tanya Abrosimova
Independent Analyst


