- Bitcoin as a target for money facing a new equity sell-off.
- Ethereum has a wide margin of improvement to catch up with Bitcoin.
- Technical indicators are warning that today's upward movement may be just a mirage.
In the world of technical analysis, there are decisive moments, as in everything, and Bitcoin is in one of those moments.
One of the most highlighted aspects in the last hours is whether the decoupling between Bitcoin and the equity markets has started.
The comparative chart between Bitcoin, Ethereum and S&P500 give us that information, and it is relevant.
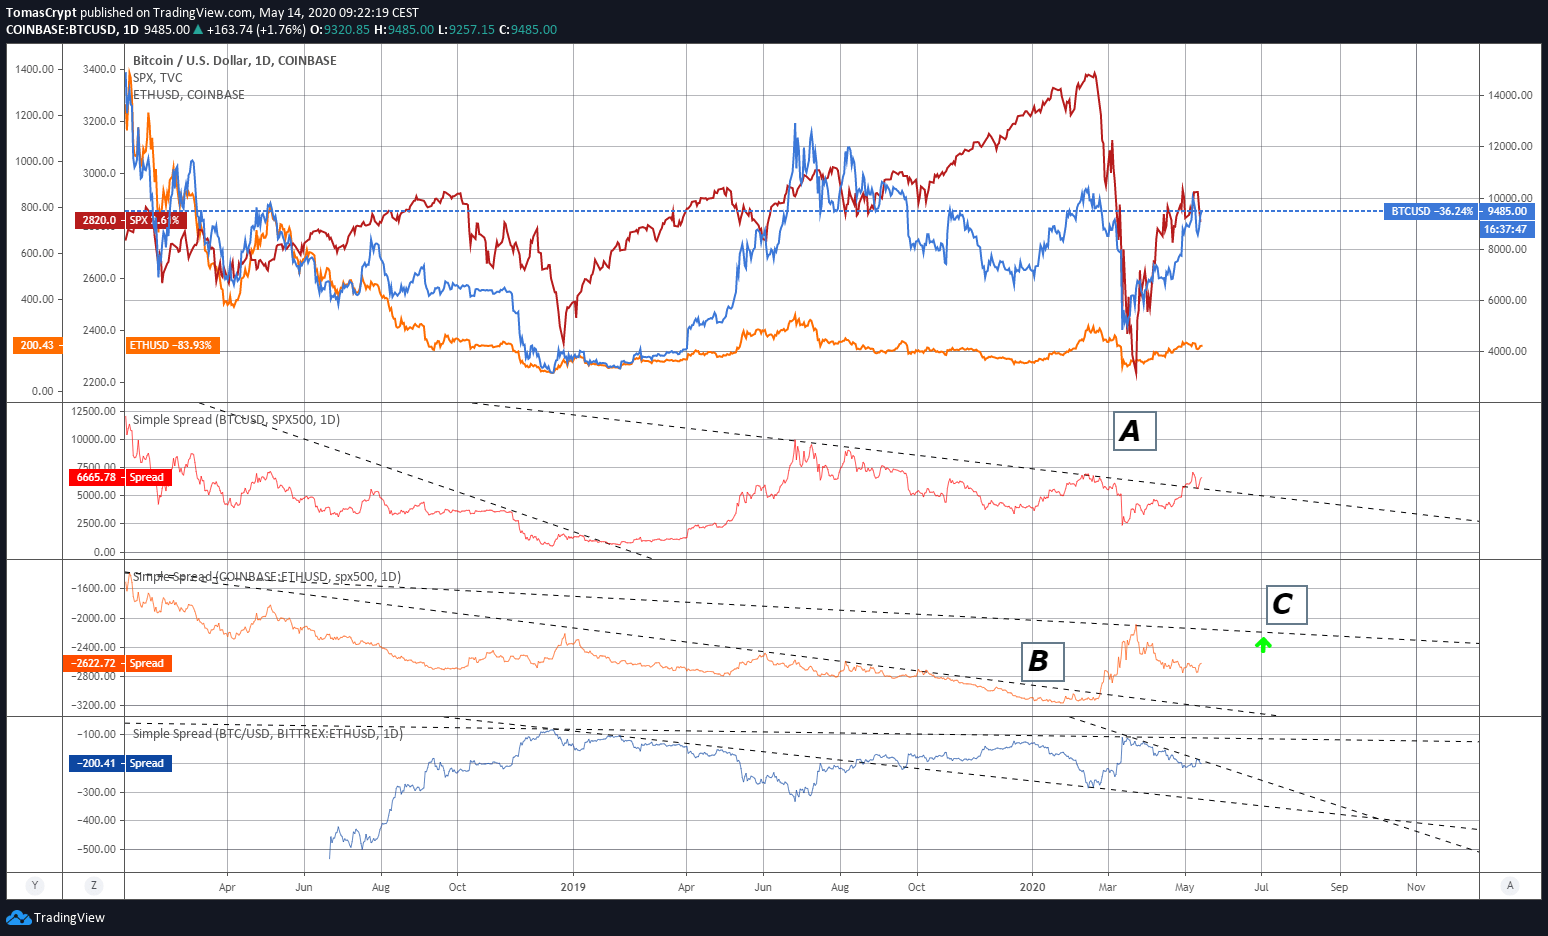
Bitcoin has been performing relatively less than the S&P500 since the end of 2017 – historic highs of the BTC/USD pair – but that has changed in the last few sessions.
The spread indicator between the BTC vs S&P500 shows an upward break (A) from the downward trend that started in December 2017. In January 2019, the relationship between the two assets reached a relatively low and from that moment on a rising trajectory began that has led to the current situation.
If the movement consolidates, the announcements of loss of correlation between crypto and equity markets will be confirmed, and we will enter a new era for cryptocurrencies.
Ethereum also plays this game, and for the time being, is the lagging member of the journey. Ethereum kept the negative relationship against the S&P500 until last February 23rd when it broke the upward trend that the spread indicator (B) had been showing. The next clear target for Ether is in the bearish trend line (C).
As for the relationship between Bitcoin and Ethererum, BTC had a breakout attempt last March, but it failed, and since then the trend has been favorable for ETH. Since the beginning of this month, Bitcoin has again taken the lead, but the trend favoring Ethererum is still intact.
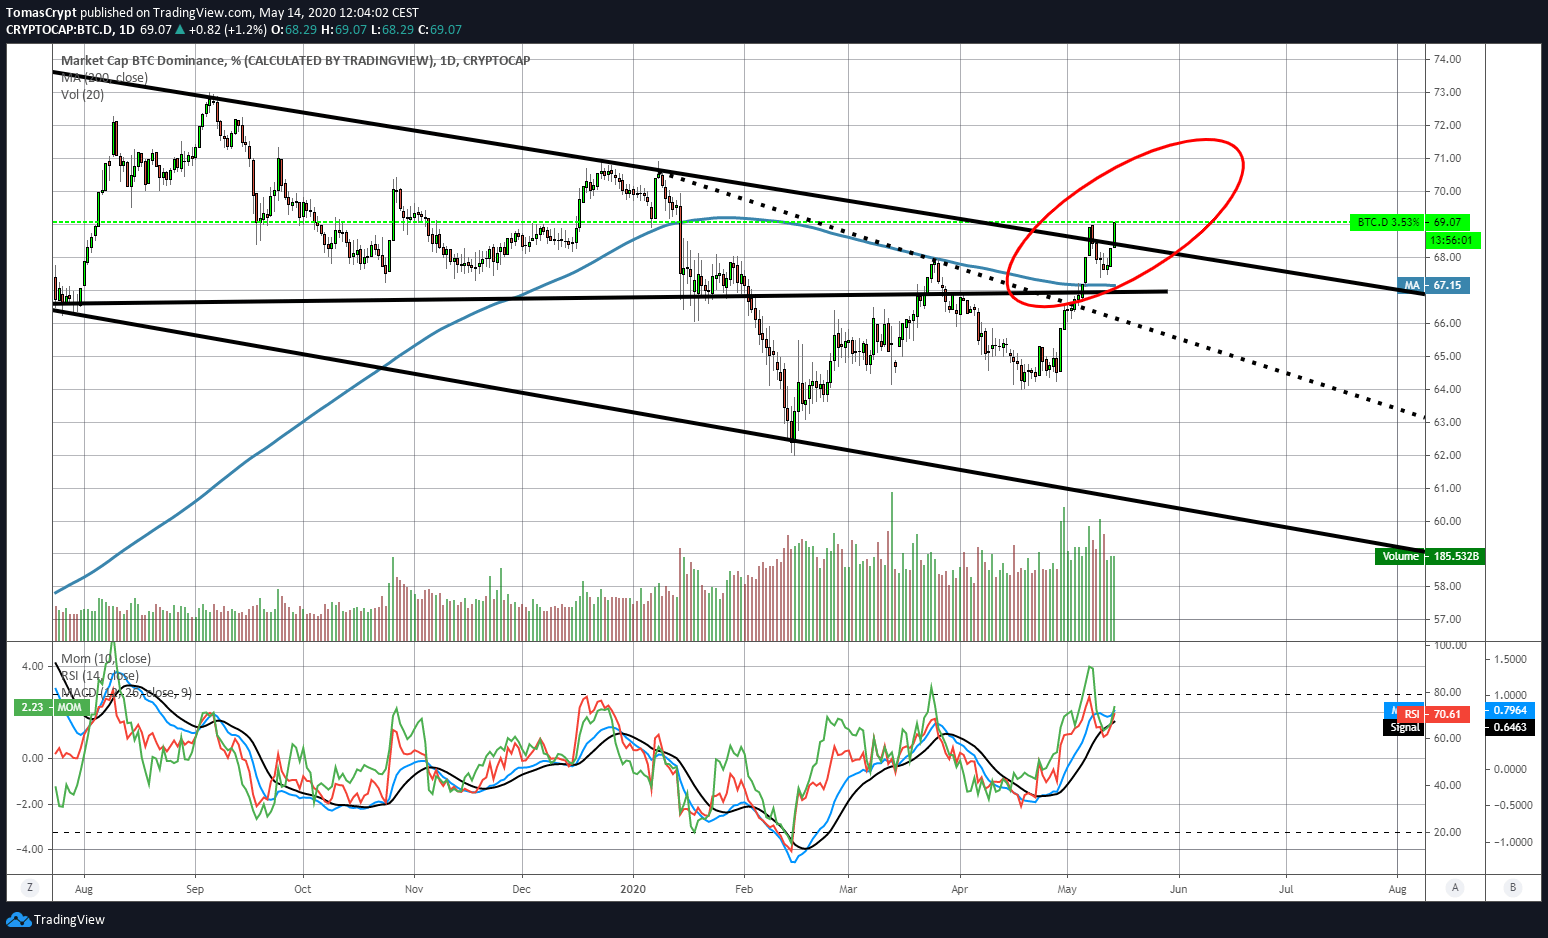
The Bitcoin dominance chart confirms the breaking of the long-erm downward slope for the second time in two weeks. Today's breakout needs a few more days to be considered valid. Technical indicators are showing an exhausted bullish profile and are decreasing the chances of the movement continuing upwards.
From this analysis, we can draw the following conclusions:
- Bitcoin is receiving a significant flow of capital, which allows it to decouple from equities and at the same time, increase the market share in the crypto ecosystem.
- The drain of wealth to Bitcoin within the crypto ecosystem is at the expense of the secondary Altcoins, not Ethereum. In recent months, Ether has done better than Bitcoin.
- Ethereum has a long way to go to catch up with Bitcoin. Its market share has been declining since records began – in mid-2017 – but the upcoming release of version 2.0 of the Ethereum protocol may catalyze a change in trend.
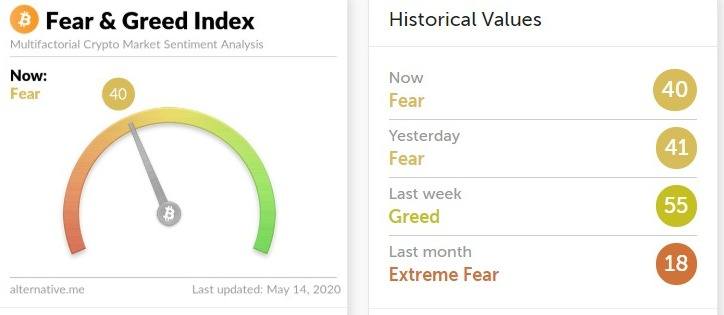
The market sentiment indicator Fear & Greed Index, prepared by alternative.me, is surprisingly at level 40, one less than yesterday and ignores the rise in crypto market prices in recent hours.
ETH/BTC Daily Chart
The ETH/BTC pair is currently trading at the price level of 0.02076 and is moving away from the 200-day simple moving average. The target for the current bearish move is at the base of the bullish channel that begins in December 2019, around the 0.0198 level.
Above the current price, the first resistance level is at 0.0216, then the second at 0.022 and the third one at 0.0227.
Below the current price, the first support level is at 0.022, then the second at 0.0198 and the third one at 0.0186.
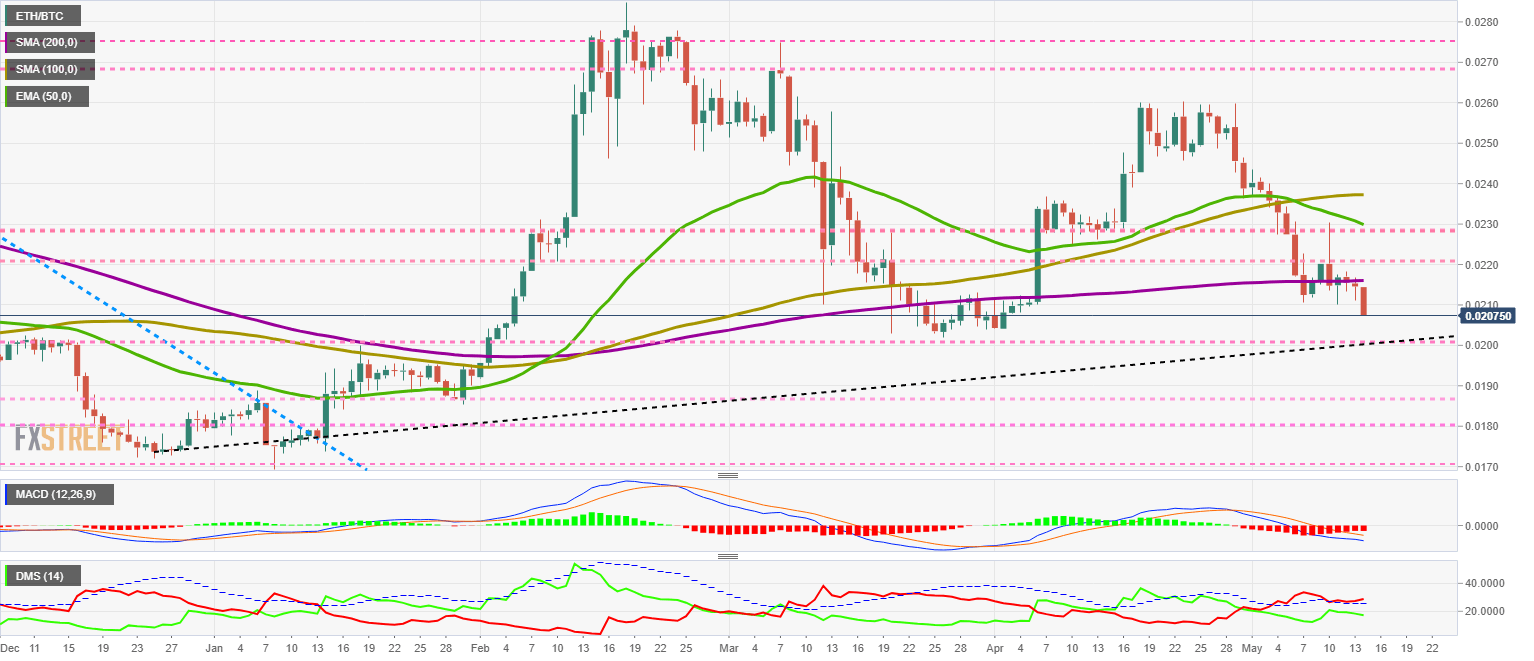
The MACD on the daily chart is increasing its bearish potential. The moving averages are separated, and the downward slope is also growing. The development of the current structure could continue until the end of the current month.
The DMI on the daily chart shows bears moving away from the ADX line and gaining an advantage over bulls. The buying side accepts the loss and moves down without resistance.
BTC/USD Daily Chart
The BTC/USD pair is currently trading at the price level of $9918 and is accelerating the price gains, pointing to the $10000 level as the target for the day.
The main moving averages complete the golden cross, and the 50-day exponential average breaks through the upside with a significant upward trend. The $10000 level is very well protected by price congestion levels, which will make it very difficult to break this mythical level.
Above the current price, the first resistance level is at $10000, then the second at the $102500 level and the third one at $11250.
Below the current price, the first support level is at $9200, then the second at $8800 and the third one at $8400.
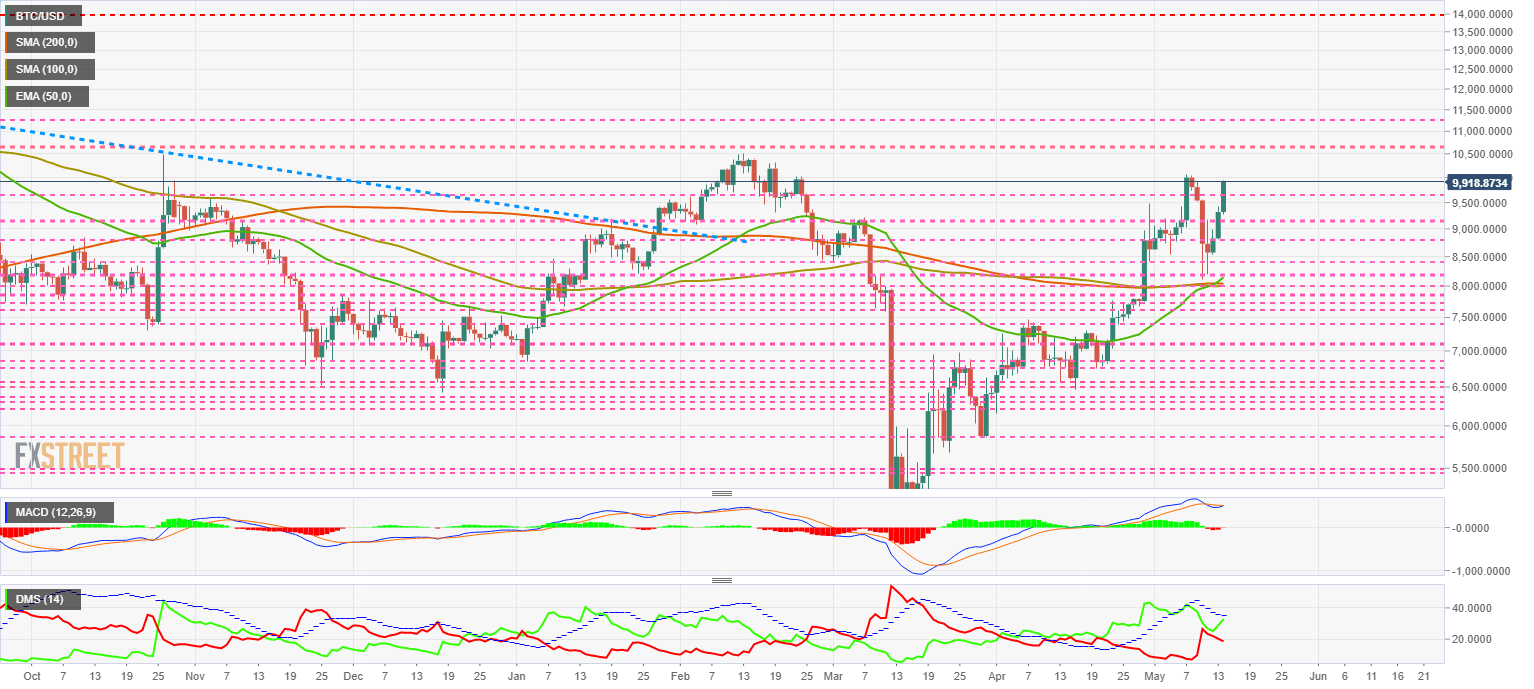
The MACD on the daily chart is moving up and trying to undo the previous bearish cross. The current structure is critical, and the chances of a successful upward movement are limited.
The DMI on the daily chart shows the bulls increasing their lead over the pair. The situation on both sides of the market below the ADX line penalizes the upward movement of the BTC/USD pair. The current structure is fragile and puts the attack on the $10000 level in doubt.
ETH/USD Daily Chart
The ETH/USD pair is currently trading at the $202 price level and is once again moving above this critical psychological milestone. Technically, the level to be surpassed is $230, the last relative high.
The main moving averages are accelerating upwards and reinforce support at the $190 price level.
Above the current price, the first resistance level is at $207, then the second at the $210 level and the third one at $215.
Below the current price, the first level of support is at $200, then the second at $195 and the third one at $190.
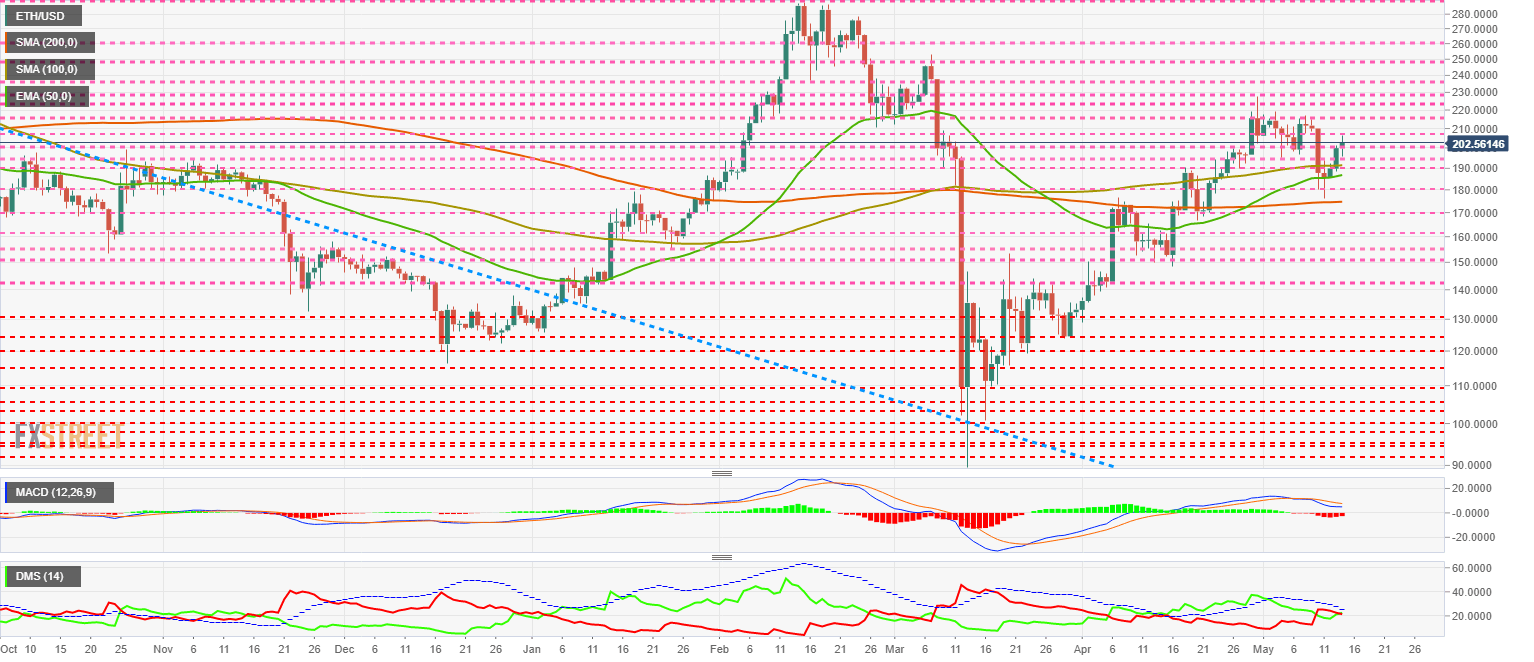
The MACD on the daily chart repeats the pattern already seen in BTC/USD. The MACD on the daily chart repeats the pattern previously discussed in the BTC/USD pair.
The DMI on the daily chart reflects the fragility of the current movement. Bulls and bears are tied after today's rally, a balance that adds uncertainty to today's move.
XRP/USD Daily Chart
The XRP/USD pair is currently trading at the price level of $0.2035 and is moving above the 50-day exponential moving average. If the bullish development continues over time, it could turn the long-term downward trend around.
Above the current price, the first resistance level is at $0.217, then the second at $0.223 and the third one at $0.238.
Below the current price, the first support level is at $0.20, then the second at $0.192 and the third one at $0.172.
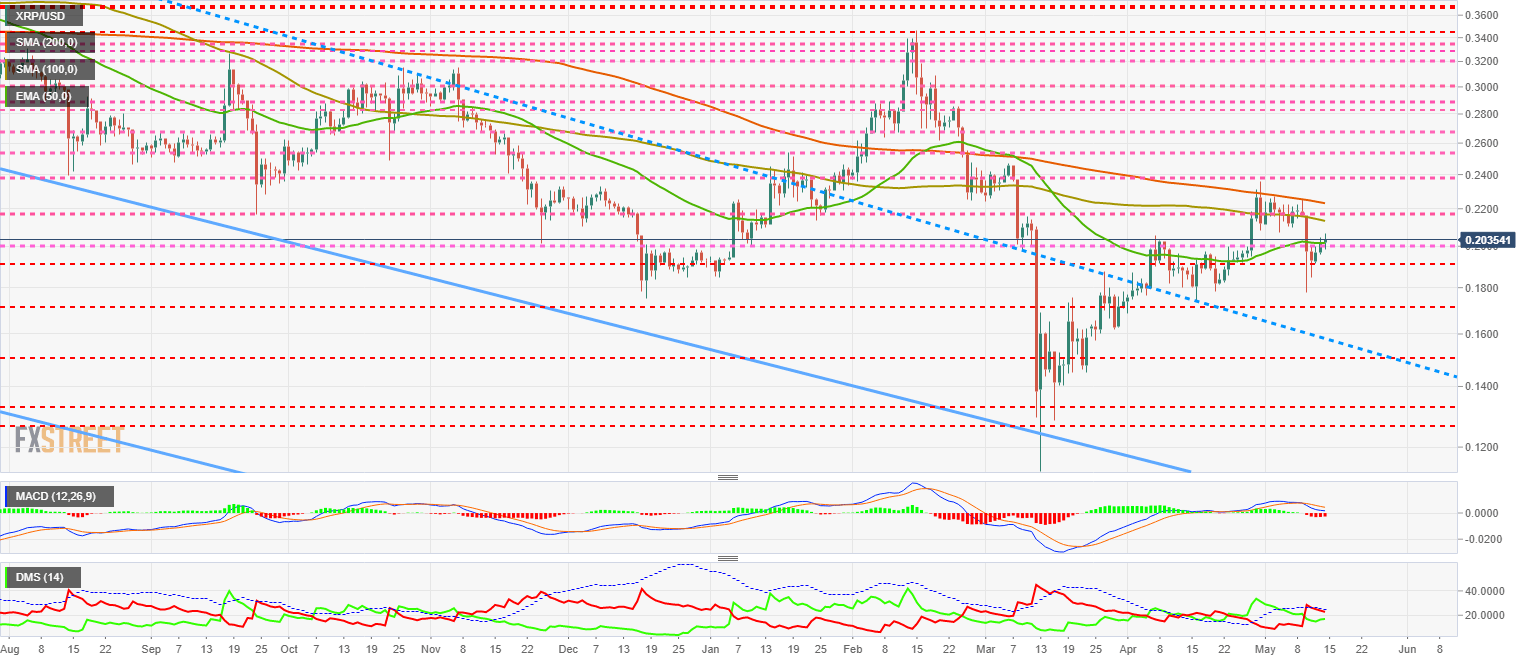
The MACD on the daily chart is attempting to cross back up from the neutral zone of the indicator.
The DMI on the daily chart shows bears sending a strong signal despite the current price rise. Bears can break the ADX line and trigger a bearish pattern that could trap many buyers.
Information on these pages contains forward-looking statements that involve risks and uncertainties. Markets and instruments profiled on this page are for informational purposes only and should not in any way come across as a recommendation to buy or sell in these assets. You should do your own thorough research before making any investment decisions. FXStreet does not in any way guarantee that this information is free from mistakes, errors, or material misstatements. It also does not guarantee that this information is of a timely nature. Investing in Open Markets involves a great deal of risk, including the loss of all or a portion of your investment, as well as emotional distress. All risks, losses and costs associated with investing, including total loss of principal, are your responsibility. The views and opinions expressed in this article are those of the authors and do not necessarily reflect the official policy or position of FXStreet nor its advertisers. The author will not be held responsible for information that is found at the end of links posted on this page.
If not otherwise explicitly mentioned in the body of the article, at the time of writing, the author has no position in any stock mentioned in this article and no business relationship with any company mentioned. The author has not received compensation for writing this article, other than from FXStreet.
FXStreet and the author do not provide personalized recommendations. The author makes no representations as to the accuracy, completeness, or suitability of this information. FXStreet and the author will not be liable for any errors, omissions or any losses, injuries or damages arising from this information and its display or use. Errors and omissions excepted.
The author and FXStreet are not registered investment advisors and nothing in this article is intended to be investment advice.
Recommended Content
Editors’ Picks

Crypto fraud soars as high-risk addresses on Ethereum, TRON networks receive $278 billion
The cryptocurrency industry is growing across multiple facets, including tokenized real-world assets, futures and spot ETFs, stablecoins, Artificial Intelligence (AI), and its convergence with blockchain technology, as well as the dynamic decentralized finance (DeFi) sector.

Bitcoin eyes $100,000 amid Arizona Reserve plans, corporate demand, ETF inflows
Bitcoin price is stabilizing around $95,000 at the time of writing on Tuesday, and a breakout suggests a rally toward $100,000. The institutional and corporate demand supports a bullish thesis, as US spot ETFs recorded an inflow of $591.29 million on Monday, continuing the trend since April 17.

Meme coins to watch as Bitcoin price steadies
Bitcoin price hovers around $95,000, supported by continued spot BTC ETFs’ inflows. Trump Official is a key meme coin to watch ahead of a stakeholder dinner to be attended by President Donald Trump. Dogwifhat price is up 47% in April and looks set to post its first positive monthly returns this year.

Cardano Lace Wallet integrates Bitcoin, boosting cross-chain capabilities
Cardano co-founder Charles Hoskinson announced Monday that Bitcoin is integrated into the Lace Wallet, expanding Cardano’s ecosystem and cross-chain capabilities. This integration enables users to manage BTC alongside Cardano assets, providing support for multichain functionality.
Bitcoin Weekly Forecast: BTC consolidates after posting over 10% weekly surge
Bitcoin (BTC) price is consolidating around $94,000 at the time of writing on Friday, holding onto the recent 10% increase seen earlier this week.

The Best brokers to trade EUR/USD
SPONSORED Discover the top brokers for trading EUR/USD in 2025. Our list features brokers with competitive spreads, fast execution, and powerful platforms. Whether you're a beginner or an expert, find the right partner to navigate the dynamic Forex market.