Top 3 Price Prediction Bitcoin, Ethereum, Ripple: Bitcoin braces for potential short-term correction
- Bitcoin price daily candlestick closes below the weekly support level of $67,147.
- Ethereum price is weakening and could retrace to its immediate support at $3,321.
- Ripple price fails to close above the 50-day Exponential Moving Average.

Bitcoin (BTC) price may initially dip before experiencing a rally, and Ethereum (ETH) and Ripple (XRP) are likely to follow suit, dipping before their potential rallies.
Bitcoin price could sink deeper amid corrective mode
Bitcoin price daily candlestick closes below the weekly support level of $67,147 on Thursday.
BTC could have a short-to-mid-term downward correction in the coming days, tagging the midpoint level of the price imbalance between $63,118 and $64,602 at $63,813.
This midpoint level also roughly coincides with the 50% retracement level at $64,240, calculated from the swing low of $56,523 on May 1 to a swing high of $71,994 on May 21.
If BTC bounces off $63,813, it could rally 12 % to reach its previous resistance level of $71,280.
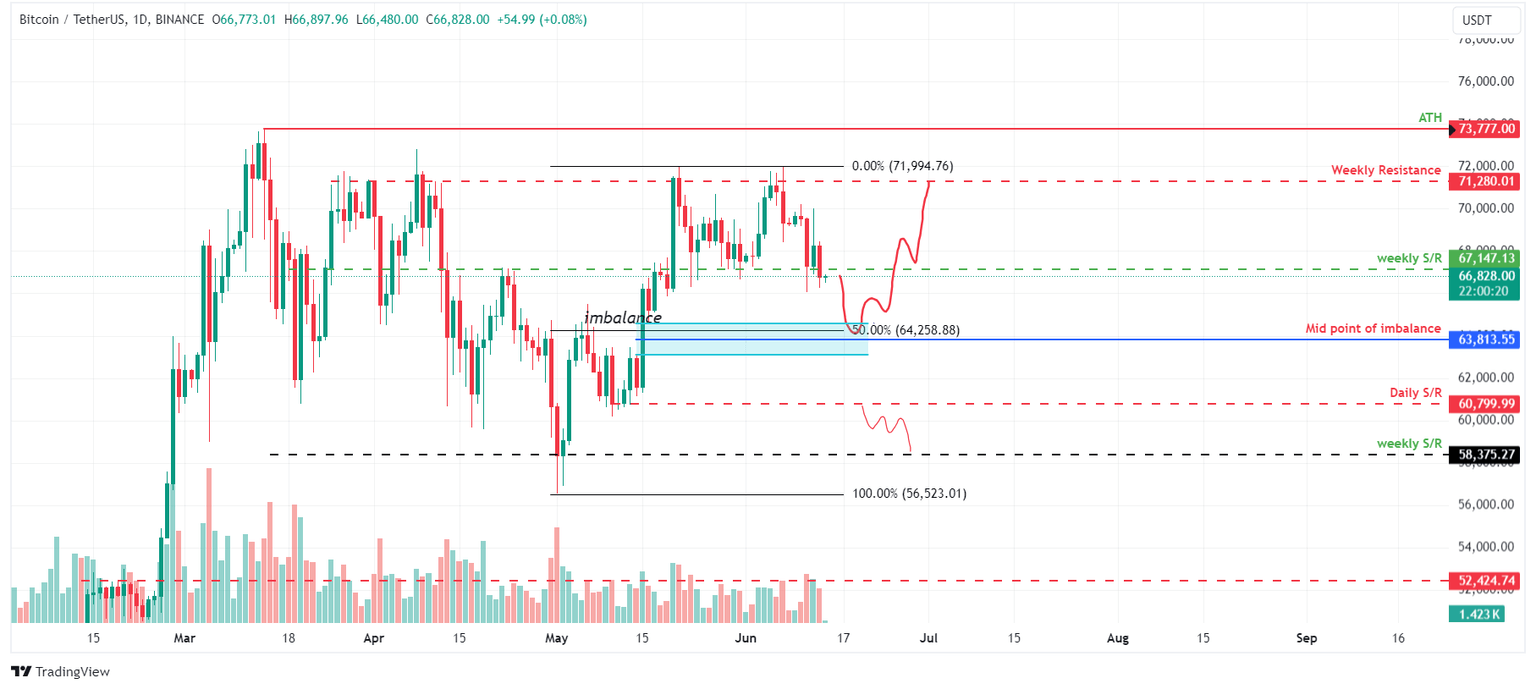
BTC/USDT 1-day chart
On the other hand, if BTC breaks and closes below its daily support level of $60,800, the bullish thesis could be invalidated, leading to a 4% crash, its weekly support level of $58,375.
Ethereum price gears up for further downward adjustment
Ethereum price crashed 11% in the last seven days as it failed to close above $4,000.
ETH could have a short-to-mid-term downward correction in the coming days, tagging in the $3,279, the 61.8% Fibonacci retracement level, calculated from the swing low of $2,864 on May 13 to a swing high of $3,984 on May 27.
The $3,276 level roughly coincides with the midpoint of the price imbalance between $3,146 and $3,498 at $3,321.
If ETH bounces off $3,321, it could rally by 20 % to reach its previous resistance level of $3,977.
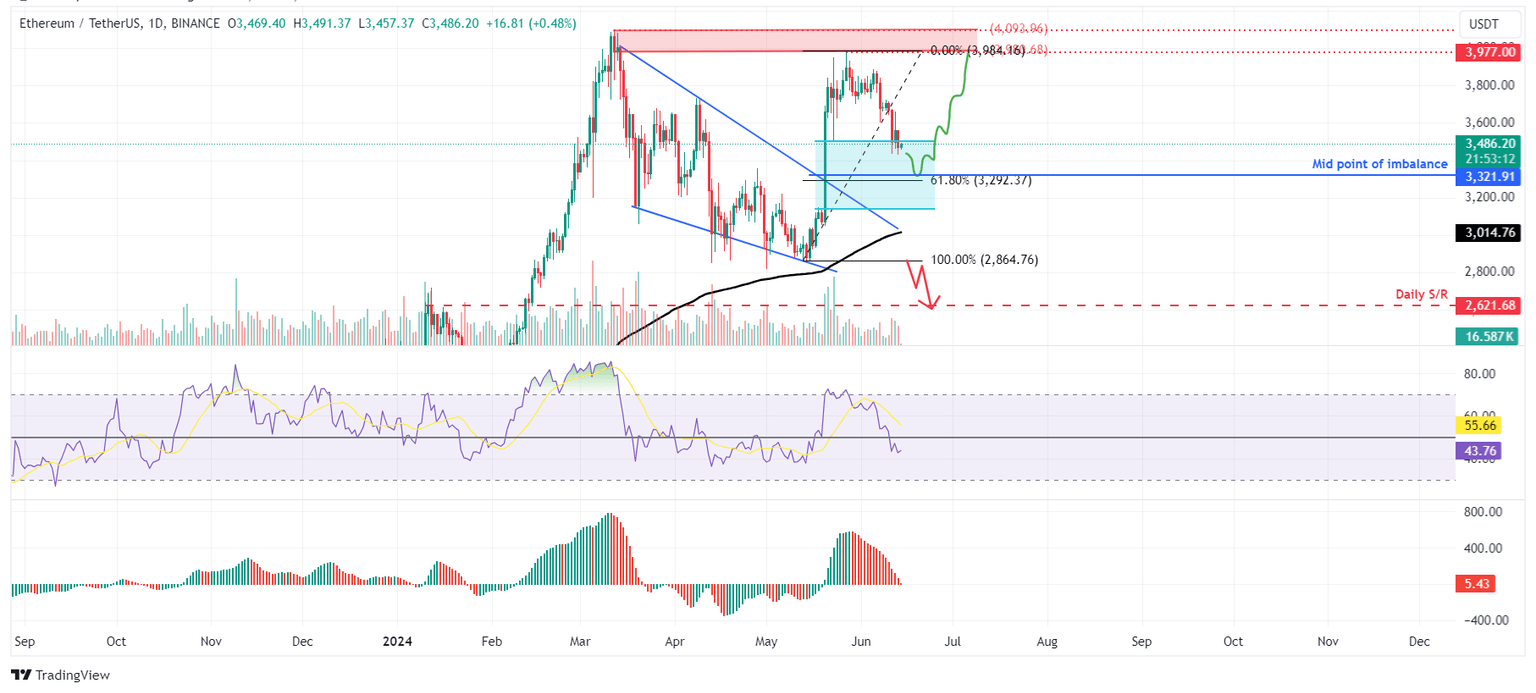
ETH/USDT 1-day chart
However, if Ethereum's daily candlestick price closes below the $2,864 level, it would produce a lower low and signal a break in the market structure. This move would invalidate the aforementioned bullish thesis, potentially triggering an extra 9% crash to the previous support level of $2,600.
Ripple price braces for a correction
Ripple price declined 4% on June 7 and made a daily low of $0.450 after failing to close above the 50-day Exponential Moving Average (EMA) at around $0.527.
Ripple price could have a short-to-mid-term downward correction to its recent low at $0.450.
If this support level holds, XRP could rally 1 % to $0.519, the 50-day EMA level.
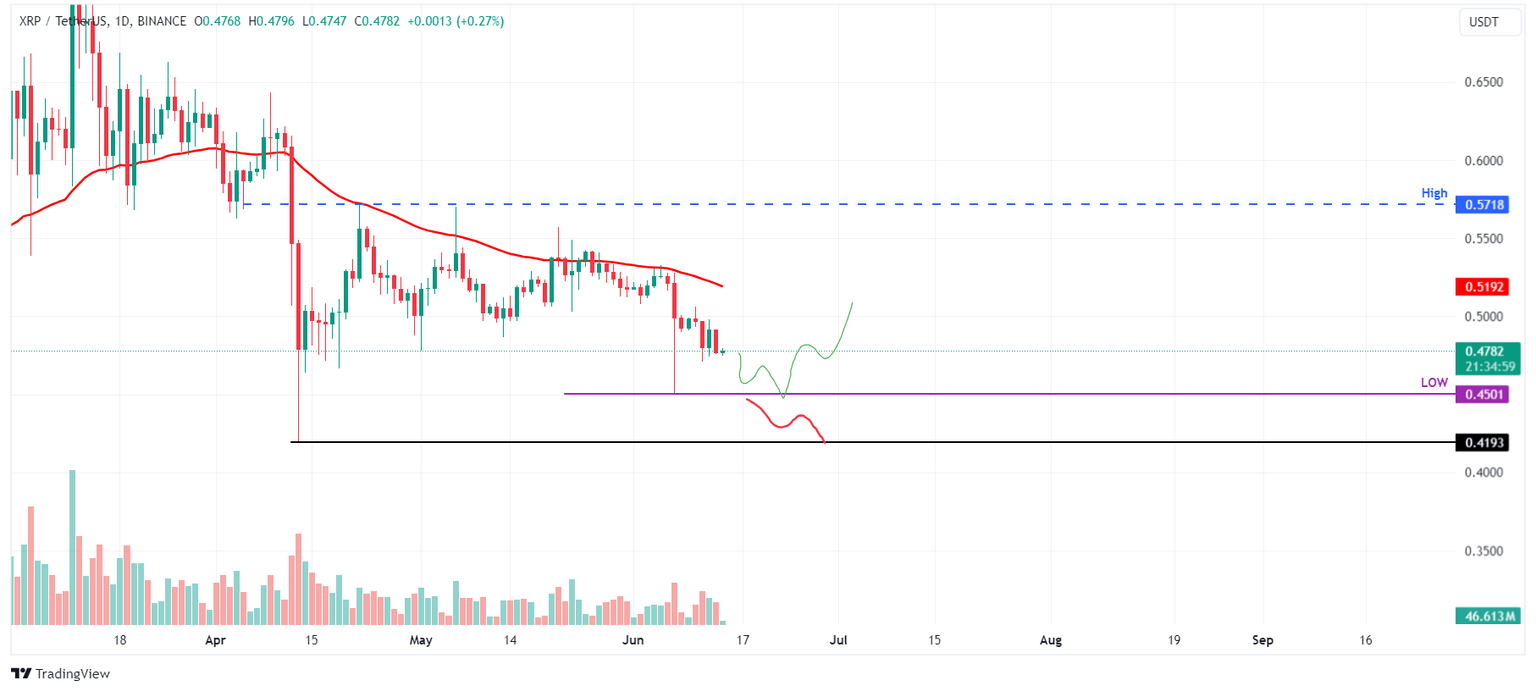
XRP/USDT 1-day chart
However, if the Ripple daily candlestick closes below $0.450, XRP could crash an additional 7% to its previous support at $0.419.
Author

Manish Chhetri
FXStreet
Manish Chhetri is a crypto specialist with over four years of experience in the cryptocurrency industry.


